

Abstract
Background Dehong Prefecture in Yunnan Province, China, borders Myanmar. Its proximity to the ‘Golden Triangle’, one of the world's largest illicit drug production and distribution centre, contributes to drug trafficking and ready availability of heroin. Dehong's 1.1 million people confront a serious HIV problem fuelled by injection drug use. The aim of this study is to improve the 2005 estimates of the true status of the HIV/AIDS epidemic in Dehong Prefecture.
Methods We estimated the HIV prevalence by synthesizing the results from several data sources (HIV/AIDS case reports, surveys, surveillance activities and epidemiological studies). We applied three different statistical procedures for estimations: (i) The Workbook method, adapted to meet the estimation needs in Dehong Prefecture; (ii) An estimate based on antenatal clinical data; and (iii) a dynamic model based on the local epidemic pattern.
Results We estimated that the population prevalence for HIV infections in Dehong Prefecture is 1.3% (likely range from low/high of three estimates: 0.9–1.7%) such that 13 500 people were living with HIV/AIDS in Dehong Prefecture (likely range: 8200–18 300) in 2005. Infections remain concentrated among injection drug users, female sex workers and their clients with an uneven geographical distribution of estimated cases.
Conclusion More reliable estimates of HIV prevalence can be made by synthesizing multiple data sources using several procedures. Current HIV prevention, care and treatment challenges are judged substantial in Dehong Prefecture, regardless of what modelling strategy is used.
Keywords: HIV, AIDS, estimation, model, China, substance abuse
The first large outbreak of HIV in China was identified in 1989 among injection drug users (IDUs) in Dehong Prefecture, Yunnan Province on the Myanmar (Burma) border (Figure 1) in southwest China.1 The specific HIV subtypes first seen in Dehong spread along drug trafficking routes to IDUs in nearby cities2,3 and further afield, including Sichuan Province and Xinjiang Autonomous Region in northwest China.4,5 The HIV epidemic in Dehong continues to be one of the worst in China with 10 043 cumulative reported HIV/AIDS cases (including deceased persons) reported by the end of 2005 in a population of just 1.1 million persons living in an area of 11 526 km2 (smaller than the US state of CT). Dehong's proximity to one of the world's largest illicit drug production and distribution centres, the ‘Golden Triangle’, contributes to drug trafficking and availability of heroin (Figure 1).4,5
Figure 1.

The geographic location of Dehong Prefecture and the distribution of the estimated number of people living with HIV/AIDS by county or city in Dehong Prefecture (B, one dot equals to two HIV/AIDS cases). Dehong Prefecture borders Myanmar on three sides with a ≈500 km border, is situated in the western part of Yunnan Province (A and C). The prefecture has two cities (Ruili City and Luxi City) and three counties (Longchuan County, Yingjiang County and Lianghe County) with 1.1 million persons living in an area of 11 526 km2 (4450 square miles, approximately the size of Jamaica, or the US state of CT). Dehong is an ethnically diverse region with five major distinct ethno-cultural groups
HIV sentinel surveillance, in place in Dehong Prefecture since 1992, has recorded a disturbing rise in HIV rates among both at-risk and general populations, including IDUs, sexually transmitted disease (STD) clinic visitors, pregnant women attending antenatal clinics (ANCs) and hospital patients.4,6 Since 2004, HIV surveillance has been greatly augmented. Expanded screening for HIV has been conducted in Dehong's cities (Ruili and Luxi) and counties (Longchuan, Yingjiang and Lianghe).6 IDUs, female sex workers (FSWs), and male clients of FSWs (as identified by STD clinic surveys) are the notable at-risk subgroups.4,6 Unprotected male homosexual activity and unsafe blood collection practices have not contributed substantially to HIV transmission in Dehong, unlike patterns seen in central or eastern China. Better estimates of the true status of the HIV/AIDS epidemic among different populations can help guide interventions and may serve as a model for improving estimates elsewhere in China. We evaluated critically the quality and generalizability of data from a variety of sources and synthesized a new 2005 prevalence estimate using three different estimation procedures, including workbook-, ANC- and dynamic model-based estimates.
Methods
We applied three procedures to estimate the HIV prevalence for Dehong Prefecture, using different data sources from surveillance, community-based surveys, epidemiological studies and population census data.
Workbook-based estimates
The Workbook method is a WHO and UNAIDS-recommended model in wide use (described in detail elsewhere).7 For the workbook-based estimates, we used data from the general population (without known risk behaviours) and from at-risk groups, including IDUs, FSWs and their clients. We disaggregated data by urban and rural residence. By applying HIV prevalence among pregnant women from community-based surveys and epidemiological studies, we estimated HIV infection rates in general population. However, the community-based surveys recruiting from the general population often include some high risk men and women as a subset. For the general population, we adjusted downward the prevalence estimate to reflect the fact that a larger proportion of recognized infections are from high risk groups, i.e. IDUs, FSWs and clients of FSWs had higher estimated rates and other people had lower rates. The magnitude of downward adjustment was calculated from estimates of the numbers of and HIV prevalence in higher risk groups comparing to those of the general male and female population. The purpose of the adjustments is to remove the disproportionate impact of high risk males and females on the data collected among the general populations. Data from the surveillance system, community-based surveys, estimated sizes of each at-risk group and key epidemiological studies contributed to the adjustment; we also consulted the local surveillance experts who best understand the quality of these data and guided us in avoiding use of unvalidated or otherwise spurious data. Specific community-based surveys were conducted to assess the size of at-risk groups, including IDUs, FSWs and their clients (Dehong Prefecture Center for Disease Control and Prevention, unpublished data).6,8 When the ‘workbooks’ of two cities and three counties were completed, an overall Workbook for Dehong Prefecture was developed to aggregate results into an overall estimate.
Seven sentinel surveillance sites (including four for drug detention centres, one hospital and two STD clinics), 16 community-based surveys and 15 published or unpublished (but good quality) epidemiological studies contributed to the estimates.1,4–6,9–12 Six surveys and epidemiological studies with poor methodology were excluded, e.g. studies with unclear methods, an inadequate description of the population, case report data without adjustments and biased samples within a given group. The 2005 population census data were obtained from the Dehong Prefecture Statistical Bureau.
ANC-based estimates
ANC-based estimates used the HIV prevalence data from five ANC sentinel surveillance sites located in a town for each city or county and five community-based surveys among the pregnant women for the rural areas of each city or county conducted in 2005. All of these data are fully distinct from data used in both the workbook- and dynamic model-based estimates. Random sampling strategies were used in the community-based surveys, where data were supplemented with other surveillance data and epidemiological studies.4,6,13 Data from ANC sentinel surveillance sites and community-based surveys were classified into urban and rural areas in each city or county. The female population ages 15–49 years was divided by urban and rural areas in each city or county, based on population census estimates from 2005.
We assumed that the HIV prevalence from pregnant women attending ANCs and community-based surveys were representative for all women ages 15–49 years. We made this assumption based upon the agreements of the HIV prevalence rates: (i) between the pregnant women attending ANCs and general population women from community-based surveys conducted in the same areas in each town for each city or county; and (ii) between pregnant women from the town and rural general populations for each city or county. We approximated the number of HIV infections among the general population of women ages 15–49 years by multiplying the HIV prevalence among pregnant women by the total number of women ages 15–49 years from population census data stratified by town and rural. We calculated HIV prevalence in the general population of women ages 15–49 years for Dehong by averaging the town and rural estimates weighted with the size of the population for each city or county. We applied the expression for the variance of the sum to calculate the 95% CIs for the HIV prevalence in the general population of women ages 15–49 years.14 Finally, we approximated the number of infected men (15–49 years) in the general population by multiplying the calculated number of infected women by the most recent male-to-female ratio from the case reporting system.15–17
Dynamic model-based estimates
The dynamic model was constructed to incorporate two key modes of HIV transmission—needle sharing among IDUs and unprotected sex among FSWs and their clients, basing on the specific epidemic pattern of HIV/AIDS in Dehong (details described elsewhere).18 This model does not take account transmission of HIV through unsafe blood collection, through non-commercial sex and between homosexuals, as all three modes of transmission are thought to be comparatively rare in this particular region of China. The model was designed to reproduce 16 years of HIV epidemic dynamics in Dehong with high fidelity. Six sub-epidemics were modelled among male IDUs, female IDUs, FSWs, clients of FSWs, the general male population and the general female population. IDUs are regarded as risky if they share a needle for injection drug and safe if they never do so (the latter is a small minority of IDUs). Similarly, FSWs and their clients are regarded as risky if they do not use a condom during sex (unprotected sex) and safe if they always use condoms (again, the latter use pattern is rare). It is likely that HIV started spreading among IDUs and, later, from IDUs to FSWs and their clients; high risk IDUs serve as a bridging population to heterosexuals through sex with FSWs, who, in turn, infect their clients (who may be IDUs).
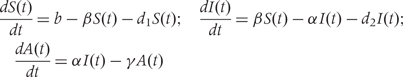
Individuals can go through three states: S (susceptible), I (HIV-positive but without AIDS) and A (AIDS). State I is defined as the time since infection by HIV; the incubation period from HIV to AIDS is given by a Weibull probability distribution. We assume that the individuals in state A will not have infectious contacts with others, a conservative assumption since a subset certainly are at risk of spreading to others. The susceptible people inflow at a certain rate, individuals quit the population by ‘natural’ death, by AIDS-related death or because of a constant ‘aging’ outflow. Transmission of HIV is assumed to occur only through random contacts. We assume that IDUs continue to inject drugs all their lives and that they stay either risky (sharing a needle) or safe (never sharing a needle). Young women can enter the model directly through the at-risk groups of FSWs. If they are not also IDUs, FSWs may stop selling sex after an average of 1 month of FSW activity. However, we assume that FSWs who are also IDUs will not stop selling sex since they need money to support their addictions. We assume that men who have become clients continue to visit FSWs only until they quit the population under consideration because of aging.
The variables are as follows:
S(t) is the number of susceptible people at time t,
I(t) is the number of people who have been infected by HIV at time t, but without AIDS,
A(t) is the number of people with AIDS at time t,
b is the inflow rate of young people into the population or from one group to another group per month,
β is the probability of susceptible people being infected by HIV per month,
α is the rate at which people having been infected by HIV develop AIDS per month,
γ is the death rate of people with AIDS,
d1 is the outflow rate of susceptible people who quit the population by ‘natural’ death, go from a high risk to a low risk group, or ‘aging’ outflow (>65 years of age is considered at time of no further risk for the model),
d2 is the outflow rate of HIV-infected people through ‘natural’ death, from one group to another group, or because of a constant ‘aging’ (>65 years of age) outflow.
The dynamic model is
 |
The probabilities of different subgroups being infected by HIV are different. For IDUs, the probability being infected through shared needles is β IDU = 1 − (1 − τθtη)NIDU; for FSWs and their clients, the probability being infected by HIV through unprotected sex is β SEX = 1 − (1 − (1 − rc) ∑ ρνtλ)NSEX; the probability for IDUs through both unprotected sex and shared needles is β(IDU + SEX) = 1 − (1 − βIDU)(1 − βSEX) = βIDU + βSEX − βIDU β SEX.
τ is the needle sharing rate (a number of times per month) among IDUs,
θt is the prevalence of HIV among IDUs at time t,
η is the transmission probability of HIV per shared needle,
NIDU is frequency of injection among IDUs per month,
rc is the probability that a condom is used per sex act,
vt is the prevalence of HIV infections among sex partners at time t,
λ is the transmission probability of HIV from male to female or from female to male per sex act if no condom is used,
ρ is the ‘pattern of sexual mixing’, the probability of male–female sex contact between the subgroups,
NSEX is the frequency of sex act per month.
The modelled epidemic curves were produced separately for different populations and were then combined to produce a single epidemic curve in order to estimate the HIV prevalence for the entire prefecture and to project its trends over time. The point estimates, with the ranges of uncertainty, were generated by the calculated estimate of this model for 2005. We used data sources including: (i) demographic data, including the size of at-risk population, the mortality rates for male IDUs, female IDUs, FSWs and their clients, the male general population, the female general population and HIV/AIDS patients; (ii) behavioural data, including drug use, needle sharing, sexual activity and condom use, from surveys of general and at-risk populations; and (iii) biological data, including HIV and STD surveillance data and epidemiological data.1,4–6,9–12,19,20
Adjustments for the populations not covered by three estimates
We extended the workbook- and ANC-based methods to all age-groups by adding the approximate number of HIV infections for persons ages 0–14 years and ≥50 years to the estimate in the adult population 15–49 years. Because dynamic model-based estimates covered the 15- to 64-year old population, the adjustment for that model was made by adding the approximated number of HIV infections only for the persons at ages 0–14 years.
The infected people at ages 0–14 years were estimated using the following ‘birth-death probability method’:
N is the number of HIV-infected people at ages 0–14 years in Dehong,
i stands for each single-year age-group between 0 and 14 years,
Mi is the estimated number of HIV-infected 15- to 49-year old women from 1991 to 2005,
Bi is the birth rate (17.33 per thousand in 2005 as per the Dehong Statistical Bureau),
Pi is the probability of transmission from infected mother to infant without intervention, 25% was used,21 since women who discover that they are HIV-infected rarely breastfeed their children; HIV screening and antiretroviral treatment to prevent mother to infant transmission have been implemented in Dehong, therefore, we assume that any infections in that group occurred perinatally and not through breastfeeding22,
IMRi is the infant mortality rate in the general population (32 per thousand was used as per the Dehong Statistical Bureau),
Si is the survival rate of each single-year age-group from 0 to 14 years living with HIV/AIDS and equals 1 death rate of each single-year age-group from 0 to 14 years,
C is the number of infants protected from mother-to-child transmission, estimated from AIDS surveillance data in Dehong Center for Disease Control and Prevention.
The number of HIV-infected people at ages 50 years or older was not estimated by workbook- and ANC-based estimates. We used the case report proportion method,23 calculating the proportion of reported HIV/AIDS cases at ages 50 years or older vs the number of reported HIV/AIDS cases at ages 15–49 years to judge a likely range of infected persons ≥50 years of age.
Results
Using three different statistical procedures and different data sources, we estimated that the prevalence of people living with HIV/AIDS in Dehong was 1.3% (likely range: 0.8–1.7%) such that 13 500 people were living with HIV/AIDS in Dehong (likely range: 8100–18 500) in 2005 (Tables 1–3). The geographical distribution of estimated cases was uneven within counties and cities in the Prefecture (Tables 2–4 and Figure 1) as indicated in the workbook- and ANC-based estimates. The overall prevalence rates of people living with HIV/AIDS varied from a low of 0.3% in Lianghe to 2.0% in Ruili (Table 2).
Table 1.
Estimates of prevalence for HIV/AIDS, by data source and sex, Dehong Prefecture, Yunnan Province in 2005
| Estimated number of people living with HIV/AIDS (range and mid-point) |
Estimated number of people living with HIV/AIDS (range and mid-point) | Estimated prevalence for HIV/AIDS (%) (range and mid-point) | ||
|---|---|---|---|---|
| Data sources | Male | Female | ||
| Workbook-based estimate | 7600–14 600 (11 100) | 2000–3500 (2700) | 9600–18 000 (13 800) | 0.9–1.7 (1.3%) |
| Antenatal clinic-based estimate | 6500–14 900 (10 700) | 1600–3700 (2600) | 8100–18 500 (13 300) | 0.8–1.7 (1.3%) |
| Dynamic model-based estimate | 8700–13 000 (10 900) | 1900–2900 (2400) | 10 600–15 900 (13 300) | 1.0–1.5 (1.3%) |
All estimates for males, females and totals are rounded to the nearest 100.
Table 2.
Workbook-based estimates of HIV/AIDS prevalence by sex and county or city, Dehong Prefecture, Yunnan Province in 2005
| Estimated number of people living with HIV/AIDS (range and mid-point)a |
Estimated prevalence for HIV/AIDS (%) (range and mid-point)b | |||
|---|---|---|---|---|
| City or county | Male | Female | Total | |
| Ruili City | 1200–2300 (1700) | 600–800 (700) | 1800–3100 (2400) | 1.5–2.6 (2.0%) |
| Luxi City | 1600–3000 (2300) | 600–1000 (800) | 2200–3900 (3000) | 0.6–1.1 (0.9%) |
| Longchuan County | 2000–4400 (3300) | 300–600 (500) | 2300–5200 (3700) | 1.4–3.0 (2.1%) |
| Yingjiang County | 2500–4100 (3300) | 500–900 (700) | 3000–5000 (4000) | 1.1–1.8 (1.4%) |
| Lianghe County | 200–700 (500) | 100–200 (200) | 300–900 (600) | 0.2–0.4 (0.3%) |
| Total | 7600–14 600 (11 100) | 2000–3500 (2700) | 9600–18 000 (13 800) | 0.9–1.7 (1.3%) |
aThe estimated number of persons living with HIV/AIDS with plausible bounds and the mid-point, is rounded to the nearest 100.
bThe estimated HIV prevalence with plausible bounds.
Table 3.
Antenatal clinic data-based estimates of HIV/AIDS prevalence by sex and county or city, Dehong Prefecture, Yunnan Province in 2005
| Estimated number of people living with HIV/AIDS (range and mid-point)a |
HIV prevalence (%) (range and mid-point)b | |||
|---|---|---|---|---|
| City or county | Male | Female | Total | |
| Ruili City | 1100–2500 (1800) | 400–1000 (700) | 1500–3500 (2500) | 1.3–3.0 (2.2%) |
| Luxi City | 1500–3500 (2500) | 400–900 (600) | 1900–4400 (3200) | 0.6–1.3 (0.9%) |
| Longchuan County | 1600–3800 (2700) | 300–700 (500) | 2000–4400 (3200) | 1.1–2.6 (1.8%) |
| Yingjiang County | 2000–4500 (3200) | 400–900 (600) | 2300–5300 (3800) | 0.9–2.0 (1.4%) |
| Lianghe County | 300–600 (400) | 100–300 (200) | 400–900 (600) | 0.2–0.5 (0.4%) |
| Total | 6500–14 900 (10 700) | 1600–3700 (2600) | 8100–18 500 (13 300) | 0.8–1.7 (1.3%) |
aThe estimated number of persons living with HIV/AIDS with plausible bounds and the mid-point, is rounded to the nearest 100.
bThe estimated HIV prevalence with plausible bounds.
Table 4.
Workbook-based estimates of the HIV/AIDS prevalence among IDUs, FSWs and clients of FSWs by city and county, Dehong Prefecture, Yunnan Province 2005
| IDUs |
FSWs |
Clients of FSWs |
||||
|---|---|---|---|---|---|---|
| City or county | Population size (range, mid-point) | Prevalence (%) (range, mid-point) | Population size (range, mid-point) | Prevalence (%) (range, mid-point) | Population size (range, mid-point) | Prevalence (%) (range, mid-point) |
| Ruili City | 1500–1800 (1650) | 52.1–63.1 (57.6%) | 700–1000 (900) | 4.9–8.1 (6.5%) | 6900–10 400 (8700) | 2.7–5.7 (4.2%) |
| Luxi City | 3000–3900 (3450) | 34.8–38.4 (36.6%) | 400–600 (500) | 3.1–4.0 (3.6%) | 3800–5700 (4800) | 2.3–3.3 (2.8%) |
| Longchuan County | 4000–5200 (4600) | 44.8–74.6 (59.7%) | 200–300 (300) | 2.7–4.5 (3.6%) | 2200–3200 (2700) | 2.7–3.5 (3.1%) |
| Yingjiang County | 4100–4700 (4400) | 49.0–55.0 (52.0%) | 400–600 (500) | 3.1–4.7 (3.9%) | 3800–5700 (4700) | 2.4–3.2 (2.8%) |
| Lianghe County | 500–600 (550) | 23.7–39.5 (31.6%) | 100–200 (100) | 2.6–4.3 (3.4%) | 1200–1800 (1500) | 2.1–2.9 (2.5%) |
| Overall | 13 100–16 200 (14 700) | 41.5–61.1 (54.4%) | 1800–2700 (2200) | 3.9–5.7 (4.8%) | 17 800–26 800 (22 300) | 2.5–4.2 (3.4%) |
IDU continues to be the main route of HIV transmission in Dehong in 2005. The size of the IDU population was estimated at 15 000 people (Tables 4–6). Both workbook- and dynamic model-based estimates suggest that more than half of IDUs were infected with HIV in Dehong Prefecture (Tables 4–6). The estimated HIV prevalence rates for IDUs varied from a low of 31.6% in Lianghe to 59.7% in Longchuan according to the workbook-based estimates (Table 4). There were approximately 8000 IDUs living with HIV/AIDS, accounting for nearly two-thirds of the total number of estimated HIV cases in Dehong (Tables 5 and 6).
Table 5.
Workbook-based estimates of HIV/AIDS prevalence by subgroups in Dehong Prefecture, Yunnan Province in 2005
| Population size estimates (range and mid-point)a | Estimated number living with HIV/AIDS (range and mid-point)a | Estimated prevalence for HIV/AIDS (range and mid-point)a | |
|---|---|---|---|
| IDUs | 13 100–16 200 (14 700) | 6100–9900 (8000) | 41.5–61.1 (54.4%) |
| FSW | 1800–2700 (2200) | 100–200 (100) | 3.9–5.7 (4.8%) |
| Clients of FSWs | 17 800–26 800 (22 300) | 500–1200 (800) | 2.5–4.2 (3.4%) |
| Remaining population | 1 022 300–1 035 200 (1 028 800) | 3000–6800 (4800) | 0.4–0.8 (0.5%) |
| Total | 1 068 000b | 9600–18 100 (13 800) | 0.9–1.7 (1.3%) |
aThe estimates of the population size and the estimated number of persons living with HIV/AIDS with plausible bounds and the mid-point are rounded to the nearest 100.
bPopulation census data were collected from the Dehong Prefecture Statistical Bureau. The populations are rounded to the nearest 1000.
Table 6.
Dynamic model-based estimates of HIV/AIDS prevalence by subgroups in Dehong Prefecture, Yunnan Province in 2005
| Population size estimates (range, mid-point)a | Estimated number living with HIV/AIDS (range, mid-point)a | Estimated prevalence for HIV/AIDS (range, mid-point)a | |
|---|---|---|---|
| IDUs | 12 200–18 400 (15 300) | 5500–10 200 (7800) | 35.9–66.7 (51.3%) |
| FSW | 2100–3100 (2600) | 90–170 (100) | 3.6–6.7 (5.1%) |
| Clients of FSWs | 20 700–31 000 (25 900) | 600–1100 (900) | 2.3–4.3 (3.3%) |
| Remaining population | 1 015 300–1 032 800 (1 024 000) | 3200–5900 (4500) | 0.3–0.6 (0.4%) |
| Total | 1 068 000b | 9300–17 400 (13 300) | 0.9–1.6 (1.3%) |
aThe estimates of the population size and the estimated number of persons living with HIV/AIDS with plausible bounds and the mid-point are rounded to the nearest 100.
bPopulation census data were collected from the Dehong Prefecture Statistical Bureau. The populations are rounded to the nearest 1000.
Based on the workbook-based estimates, the sizes of population subgroups were estimated at 2200 people for FSWs and 22 300 for their clients (Table 5). The HIV prevalence rate among FSWs was estimated to be 4.8% and for their clients was estimated to be 3.4%. In 2005, an estimated 100 FSWs and 800 clients of FSWs were living with HIV/AIDS, accounting for 0.9% and 5.8% of the total number of estimated HIV/AIDS cases, respectively. Similar estimates were obtained from the dynamic model-based estimates (Table 6).
HIV prevalence varied among pregnant women in different venues, ranging from a low of 0.2% in Lianghe to 1.6% in Ruili (Table 7). The HIV prevalence rates were similar between town and rural pregnant women within a given county or city though town rates in Yingjiang were slightly higher than those in the rural areas. Prevalence rates were also similar between pregnant women from ANCs and community-based surveys conducted in the same areas.
Table 7.
Comparison of HIV prevalence rates among pregnant women between town and rural areas, Dehong Prefecture, Yunnan Province 2005a
| Townb |
Ruralc |
||||
|---|---|---|---|---|---|
| City or county | No. of participants | HIV prevalence (%) | No. of participants | HIV prevalence (%) | P-valued |
| Ruili City | 1973 | 1.5 | 797 | 2.3 | 0.2 |
| Luxi City | 3040 | 0.6 | 2505 | 0.6 | 1.0 |
| Longchuan County | 1176 | 0.6 | 1120 | 0.9 | 0.3 |
| Yingjiang County | 1089 | 1.1 | 1305 | 0.8 | 0.2 |
| Lianghe County | 1542 | 0.2 | 391 | 0.3 | 0.7 |
aHIV infection determined by the enzyme immunoassay (Kinghawk HIV–1/2 antibody assay) and confirmed with western blot.
bANC sentinel surveillance data from each town of the two cities and three counties.
cCommunity-based surveys among the pregnant women for the rural areas of each city and county conducted in 2005, random sampling strategy was applied.
dChi-square test was applied to compare the HIV prevalence between town and rural of each city and county.
Based on the age distribution of reported HIV/AIDS cases, the number of HIV-infected people ages 50 years or older was estimated at 450–860 people from the workbook-based method and 390–870 people from the ANC-based estimate, representing about 4% of all persons living with HIV/AIDS. Using the birth-death probability method, the number of HIV-infected persons ages 0–14 years was estimated to be 110–210 people, about 1% of all persons living with HIV/AIDS.
Discussion
We sought to improve HIV estimates in Dehong Prefecture in Yunnan Province, China, by synthesizing the results from several different data sources and three different statistical procedures. This effort is timely, given the increase in the availability of high-quality data from multiple sources (surveillance system, community-based surveys and epidemiological studies) since 2004. Compared with the overall low HIV prevalence for the entire nation, our estimates of the population prevalence for HIV infections in Dehong at 1.3% suggest that the HIV epidemic in Dehong continues to be one of China's most severely affected locales.23 IDUs represent nearly two-thirds of persons living with HIV/AIDS in Dehong and continue to be an epidemic ‘core transmitter’ group. FSWs and their clients living with HIV/AIDS may account for 6% of infections. There were significant geographic variations in HIV prevalence among IDUs, FSWs and their clients and pregnant women. HIV prevalence already exceeds 1% among pregnant women in both town and rural areas of Ruili and in the town of Yingjiang.
The availability of high-quality data is the essential element for obtaining reliable estimates. Prevalence estimates are more valid from an intensively studied region like Dehong. We have sought to understand and minimize potential errors or bias for each dataset and to validate its representativeness, but uncertainties still remain. For example, the community-based surveys potentially excluding participants with high risk behaviour could lead to an underestimate of HIV prevalence due to the non-responses and refusals to participate; persons who refuse to participate may be at higher risk than more cooperative persons, in our experience.
Each of the three estimates applied in the study has its strengths and limitations. The Workbook method gives a robust point prevalence estimate for persons currently living with HIV/AIDS. This method provides detailed transparency in the modelling process, an automatic consistency and audit check to help eliminate calculation errors, the use of subregional spreadsheets to make estimates for different regions, an emphasis on range estimates rather than a single point estimate and flexibility for adapting specific regional assumptions.
ANC sentinel surveillance provides a good approximation of HIV prevalence among adult women aged 15–49 years in the local community,24–26 as confirmed by our study's other estimates. The prevalence estimates among the pregnant women from ANCs and general women from community-based surveys conducted in the same areas of each town of all cities and counties were similar; moreover, the HIV prevalence rates are more similar between town and rural pregnant women than reported from other parts of the world such as sub-Saharan Africa (data not shown). Although we recognize that demographics of current AIDS cases may differ from current pre-AIDS HIV cases given the decade-long incubation period in the pre-treatment era, we believe that the male-to-female ratio among the persons currently living with HIV/AIDS from case reporting system was reasonably representative of the ratio among people living with HIV/AIDS from general population, as was the case in estimates of HIV prevalence in the United States in the 1990s.16 More widespread routine testing in ANCs began in 2005 in Dehong, and there was also an expansion of overall voluntary counselling and testing in that year. Of 10 043 cumulative reported HIV/AIDS cases by the end of 2005, 7883 were still living with HIV/AIDS representing about 60% of the estimated number of actual HIV/AIDS cases.
While serial surveys of HIV prevalence in ANCs are a simple and inexpensive way to monitor the course of the epidemic, they may contain biases that would either overestimate or underestimate the prevalence in the general population.24–28 New data from population-based surveys on rural populations in Africa revealed that HIV prevalence rates were actually lower than estimated previously, with rural prevalence about 30% lower than urban prevalence. In previous estimations, African rural populations were assumed to be only a 20% lower prevalence than urban populations, thereby overestimating the magnitude of the epidemic.29 The availability of community-based data on rural populations in Dehong Prefecture helps us to avoid this modelling error.
The dynamic model enables us to assess interrelationships between the different at-risk subgroups (male IDUs, female IDUs, FSWs, clients of FSWs, the general male population and the general female population).18 However, the workbook- and the ANC-based estimates do not consider interactions in subpopulations. The dynamic model-based estimates were established at the prefectural level, while the workbook- and ANC-based estimates were developed at a smaller county/city level (Tables 2 and 3). Both workbook- and dynamic model-based estimates can present clearer picture of subgroup dynamics (Table 4–6), but the ANC-based estimates could not examine the details in subgroups.
The estimates were based on a variety of data with different levels of quality. Each data collection method had its strengths and weaknesses. Any estimates from one method alone is subject to substantial uncertainty and potential bias depending upon the assumptions on which the tool/method is based. Therefore, reliable estimates of HIV prevalence are best made by critically synthesizing estimates from several procedures and by a comprehensive evaluation of relevant data.15,16 As part of an ongoing process of improving and developing an appropriate range for estimates, improved methods, enhanced data and new estimation tools are enabling a better understanding of the degrees of uncertainty and bias that surround HIV/AIDS estimates in China, vital for local HIV/AIDS planning and programming. Our findings from three key estimation procedures emphasized the importance of prevention programmes that will reduce needle sharing and unprotected sex by FSWs and their clients, reminiscent of circumstances in the South Bronx in New York City.30 Our estimates also help plan for the magnitude of the care and treatment programme needed for the people living with HIV/AIDS in Dehong Prefecture of Yunnan Province, given that over 1% of the total population is infected.
Funding
National Institute of Health (R03 AI067349 and D43 TW001035, partial); the Vanderbilt University School of Medicine Institute for Global Health; the National Center for AIDS/STD Control and Prevention; the Chinese Center for Disease Control and Prevention; the Dehong Prefecture Center for Disease Control and Prevention; the Yunnan Center for Disease Control and Prevention; the Fifth Round AIDS Project of the Global Fund to Fight AIDS, Tuberculosis and Malaria in China.
Acknowledgements
Drs John Ehiri, Ellen Funkhouser and John Karon helped critique draft manuscripts.
Conflict of interest: None declared.
KEY MESSAGES.
The availability of high-quality data is an essential element for obtaining reliable estimation.
Any estimates from one method alone are subject to substantial uncertainty and potential bias depending upon the assumptions on which the tool/method is based. More reliable estimates of HIV prevalence can be made by critically synthesizing multiple data sources using several procedures.
Current HIV prevention, care and treatment challenges are substantial in Dehong Prefecture, Yunnan Province, China.
References
- 1.Ma Y, Li Z, Zhang K, et al. HIV was first discovered among IDUs in China. Zhonghua Liu Xing Bing Xue Za Zhi (Chinese Journal of Epidemiology) 1990;11:184–85. [Google Scholar]
- 2.Cheng H, Zhang J, Kou J. The overgrowing epidemic of HIV infection in Yunnan Province. Zhouguo Aizibing Xingbing (Chinese Journal of AIDS & STD) 1997;2:54–57. [Google Scholar]
- 3.Zhang J, Chen H, Jia M. The epidemic of HIV infection and prevention researches in Yunnan 1989–1998. Zhonghua Liu Xing Bing Xue Za Zhi (Chinese Journal of Epidemiology) 1999;20:377–80. [Google Scholar]
- 4.Lu L, Jia M, Zhang X, Luo H, Ma Y, Fu L. Analysis for epidemic trend of acquired immunodeficiency syndrome in Yunnan Province of China. Zhonghua Yu Fang Yi Xue Za Zhi (Chinese Journal of Preventive Medicine) 2004;38:309–12. [PubMed] [Google Scholar]
- 5.Wu Z. Global Research Network Meeting on HIV Prevention in Drug-using Populations, Inauguration Meeting Report. June 25–26, 1998. Geneva, Switzerland: National Institute on Drug Abuse; 1999. Recent trends of injecting drug use and related HIV infection in China; pp. 17–20. [Google Scholar]
- 6.HIV/AIDS Surveillance Data: 2005. Kunming: Yunnan Provincial CDC; 2006. [Google Scholar]
- 7.Walker N, Stover J, Stanecki K, et al. The workbook approach to making estimates and projecting future scenarios of HIV/AIDS in countries with low level and concentrated epidemics. Sex Transm Infect. 2004;80(Suppl. 1):i10–13. doi: 10.1136/sti.2004.010207. [DOI] [PMC free article] [PubMed] [Google Scholar]
- 8.Lu L, Jia M, Luo H, Zhang X. Analysis of the first round of HIV behavioral surveillance in Yunnan. Ji Bin Jian Ce (Disease Surveillance) 2003;18:414–17. [Google Scholar]
- 9.Wong WC, Yilin W. A qualitative study on HIV risk behaviors and medical needs of sex workers in a China/Myanmar border town. AIDS Patient Care STDS. 2003;17:417–22. doi: 10.1089/108729103322277439. [DOI] [PubMed] [Google Scholar]
- 10.Wu Z, Detels R, Zhang J, Li V, Li J. Community-based trial to prevent drug use among youths in Yunnan, China. Am J Public Health. 2002;92:1952–57. doi: 10.2105/ajph.92.12.1952. [DOI] [PMC free article] [PubMed] [Google Scholar]
- 11.Liu M, Cao J, Lu X. Characteristics of IDUs and HIV high risk factors in Yunnan and Sichuan Province. Chin J Drug Addictive. 2003;12:204–14. [Google Scholar]
- 12.Yuan J, Geoege L, Xu Q. HIV/AIDS projection in Yunnan Province. Zhonggou Ai Zi Bing Xing Bing (Chinese Journal of AIDS & STD) 2002;8:78–81. [Google Scholar]
- 13.HIV/AIDS Surveillance Data, 1990–2005. Beijing: China CDC; 2006. [Google Scholar]
- 14.Lindman HR. Analysis of Variance in Complex Experimental Designs. San Francisco: W. H. Freeman & Co.; 1974. [Google Scholar]
- 15.Karon JM, Khare M, Rosenberg PS. The current status of methods for estimating the prevalence of human immunodeficiency virus in the United States of America. Stat Med. 1998;17:127–42. doi: 10.1002/(sici)1097-0258(19980130)17:2<127::aid-sim756>3.0.co;2-r. [DOI] [PubMed] [Google Scholar]
- 16.Karon JM, Rosenberg PS, McQuillan G, Khare M, Gwinn M, Petersen LR. Prevalence of HIV infection in the United States, 1984 to 1992. JAMA. 1996;276:126–31. [PubMed] [Google Scholar]
- 17.HIV/AIDS Surveillance Data, 1990–2005. Man City: Dehong Prefecture CDC; 2006. [Google Scholar]
- 18.Ye J, Lu F, Jin S. Projection for HIV/AIDS epidemic among IDUs. Zhonghua Liu Xing Bing Xue Za Zhi (Chinese Journal of Epidemiology) 2005;21:979–81. [Google Scholar]
- 19.Wong WC. Acceptability study of sex workers attending the HIV/AIDS clinic in Ruili, China. Asia Pac J Public Health. 2003;15:57–61. doi: 10.1177/101053950301500110. [DOI] [PubMed] [Google Scholar]
- 20.Zheng X, Zhang J, Wang X, et al. [The natural history of HIV infection among IDUs in Ruili, Yunnan Province, China] Zhonghua Liu Xing Bing Xue Za Zhi. 2000;21:17–18. [PubMed] [Google Scholar]
- 21.Connor EM, Sperling RS, Gelber R, et al. Reduction of maternal-infant transmission of human immunodeficiency virus type 1 with zidovudine treatment. Pediatric AIDS Clinical Trials Group Protocol 076 Study Group. N Engl J Med. 1994;331:1173–80. doi: 10.1056/NEJM199411033311801. [DOI] [PubMed] [Google Scholar]
- 22.The Report on the Baseline-surveys of the Size of At-risk Groups, 2004–2005. Luxi: Dehong Prefecture CDC; 2005. [Google Scholar]
- 23.Lu F, Wang N, Wu Z, Sun X, Rehnstrom J, Poundstone K. Estimating the number of people at risk for and living with HIV in China in 2005: methods and results. Sex Transm Infect. 2006;82(Suppl. 3):iii87–91. doi: 10.1136/sti.2006.020404. [DOI] [PMC free article] [PubMed] [Google Scholar]
- 24.WHO and UNAIDS. 2003. Reconciling antenatal clinic-based surveillance and population-based survey estimates of HIV prevalence in sub-Saharan Africa.
- 25.UNAIDS/WHO Working Group on Global HIV/AIDS and STI Surveillance. Guidelines for conducting HIV sentinel serosurveys among pregnant women and other groups. 2003. UNAIDS/03.49E ed.
- 26.UNAIDS/WHO Working Group on Global HIV/AIDS and STI surveillance. Guidelines for measuring national HIV prevalence in population-based surveys. 2004.
- 27.Saphonn V, Hor L, Ly S, Chhuon S, Saidel T, Detels R. How well do antenatal clinic (ANC) attendees represent the general population? A comparison of HIV prevalence from ANC sentinel surveillance sites with a population-based survey of women aged 15–49 in Cambodia. Int J Epidemiol. 2002;31:449–55. [PubMed] [Google Scholar]
- 28.Timberg C. How AIDS in Africa was overstated: reliance on data from urban prenatal clinics skewed early projections. Washington Post Foreign Service. 2006 Apr 6; [Google Scholar]
- 29.UNAIDS. 2006. 2006 Report on the global AIDS epidemic: A UNAIDS 10th anniversary special edition.
- 30.Drucker E, Vermund SH. Estimating population prevalence of human immunodeficiency virus infection in urban areas with high rates of intravenous drug use: a model of the Bronx in 1988. Am J Epidemiol. 1989;130:133–42. doi: 10.1093/oxfordjournals.aje.a115304. [DOI] [PubMed] [Google Scholar]