Abstract
Most demographic data indicate a roughly exponential increase in adult mortality with age, a phenomenon that has been explained in terms of a decline in the force of natural selection acting on age-specific mortality. Scattered demographic findings suggest the existence of a late-life mortality plateau in both humans and dipteran insects, seemingly at odds with both prior data and evolutionary theory. Extensions to the evolutionary theory of aging are developed which indicate that such late-life mortality plateaus are to be expected when enough late-life data are collected. This expanded theory predicts late-life mortality plateaus, with both antagonistic pleiotropy and mutation accumulation as driving population genetic mechanisms.
Keywords: demography, mutation accumulation, antagonistic pleiotropy, Gompertz equation
Aging research has long employed demographic models of age-specific adult mortality that are based on an approximately exponential increase in mortality (1, 2), the best-known being the Gompertz model
 |
1 |
where the age-dependent rate of mortality, u(x), is determined by two parameters, A and α, that affect mortality in an age-independent and age-dependent fashion, respectively. Aging is sometimes explicitly defined in terms of parameters or functions of this equation (1–3), an example of the latter being the MRDT (mortality rate doubling time; MRDT = ln(2)α−1). The Gompertzian pattern of increasing mortality rate has been explained by evolutionary biologists in terms of a decline in the force of natural selection, a deductive result obtained from evolutionary theory first by Hamilton (4), and then explored further by Charlesworth (5). For populations near demographic equilibrium subject to weak selection, the force of natural selection at age t acting on proportionally uniform changes in survival probability is given by
 |
2 |
where d is the last age of reproduction, T is the generation time, mx and lx are age-specific fecundity and survival probabilities, respectively, and r is the intrinsic rate of increase of the population. The dependence of aging on the force of natural selection has now been corroborated multiple times, especially with laboratory populations of the fruit fly Drosophila (6). In particular, it has been shown that postponed aging evolves readily when the force of natural selection is increased at later ages (7–9).
Late-Life Mortality Plateaus
However, an ostensible anomaly has recently been given considerable attention in the literature: level or declining mortality in the “oldest-old” (10–13, 26), a late-life mortality rate plateau. This phenomenon has been noted anecdotally in the literature of human demography and aging (1, 2, 14). But its experimental demonstration with laboratory dipteran populations has firmly established it as a major scientific puzzle (11, 12). Specifically, late-life mortality plateaus pose a major problem for both demography and the evolutionary theory of aging, ostensibly challenging the foundations of two fields simultaneously.
We will show that late-life mortality plateaus are entirely in conformity with evolutionary theory. The crucial starting point for our first set of analyses is pleiotropy in life-history evolution, a major concern both theoretically (5, 15) and experimentally (6). One of the more puzzling features of the evolutionary analysis of aging is that the force of natural selection drops long before the comparable period of rapid decline in adult survivors (16). This may be due to alleles that are selected because of early beneficial effects that have pleiotropic beneficial effects at some later ages, though not all. Then, for example, middle-aged humans that are surviving better than expected on the evolutionary theory can be explained as the beneficiaries of the action of natural selection at earlier ages. The effects of this type of pleiotropy should fade with age, at adult ages farther and farther away from early adulthood. Such fading is then expected to lead to an exponential increase in age-specific mortality rates (6, pp. 170–171). But this will not proceed indefinitely, because the force of natural selection eventually becomes effectively zero, relative to the effects of mutation and random genetic drift, and remains so thereafter. At late enough ages, natural selection should entirely neglect any remaining age-specific effects, leaving the organism’s life-history unshaped by beneficial substitutions. Of course, age-specific survival could still evolve in terms of both mutation-accumulation and the accretion of antagonistic pleiotropic deleterious effects of substitutions selected for at earlier ages (6), but such evolutionary effects are not to be expected to differentiate between such “oldest-old” age-classes.
For example, suppose that age-specific survival is an exponentially decreasing function of age (lx = e−dx) and fecundity is an exponentially increasing function of age (mx = efx). Then for a population at stable age-distribution where,
 |
3 |
one can show that f − r − d ≤ 0, and so the magnitude of the terms in the numerator of Eq. 2 are exponentially decreasing to 0. In fact this result should hold for any schedule of lx and mx because we can always find a d such that e−dx > lx ∀x and likewise we can find an f such that efx > mx ∀x and thus, e−rxlxmx < ex(f-r-f) → 0 as x → ∞. Consequently, there should always be an age at which the force of selection is so small that it has a trivial impact on allele frequency dynamics, relative to forces like random genetic drift. This result is not new and has been discussed before (5), yet it is a crucial concept for understanding the results in this paper.
The arguments above suggest that it is plausible to expect mortality plateaus at late ages or at least an absence of an age-dependent pattern. However, these arguments have not been explicit about the expected shape of the mortality patterns that will evolve. Below we develop a number of explicit models to illustrate the types of mortality patterns that can evolve in response to selection, mutation, and genetic drift. We feel these specific models illustrate what is possible under a much wider set of conditions.
Evolutionary Models of Demography
Antagonistic Pleiotropy. Initial conditions.
To examine the formal cogency of our intuitive scenario, we have numerically evaluated a variety of different population genetic models. All models used the Malthusian parameter as a measure of fitness (5). We assumed a fixed maximum lifespan of 110 days and a 9-day development time, giving 101 discrete adult age-classes and 9 juvenile age-classes. (This is a dipteran kind of life-cycle; formally, it can be made into a human-scale life-cycle by converting all age-classes and genetic effects into approximately 1 year time units, with the development period somewhat lengthened.) The results presented here apply to randomly generated mutations that are either completely dominant or completely recessive for computational convenience. Additional work with additive models (not shown) has not revealed any qualitatively new behavior.
Each mutation was taken to occur at a distinct locus, independently of every other substitution without epistasis or linkage disequilibrium. Standing genetic polymorphism was not incorporated; thus each new mutant was either lost or went to fixation. A single simulation consisted of generating between 40,000 and 400,000 mutants and altering the life-history of the resident population after a new mutant went to fixation. Results presented in the figures represent the evolved phenotype from one of these simulations. The initial life-history was arbitrarily taken as a survivorship of 90% per day and a fecundity of one egg per day of adult life. This pattern of fecundity was used to avoid biasing the results by starting with an age-specific pattern of fitness. Egg-to-adult survival was set to 85% or a survival rate of 0.982 per day. To simplify the analysis of genetic drift, we assume the effective population size is constant. Implicitly, this means that there is some form of population regulation maintaining a constant population size. While these assumptions all have somewhat arbitrary features, the consistency of our results suggests to us that they will survive variations in these assumptions. Further work with a wider variety of models is under way.
Random genetic drift.
An important component of these models is the impact of random genetic drift on favorable mutants that have very small effects on fitness. Consequently, not all favorable mutations will be fixed by natural selection. We estimate the probability that a favorable mutation will be fixed from theoretical results derived for populations without age-structure (17). Assume that the resident genotype has a fitness of one, the heterozygote, 1 − hs and the mutant homozygote, 1 − s. Let N be the effective population size and α = 2Ns. Then the probability that a mutant allele with an initial frequency of q will be fixed [π(q)] is,
 |
where, ψ(y) = exp{−αy[2h + y(1 − 2h)]}. Fitness is set to r of Eq. 3, and r was solved for numerically by the method of bisection. In the simulations, a uniform random number is chosen and, if it is less than π(q), the mutant is assumed to increase to fixation, otherwise the mutant is assumed lost. This calculation is obviously an approximation to what will happen in an age-structured population. However, we believe it captures the essential qualitative features of drift and selection: when selection is strong there is a high probability of favorable mutants being fixed, and when selection is weak this probability decreases until the chance of fixation is just that of a neutral variant. In these simulations the initial allele frequencies were assumed to be 0.1. This was done for convenience, so that the number of mutants that would have to be generated before a favorable one was fixed did not become excessive, and thus numerical work could proceed within a reasonable time frame.
Our pleiotropy models fall under two broad classes. Those grouped under the heading of model I involve alleles with effects only on age-specific survival probabilities. Those grouped under model II involve alleles with simultaneous effects on fertility and survival. An example of such a gene is abnormal abdomen in Drosophila (18). In all these models, we have calculated the evolutionary impact of at least 40,000 successive mutations, of which only 2000–3000 are fixed by natural selection. All mutations are assumed to have both beneficial and deleterious effects, grouped into two separate “target” periods, each.
Model I.A.
We considered two target periods of fixed duration, either 1 or 40 days, corresponding to extreme “narrow” and “broad” pleiotropy of allelic effects, respectively. The ages at which these effects were imposed were chosen at random. Each mutation has a window of beneficial effects and a window of deleterious effects. The first day of action is chosen independently for the beneficial window and the deleterious window. Windows that would exceed the oldest age-class, 101 adults days, were truncated to have their last effect at adult age 101 days. For each age-class in the window of beneficial effects, the new probability (P̃x) of surviving from the current (x) to the next (x + 1) age-class is given by,
 |
4 |
where δ is a constant set to 0.1 in these simulations, ω is the number of days in the window (either 1 or 40 for these models), and Px is the age-specific survival of the current resident genotype. Deleterious effects were assumed to result in a new age-specific survival value,
 |
5 |
The way in which deleterious and beneficial mutation affected survival were chosen so that survival probabilities were never less than 0 or greater than 1. As shown in Fig. 1, both the narrow and broad cases gave rise to an initial exponential acceleration in mortality rates followed by a later plateau. When mutations affect many consecutive days, the pattern of mortalities is more organized but still results in plateaus at later ages.
Figure 1.
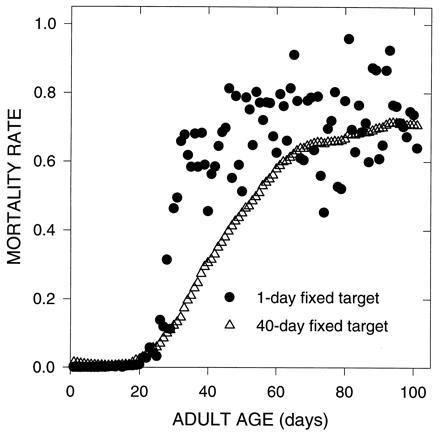
Evolution of mortality rates due to mutations with pleiotropic effects on survival, model I.A. Each computer simulation generated mutations that had both beneficial effects on survival and detrimental effects on survival; effective population sizes (Ne) was fixed at 10,000. The number of days targeted by the beneficial and deleterious components of the mutation were fixed at either 1 or 40 days. The initial day of the beneficial effects was chosen independently from that of the deleterious effects, and each was chosen at random from the 101 adult age-classes.
Model I.B.
In these models the parameter ω in Eqs. 4 and 5 was not a constant but a random variable chosen from a normal distribution with a mean of 10 days and variance 64. Once again, we obtained an initial Gompertzian period of accelerating mortality rates, and a subsequent plateau in mortality, as shown in Fig. 2. This pattern does not depend on some numerical artifact associated with fixed patterns of pleiotropy. An interesting feature of the results is that, if different effective population sizes are used, say 10,000 or 1,000,000, then the mortality plateau moves to the right as effective population size is increased (Fig. 2). This occurs because larger population size weakens the force of random genetic drift relative to selection, enabling a further postponement of aging. This effect is analogous to the impact of shifting the average age of reproduction in experimental tests of the evolutionary theory of aging (6). In addition, we see that, before the plateau, the evolved mortality rates show a reasonable agreement with the Gompertz model. While there are certainly other models that may describe this observed pattern, it is clear that the outcome of this evolutionary process bears a good resemblance to the Gompertz equation, at least for the vast majority of deaths.
Figure 2.
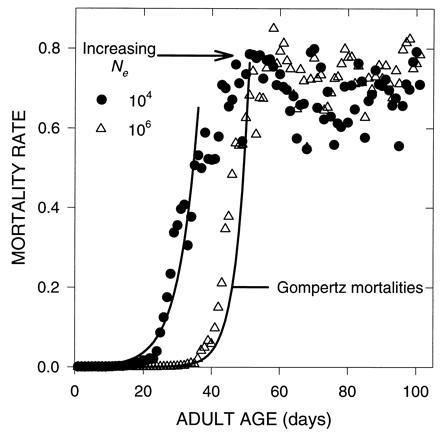
Effect of Ne on the evolution of mortality due to mutations with pleiotropic effects on survival. These simulations were done as before in model I.A, except that the target days were chosen from a normal distribution with a mean of 10 days and a variance of 64. In one simulation, Ne was 10,000; in the second it was 1,000,000. The solid lines are predicted mortalities, before the plateau, from the Gompertz Eq. 1. In each case, the Gompertz explains more than 96% of the variation in the data.
Model II.A.
In the numerical analyses of Model II, pleiotropic effects on both survival and fecundity are allowed. The particular calculations took two forms. With model II.A, analogously to model I, there was one period in which fecundity was affected and one period in which survival was affected. With probability 0.5, survival would experience the deleterious effects and fecundity the beneficial effects, otherwise the effects of the mutant were just the opposite. The width of these periods was taken to be 10 days on average, with either no variation around this value or randomly imposed variation with a standard deviation of 8 days. Survival was altered according to Eqs. 4 and 5. Age-specific fecundity was altered in a similar fashion. Improvements (+) or decrements (−) to the current age-specific fecundity (mx) were calculated as,
 |
where Δ is a constant set to 1 in these simulations. Once fecundity exceeded 100 for a particular age no further improvements were allowed. Results from these simulations (Fig. 3) once again show an initial period of increasing mortality rates followed by a late-life plateau in mortality rates.
Figure 3.
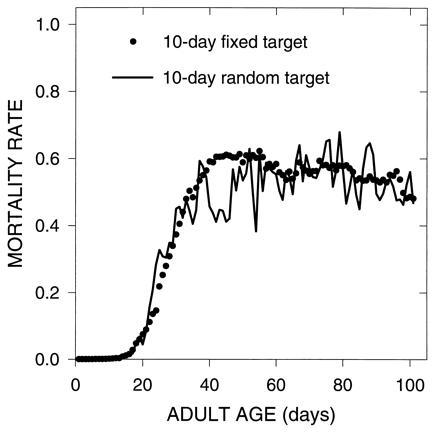
Evolution of mortality due to mutations with pleiotropic effects on survival and fecundity, model II.A. Mutations had pleiotropic effects, as in Figs. 1 and 2, but each mutation affected both survival and fecundity. One simulation generated mutations which always had 10 adjacent days where the beneficial and deleterious effects were expressed (10-day fixed target). The other simulation generated mutations with a variable number of days affected (10-day random target). In that case the number of days was sampled from a normal distribution with a mean of 10 days.
Model II.B.
This model was an attempt to see how robust the findings were with a different kind of algorithm. In this case, pleiotropic effects were scattered over the life-history, 1 day at a time. A random number was chosen to determine if age-specific survival (with probability 0.5) or age-specific fecundity would be affected on a particular day. We used five such effects per mutation, each effect having a mean of −0.44σ and a standard deviation (σ) of 0.1 for fecundity and survival. Consequently, about two-thirds of all survival and fecundity effects were deleterious. We allowed multiple effects per character, per age. All simulations employed 100,000 mutations for model II.B, since a much smaller fraction of these had beneficial effects. As Fig. 4 shows, the same basic pattern still resulted, first in initial Gompertzian increases, and then in a plateau in mortality rates.
Figure 4.
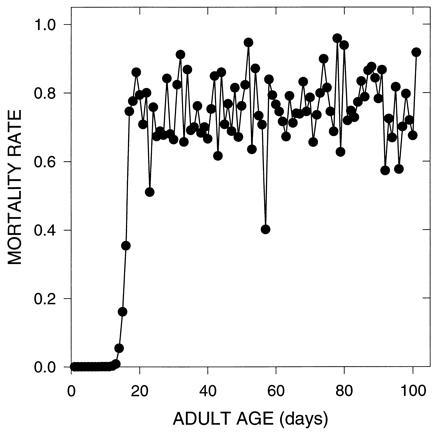
Evolution of mortality due to mutations with pleiotropic effects on survival and fecundity (model II.B). In this simulation, each mutation affected exactly 5 days, but each of the affected days was chosen at random from the 101 day adult life-history for fecundity and the 110 day life-cycle for survival.
Demographic Stochasticity.
Even in very large populations new mutants with beneficial effects may be lost because they fail to leave offspring in the first few generations. The probability, u, that a single new mutant becomes established can be derived from branching theory as (15),
 |
where M = ∑xmxlx, and V ≈ ∑x(lx − lx+1)Mx2 and Mx = ∑y=1y=xmy. These probabilities will be affected in a significant fashion by the presence of population regulation. Since populations do not grow exponentially over the time periods considered in these simulations, we have added density-dependent regulation to the survival and fecundity functions.
The mutants produced by these simulations had very small values of u, some on the order of 10−8. Therefore, to avoid extremely long simulations, we assumed that multiple mutants were formed each generation [actually the mutation rate (0.1) times the effective populations size (109)]. If there were k such mutants, then the chance of one or more of these persisting is equal to 1 − (1 − u)k. The results from this simulation (Fig. 5) show that the evolved mortality pattern is very similar in form to the earlier results based on selection and drift alone.
Figure 5.
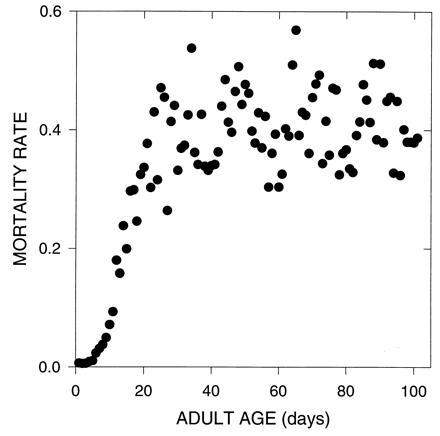
The evolution of mortality due to mutations with pleiotropic effects on survival and demographic stochasticity. The effective population size was assumed to be 109, and the mutation rate 0.1. The stable age distribution was computed by assuming density-regulated survival and fecundity by a one-parameter hyperbolic function, which was set to 0.0001. A total of 400,000 mutations were generated and 374 were eventually fixed to produce the pattern seen above. The fertility schedule mimicked a Drosophila fertility schedule. For the first 19 adult age-classes fecundity was set to 20, 30, 40, 80, 80, 80, 80, 60, 60, 40, 40, 30, 30, 20, 20, 10, 10, 5, and 5. Fecundity was set to 1 for every later age-class.
Mutation Accumulation.
In the absence of pleiotropy, patterns of senescence and mortality may also be affected by mutation accumulation, the rise to high frequency of deleterious mutants acting late in life (19, 20). We examined the consequences of this process on patterns of mortality by assuming the existence of multiple, unlinked loci. Each locus affects only one age-specific survival probability. Assume the resident allele, A1, mutates to a deleterious allele, A2, with probability u. The equilibrium frequency of the A2 allele (p̂2) reached by selection and mutation can be determined from a slight modification of equation 3.44 in ref. 5,
 |
 |
6 |
where l12(x) is the probability of the A1A2 genotype surviving to age x, etc.
The mutation rate was set to 10−6. The equilibrium allele frequency was computed for each mutant affecting a particular age-class separately. The effects of mutants on survival were varied in two stages (Fig. 6). First the equilibrium for the oldest age-class was computed from Eq. 6. With these results the new age-specific survival for the population was computed and the new value of r was computed and used to calculate the new equilibrium frequency for the next younger age-class. This process was repeated until the youngest class was reached. However, since the age-specific survival rates had now been altered, the equilibrium for the oldest age-class was recalculated, and the whole process was repeated to fine tune the equilibrium allele frequencies.
Figure 6.
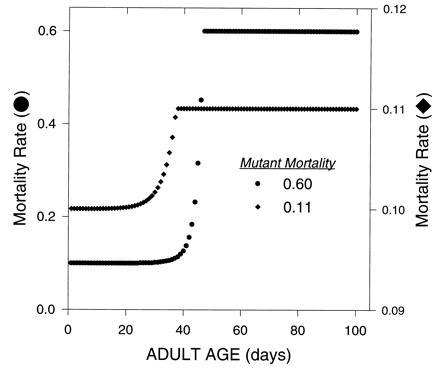
Evolution of mortality due to mutations with deleterious age-specific effects on survival. The single locus mutation-selection equilibrium was calculated with Eq. 6. The mutant allele acted in a additive fashion, with the resident homozygote having a probability of dying equal to 0.10 at each age-class and the mutant homozygote having a probability of dying of either 0.60 (•) or 0.11 (♦). The resulting average age-specific mortality of the whole population is shown above.
Deleterious alleles are kept at very low frequency early in life, then rise rapidly to high frequency later in life, when selection is ineffective, and after that show little change in frequency toward the end of life (Fig. 6). Consequently, this mutation accumulation process also produces a late-life plateau in mortality rates (Fig. 6). These results depend on mutations with very narrow age-specific effects; without this the transition to the plateau would be obscured (21). One would also expect that if this process were the only important one determining mortality rates then the mortality rates in the plateau would eventually rise to 100%. This does not happen in the organisms so far studied. One simple reason why this would not be expected to happen is that the mutations affecting very late survival also have effects early in life, where selection is still effective (22).
DISCUSSION
Overall, it is apparent from these theoretical results that evolutionary theory predicts late-life mortality plateaus. While only a small number of results have been presented here, every single example we have tested has always given rise to plateaus in mortality late in life. The plateaus arise readily in models derived from first principles of evolutionary biology that invoke either pleiotropy or recurrent mutation. This is not surprising, and indeed the results of this paper had been suggested by some earlier work (23). These same first principles also result in age-specific patterns of mortality that are very similar to those predicted by the Gompertz equation for the vast majority of deaths, before the late-life plateau in mortality rates. Thus, this work provides an explanation for why populations should obey a law of mortality, a question dating back to Gompertz himself (24). At this point in the development of the evolutionary theory of demography, we do not claim that the first 99% of all deaths might not be equally well described by one of the major competitors of the Gompertz model (e.g., the Weibull model). Whether there is a deeper connection between the Gompertz equation and the evolutionary theory than the phenomenological one we have pointed out must await further development of this theory.
We have not shown that late-life mortality plateaus always need result from evolutionary processes, though that would be an interesting goal for analytical research, but we have identified a class of evolutionary models that can explain late-life mortality plateaus. The scope of the results in this paper could be expanded by considering models which include two sexes, epistasis, and standing genetic variation. Certainly, late-life mortality plateaus do not call the evolutionary theory of aging into question (13). On the other hand, while most of the mortality data are expected to conform to Gompertzian classes of models, on our theory, this is only true for the first 99% of the mortality. Demographic models exist that predict plateaus in mortality late in life if mortality is governed by a particular process (14). We also expect that optimal life-history theorists will be able to modify their age-specific mortality trade-off functions (25) so as to generate late-life plateaus. But it would seem more appropriate to found demographic models directly on the population genetics theory for evolution in age-structured populations (5), a theory that can readily account for the findings now being obtained by experimental gerontologists and others, without special parameter pleading.
Acknowledgments
We are grateful to D. Borash, S. Frank, A. Joshi, T. Nusbaum, and two anonymous referees for their comments on an earlier version of this article. Copies of computer programs used in this study may be obtained from L.D.M. This research was supported by National Institute on Aging Program Project Grant AG09970.
References
- 1.Comfort A. Aging, The Biology of Senescence. London: Routledge & Kegan Paul; 1964. [Google Scholar]
- 2.Finch CE. Longevity, Senescence, and the Genome. Chicago: Univ. of Chicago Press; 1990. [Google Scholar]
- 3.Hughes K A, Charlesworth B. Nature (London) 1994;367:64–66. doi: 10.1038/367064a0. [DOI] [PubMed] [Google Scholar]
- 4.Hamilton W D. J Theor Biol. 1966;12:12–45. doi: 10.1016/0022-5193(66)90184-6. [DOI] [PubMed] [Google Scholar]
- 5.Charlesworth B. Evolution in Age-Structured Populations. 2nd Ed. London: Cambridge Univ. Press; 1994. [Google Scholar]
- 6.Rose M R. Evolutionary Biology of Aging. New York: Oxford Univ. Press; 1994. [Google Scholar]
- 7.Rose M R. Evolution. 1984;38:1004–1010. doi: 10.1111/j.1558-5646.1984.tb00370.x. [DOI] [PubMed] [Google Scholar]
- 8.Luckinbill L S, Arking R, Clare M J, Cirocco W C, Buck S A. Evolution. 1984;38:996–1003. doi: 10.1111/j.1558-5646.1984.tb00369.x. [DOI] [PubMed] [Google Scholar]
- 9.Partridge L, Fowler K. Evolution. 1992;46:76–91. doi: 10.1111/j.1558-5646.1992.tb01986.x. [DOI] [PubMed] [Google Scholar]
- 10.Barinaga M. Science. 1992;258:398. doi: 10.1126/science.1411534. [DOI] [PubMed] [Google Scholar]
- 11.Curtsinger J W, Fukui H H, Townsend D R, Vaupel J W. Science. 1992;258:461–463. doi: 10.1126/science.1411541. [DOI] [PubMed] [Google Scholar]
- 12.Carey J R, Liedo P, Orozco D, Vaupel J W. Science. 1992;258:457–461. doi: 10.1126/science.1411540. [DOI] [PubMed] [Google Scholar]
- 13.Brooks A, Lithgow G J, Johnson T E. Science. 1994;263:668–671. doi: 10.1126/science.8303273. [DOI] [PubMed] [Google Scholar]
- 14.Gavrilov L A, Gavrilova N S. The Biology of Life Span: A Quantitative Approach. Chur, Switzerland: Harwood; 1991. [Google Scholar]
- 15.Rose M R. Theor Popul Biol. 1985;28:342–358. [Google Scholar]
- 16.Charlesworth B, Williamson J A. Genet Res. 1975;26:1–10. doi: 10.1017/s0016672300015792. [DOI] [PubMed] [Google Scholar]
- 17.Ewens W J. Mathematical Population Genetics. Berlin: Springer; 1979. [Google Scholar]
- 18.Templeton A R, Crease T J, Shah F. Genetics. 1985;111:805–818. doi: 10.1093/genetics/111.4.805. [DOI] [PMC free article] [PubMed] [Google Scholar]
- 19.Medawar P B. An Unsolved Problem in Biology. London: Lewis; 1952. [Google Scholar]
- 20.Edney E B, Gill R W. Nature (London) 1968;220:281–282. doi: 10.1038/220281a0. [DOI] [PubMed] [Google Scholar]
- 21.Partridge L, Barton N H. Nature (London) 1993;362:305–311. doi: 10.1038/362305a0. [DOI] [PubMed] [Google Scholar]
- 22.Charlesworth B, Hughes K A. Proc Natl Acad Sci USA. 1996;93:6140–6145. doi: 10.1073/pnas.93.12.6140. [DOI] [PMC free article] [PubMed] [Google Scholar]
- 23.Charlesworth B. Evolution. 1990;44:520–538. doi: 10.1111/j.1558-5646.1990.tb05936.x. [DOI] [PubMed] [Google Scholar]
- 24.Carnes B A, Olshansky S J, Grahn D. Popul Dev Rev. 1996;22:231–264. [Google Scholar]
- 25.Abrams P A, Ludwig D. Evolution. 1995;49:1055–1066. doi: 10.1111/j.1558-5646.1995.tb04433.x. [DOI] [PubMed] [Google Scholar]
- 26.Vaupel J W, Johnson T E, Lithgow G J. Science. 1994;266:826. doi: 10.1126/science.7973641. [DOI] [PubMed] [Google Scholar]


