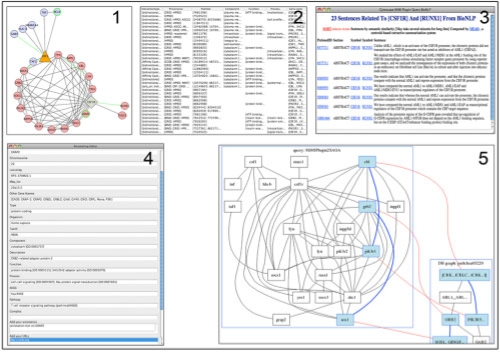
Fig. 1.
Panel 1 shows the csf1r interaction network with extended network on gene csf1. Panel 2 shows ‘provenance’ and ‘PubMed’ attributes of interaction. Panel 3 shows literature information retrieved from BioNLP database. Panel 4 is an annotation editor that shows the attributes from MiMI and the annotations added by the users. Panel 5 shows the match of KEGG pathway and selected network using SAGA.

