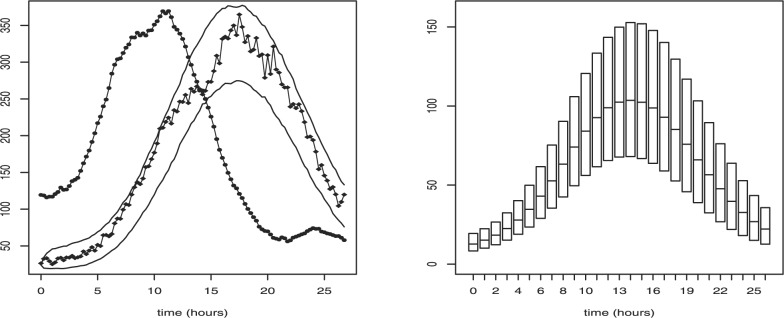
Fig. 3.

Left: Time series of fluorescence intensity used in case study 3. Solid and dashed lines represent experimental and simulated data, respectively. The variation of the SDE fit to the real data is shown by the 5% and 95% values computed from 1000 simulations of the SDE (using mean posterior parameter estimates). Right: Box-plot representing transcription profile in molecules per hour inferred from experimental data presented in the top figure. Each box represents 50% credibility interval and median of posterior distribution of the reconstructed transcription rate at particular time point.
