Abstract
A series of self-assembling multidomain peptides have been designed, synthesized, and tested for their ability to individually suspend single-walled carbon nanotubes (SWCNTs) in water while preserving strong near-IR nanotube luminescence. Photometric and spectral measurements on individual SWCNTs revealed that emission in the common biocompatible coating agents Pluronic F127, ss-DNA, and BSA is approximately an order of magnitude weaker than in the bio-incompatible ionic surfactant SDBS. By contrast, one of the engineered peptides gave SWCNT emission ~40% as intense as in SDBS. A strong inverse correlation was also found between the spectral line widths of coated SWCNTs and the efficiency of their emission. Peptides with rationally designed self-assembly properties appear to be promising coatings that may enable SWCNT optical sensing applications in biological environments.
Keywords: fluorescence, microscopy, multidomain peptides, spectroscopy, emission, self-assembly, marker
Introduction
Single-walled carbon nanotubes (SWCNTs) have recently been recognized as exceptional near-IR fluorophores that display unexcelled photostability,1,2 high optical anisotropy,3 large Stokes shifts,4 and an absence of fluorescence intermittency.1,5 This unique combination of optical properties is not found in other emissive labels such as quantum dots or fluorescent dyes, making SWCNTs uniquely promising for applications as fluorescent markers and bio-sensors.6,7 Although the maximum near-IR fluorescence quantum yields of SWCNTs are apparently only of order 10%,8–10 their large absorption cross-sections and unusual emission wavelengths allow optical detection with high sensitivity in biological environments.6,11–14 However, certain challenges related to the nanotube surface coating need to be addressed before SWCNTs can realize their potential as biomarkers and sensors.
Raw SWCNTs are highly hydrophobic and aggregated into non-emissive bundles, so they must be dispersed as individuals and covalently or noncovalently functionalized to provide the water compatibility needed for biological applications. As covalent functionalization tends to quench the near-IR nanotube emission,5 it is instead necessary to process the aggregated raw SWCNTs through sonication in surfactant solution followed by centrifugation.15 This gives stable dispersions of individualized, fluorescent SWCNTs noncovalently coated by surfactant. However, the choice of surfactant coating greatly affects the suitability of these dispersions for biological fluorescence applications. First, the coating must confer low toxicity and high biocompatibility. Second, it should permit the SWCNTs to fluoresce with efficiencies comparable to those of pristine SWCNTs suspended in air or isolated in selected anionic surfactants.8,9 Third, the coating should be stable against displacement or disruption in biological environments, possibly through covalent cross-linking to form a shell around the nanotube.14,16 Finally, the SWCNT coating molecules should provide sites allowing chemical linkage of agents designed for biological targeting or specialized sensing.17 It is clearly challenging to meet all of these requirements at once.
Until recently, the choice of biocompatible agents for noncovalent suspension of SWCNTs was limited to only a few materials, including Pluronics (synthetic nonionic surfactants),6,12 single-stranded DNA (ssDNA),18 and bovine serum albumin (BSA).19 Peptides (short sequences of amino acids) form another class of SWCNT coatings. Peptides are particularly promising because available synthetic techniques allow the simple and versatile chemical assembly of amino acids into a variety of engineered structures with tailored functionalities. A number of custom-designed peptides have recently been shown to effectively suspend single-walled carbon nanotubes.20–25 However, except in one case involving limited studies of bulk fluorescence,25 the emissive properties of SWCNTs in these peptide coatings have not been reported. To date, the rational design of peptide SWCNT coatings has focused on optimizing the coating’s affinity for the nanotube surface in order to achieve the greatest capacity for suspending SWCNTs in aqueous media.22,25–31 It is unclear, however, whether this approach also maximizes the emission efficiency of the suspended nanotubes. In this report, we carefully analyze the fluorescence properties of SWCNTs suspended in different environments and demonstrate that the surfactant exerts a profound influence on SWCNT emission efficiency. We explore structure-property relationships in a new series of custom-designed peptides to examine correlations between SWCNT suspension capacity and fluorescence properties of the suspended nanotubes. Finally, we outline a promising strategy for creating high-performance optical labels and sensors based on SWCNTs.
Materials and Methods
Peptide Synthesis and Purification
Peptides were synthesized on a 0.15 mmol scale with an Advanced Chemtech Apex 396 peptide synthesizer using standard Fmoc chemistry. Cleavage and side chain deprotection were performed using a 27:1:1:1 mixture of trifluoroacetic acid (TFA), anisole, water, and triisopropylsilane by volume. The N-terminus of the peptide was acetylated, and the C-terminus was prepared as an amide. We purified peptides using a C-18 column on a Varian PrepStar HPLC, with a linear elution gradient from 95% water, 5% acetonitrile to 5% water, 95% acetonitrile. All HPLC solvents contained 0.05% TFA. Peptides were detected by absorbance at 230 nm, collected, and subsequently characterized by MADLI-TOF mass spectrometry.
Preparation of SWCNT / Peptide Suspensions
Peptides were first dissolved in ultrapure water at a concentration of 10 mg/mL. Single-walled carbon nanotubes grown in the Rice University HiPco reactor (batch HPR 161.1) were used without further purification. SWCNT samples of ~1 mg were weighed out and placed in 1.5 mL Eppendorf tubes. To these were added 1 mL of the peptide solution with pH adjusted to 7. The mixtures were then sonicated for 11 s using a Microson XL 2000 tip sonicator at a power level of 5 W. The sonicator probe was immersed to approximately one-half the solution depth. Each sample was then centrifuged for 5 min in a Sorvall Biofuge pico centrifuge at 10,000 × g. The supernatant was decanted and centrifuged for an additional 10 min, followed by another round of decanting and centrifugation. The parameters in this protocol were chosen to maximize sample fluorescence intensities. Although centrifugation helps to separate aggregated from individually suspended nanotubes, even extensive ultracentriguation does not entirely remove small bundles.15,32 We note that the presence of bundles does not affect our single-nanotube measurements.
Cryo-TEM measurements
A 10 µL drop of peptide-SWCNT suspension was placed on a holey carbon-coated copper grid (Quantifoil, 1.2/1.3 400 mesh) and gently blotted with filter paper using an FEI Vitrobot, forming a thin film on the grid. The grid was dropped into liquid ethane and then transferred into liquid nitrogen. Images were acquired using a JEOL 2010 transmission electron microscope at an accelerating voltage of 200 kV.
Vis-NIR Absorbance and Fluorescence
Bulk absorbance and fluorescence measurements were collected on an NS1 NanoSpectralyzer (Applied NanoFluorescence, LLC). Excitation-emission fluorescence maps were measured on bulk SWCNT samples using a Fluorolog 3–211 spectrofluorometer (Horiba J-Y) equipped with a single-channel liquid nitrogen cooled InGaAs detector.
Near-IR imaging of SWCNT suspensions
Near-IR fluorescence imaging and spectroscopy of individual SWCNTs were performed using a custom-built apparatus described previously.33 It is based on an inverted Nikon TE-2000U microscope with a Nikon PlanApo VC 60× /1.4 NA oil-immersion objective. A combination of a dichroic beamsplitter and a dielectric 946 nm long-pass filter was used to select emission wavelengths greater than 950 nm. A liquid nitrogen cooled InGaAs camera (Roper Scientific OMA-V 2D) sensitive between 900 and 1600 nm was installed on one microscope output port. Another output port was coupled via fiberoptic cable to the input slit of a C140 spectrograph (Horiba J-Y) equipped with a 512-element InGaAs array (OMA-V, Roper Scientific). In this way near-IR emission spectra could be acquired from a selected spatial region of ~1.5 × 1.5 µm at the sample. We excited samples with circularly polarized beams from diode lasers emitting at 658 and 785 nm. The circular polarization ellipticity was ≥ 0.95.
Results and Discussion
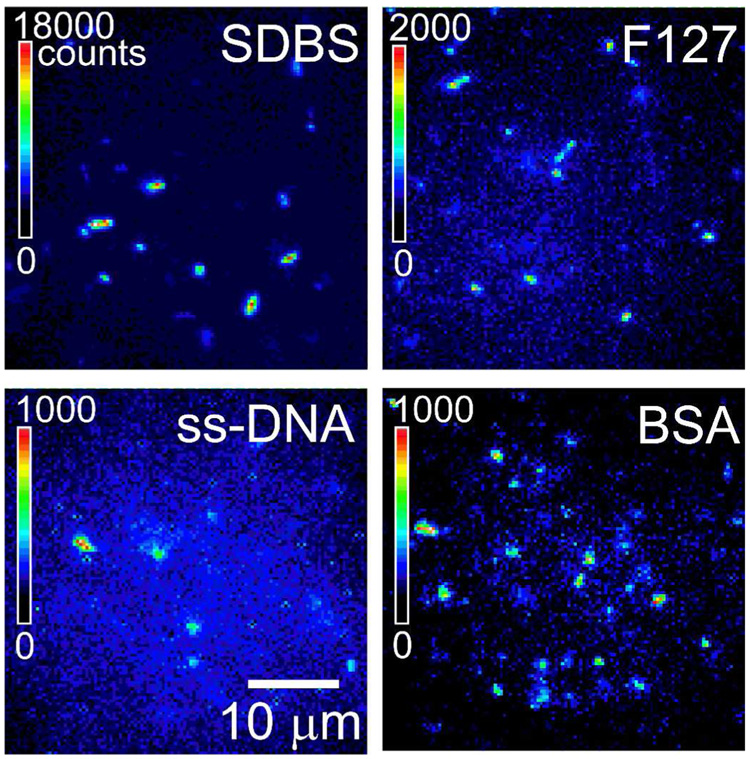
The influence of coating material on intrinsic SWCNT fluorescence efficiency is difficult to assess, because the brightness of a bulk sample will depend on the total nanotube concentration in suspension and the degree to which the suspended nanotubes are individualized (bundling quenches their emission),32,34 in addition to the intrinsic coating-dependent fluorescence efficiency. We therefore applied near-IR fluorescence microscopy to make comparative brightness measurements on individual SWCNTs in dilute samples that differ only in their coating material. Figure 1 shows near-IR fluorescence images of dilute SWCNT suspensions in SDBS, Pluronic F127, ss-DNA, and BSA, obtained using fixed wavelength, circularly polarized excitation. Individual nanotubes in these images differ in apparent brightness because of the distribution of lengths, the distribution of (n,m) structures (governing absorptivity at the excitation wavelength), and the distribution of azimuthal orientations relative to the observation direction.35,36 Nevertheless, it is clear from the differences in intensity scales that the ionic surfactant SDBS (which is not biocompatible) allows by far the strongest near-IR emission within this group. Individual SWCNTs in Pluronic suspension are at least a factor of 10 less bright than those suspended in SDBS, while SWCNTs in ss-DNA or BSA show even weaker emission. Pluronic and BSA coatings have the additional drawback of being vulnerable to displacement or co-adsorption by biological proteins.11
Figure 1.
Near-IR fluorescence images of SWNTs suspensions in aqueous SDBS, Pluronic F127, ss-DNA, and BSA. Images were recorded under the same experimental conditions (excitation wavelength 658 nm, excitation intensity ~ 800 W/cm2, circular polarization, frame acquisition time 50 ms), and plotted using the different false-color intensity scales shown in the frames.
In an attempt to find biocompatible coatings that allow bright SWCNT fluorescence, we have examined the properties of a class of self-assembling custom peptides we call multidomain peptides.37 These are organized with an A-B-A block motif in which the peripheral A domain contains electrostatically charged amino acids such as lysine. The interior B domain of the peptide chain consists of alternating hydrophilic and hydrophobic amino acids, which cause the peptide to assume a β-sheet conformation. The alternating amino acids form a hydrophilic face on one side and a hydrophobic face on the other side of the peptide. This makes the B block a facial amphiphile and provides the driving force for two such peptides to assemble into a “hydrophobic sandwich.” Numerous peptide strands can then self-assemble through β-sheet hydrogen bonding to form nanofibers in aqueous solution. This organization allows the hydrophilic portions of peptides to be solvated by water while the hydrophobic portions remain buried in the core of the nanofiber. The charged A blocks oppose this assembly process through electrostatic repulsion, limiting the size of the fiber and enhancing its overall solubility. Variations in the sizes of the A and B blocks alter the ability of the peptide to self-assemble into a fiber by tuning the delicate balance of hydrophobic packing and hydrogen bonding with electrostatic repulsion.
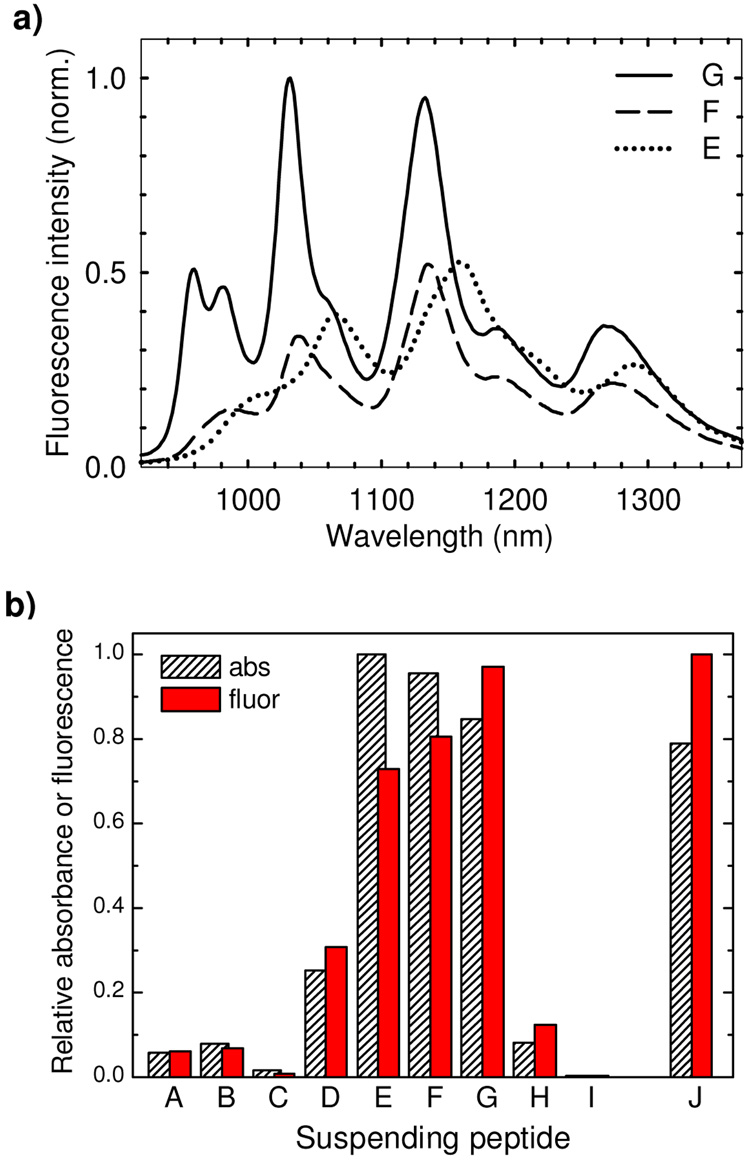
Initially, nine peptide sequences were used in this study to suspend SWCNTs. These are listed in Table 1 along with their simple designations: A – K7(QL)6K7, B – K6(QL)6K6, C – K5(QL)6K5, D – K4(QL)6K4, E – K3(QL)6K3, F – K2(QL)6K2, G – K2(QL)5K2, H – K2(QL)4K2, and I – K2(QL)3K2 (where K, Q, and L denote lysine, glutamine, and leucine, respectively). After suspending SWCNTs using the standardized protocols described in the experimental section, we recorded their absorption and fluorescence spectra. We consider the total suspended nanotube concentration to be proportional to the area under the measured absorbance spectrum, integrated between 500 and 1350 nm (see Supporting Information). The spectrally integrated fluorescence emission instead measures the relative concentrations of individually suspended nanotubes multiplied by their intrinsic fluorescence efficiencies in those suspending peptides. We found that SWCNT samples suspended in peptides E, F, and G yielded the highest concentrations of suspended nanotubes and also the highest total emission intensities. The top frame of Figure 2 displays these three strongest emission spectra, while the bottom frame compares magnitudes of the spectrally integrated emission and absorption signals for all nine peptide coatings. We note that many of these magnitudes varied substantially from run to run, probably because of irreproducibility in the sonication of small volumes and in sampling the SWCNT raw material. Nevertheless, within our series of peptides, E, F, and G consistently gave the most concentrated SWCNT suspensions, with typical peak absorbance values exceeding 1 per cm. These samples appeared stable over periods of a few months, whereas the other peptide suspensions tended to form visible aggregates within days or weeks.
Table 1.
Peptides used in this study.
| Peptide | Sequence | Structure from CD | Forms nanofibers? | Solubilizes SWCNTs? |
|---|---|---|---|---|
| A | K7(QL)6K7 | ? | no | no |
| B | K6(QL)6K6 | ? | no | no |
| C | K5(QL)6K5 | ? | no | no |
| D | K4(QL)6K4 | weak helix | no | weakly |
| E | K3(QL)6K3 | β-sheet | few | yes |
| F | K2(QL)6K2 | β-sheet | yes | yes |
| G | K2(QL)5K2 | β-sheet | yes | yes |
| H | K2(QL)4K2 | random | no | no |
| I | K2(QL)3K2 | random | no | no |
| J | K2(QF)5K2 | ? | ? | yes |
Figure 2.
(a) Fluorescence emission spectra from individual bulk SWCNT samples suspended in peptide coatings E, F, and G. The spectra have been normalized to the most intense peak in peptide G. (b) Average spectrally integrated fluorescence emission and absorbance for bulk SWCNT samples suspended in the family of peptide coatings A through I, and in peptide J (normalized to the maximum values).
Figure 3a,b,c,d shows 2D excitation-emission matrices of SWCNTs suspended in SDBS and in peptides E, F, and G. These data were recorded by scanning the excitation wavelength from 520 nm to 850 nm and the emission wavelength from 900 to 1300 nm. The excitation-emission maps reveal distinct peaks that can readily be assigned to particular (n,m) species by reference to established spectral studies of SWCNTs in aqueous SDS suspension.4,38 We note that the SWCNT spectral peak positions and widths depend significantly on suspending agent. Excitation and fluorescence peaks corresponding to the second (E22) and first (E11) van Hove transitions of disaggregated SWCNTs are progressively shifted to longer wavelengths in peptides G, F, and E as compared to the peak positions in aqueous SDBS. It is often considered that such red shifts arise from more polarizable nanotube environments.39–42 The E11 fluorescence bands also broaden progressively for SWCNTs suspended in peptides G, F, and E. This broadening is illustrated in Figure 3f, which shows bulk emission spectra near the (6,5) peak. Using standard peak-fitting procedures, we deconvoluted the overlapping emission features and deduced (6,5) spectral line widths of ~200, 240, 320, and 480 cm−1, respectively, in SDBS and peptides G, F, and E. As expected, the corresponding E22 excitation profiles shown in Figure 3e have much smaller variations because those spectral widths arise from relaxation processes that are internal to the nanotubes and relatively insensitive to environment.
Figure 3.
2D excitation-emission photoluminescence maps of SWCNTs suspended in (a) SDBS; (b) Peptide G; (c) Peptide F; (d) Peptide E. White spots in (b, c, d) mark peak positions of SWCNTs in aqueous SDBS. (e,f) Excitation and emission spectral profiles near (6,5) SWCNT peaks in various surfactants.
It has been suggested that SWCNT emissive quantum yields also depend on coating.39 However, the influence of SWCNT/surfactant interactions on fluorescence efficiency is not yet well documented or understood. Bulk spectrofluorimetric techniques do not provide a reliable tool for such quantitative comparisons, because even when the fluorescence signals of bulk SWCNT suspensions are normalized to the mass of suspended carbon in the sample, the results can be substantially influenced by small nanotube bundles that may remain after ultracentrifugation. As was recently demonstrated by Crochet et al.,32 further purification of SWCNT suspensions by a density gradient fractionation technique can give a ~20-fold increase in the fluorescence signal per unit of SWCNT mass.
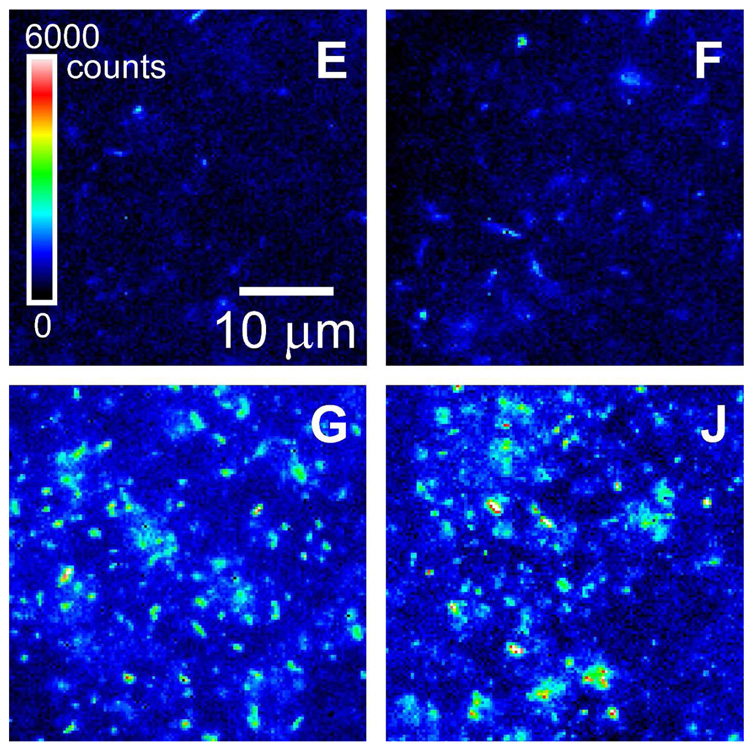
An incisive method for comparing emission efficiencies of SWCNTs is to measure the fluorescence of individual nanotubes.9 Because energy transfer to metallic SWCNTs tends to make nanotube bundles non-emissive,15 their presence is unlikely to interfere with such measurements. We used our near-IR fluorescence microscope/spectrometer to capture emission images of dilute, freshly prepared suspensions of SWCNTs in peptides E, F, and G (Figure 4). These were recorded under the same experimental conditions as the data of Figure 1. We found qualitatively that SWCNTs coated with peptide G displayed significantly brighter emission than those suspended in peptide E, peptide F, Pluronic, ss-DNA, or BSA.
Figure 4.
Near-IR fluorescence micrographs of SWCNTs suspended in peptides E, F, G, and J. Images were recorded under the same experimental conditions (658 nm excitation, ~800 W/cm2 excitation intensity, 50 ms image acquisition time) and plotted with the same false-color intensity scale.
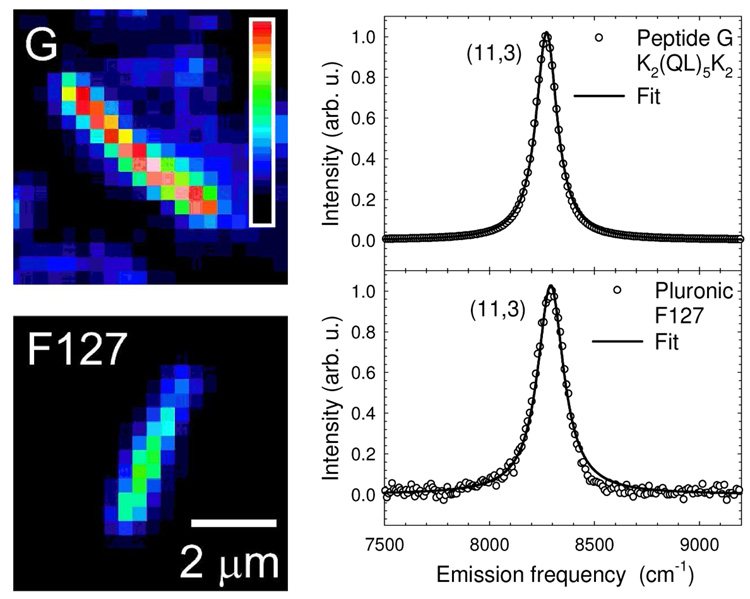
To quantify these differences in emission efficiencies, it was necessary to avoid the complicating effects of sample heterogeneity in length, (n,m) structure, orientation, and defect density. This was achieved through measurements on individual SWCNTs in aqueous suspension that were selected to meet several criteria: length greater than 2 µm (to allow optical resolution); low defect density (estimated from uniform emission along the nanotube length); E11 peak spectral position matching the value found in bulk fluorescence spectroscopy for a known (n,m) species; and free motion indicating that the SWCNT was not attached to a glass surface. Figure 5 shows images and emission spectra of such selected nanotubes coated by peptide G and Pluronic F127. Using the method and apparatus described previously,9,33 we measured the spatially and spectrally integrated emission signal from each nanotube with calibrated excitation intensity and calibrated detection sensitivity to find the absolute product of SWCNT absorption cross section σ and fluorescence quantum yield ΦFl. This product, σ ΦFl, is the fluorescence action cross section. For each SWCNT coating studied here, we analyzed at least 10 nanotubes of various structural (n,m)-types to obtain the results given in Table 2 and Figure 6. Table 2 shows that the intrinsic brightness of individual SWCNTs is significantly affected by the surfactant coating. Using the available data, we computed the intrinsic brightness of each coating relative to that in SDBS by averaging the measured ratios of σ(λ22)ΦFl for corresponding (n,m) species. (λ22 denotes the E22 peak wavelength.) The resulting relative fluorimetric brightness values, which are listed in the last row of Table 2, range from 0.05 to 0.46. Notably, these values are strongly correlated with the spectral line widths of the near-IR emission bands, as will be discussed below.
Figure 5.
Comparison of emission intensities and spectra of SWCNTs in different surfactants. Near-IR fluorescence images of individual (11,3) nanotubes suspended in peptide G (top) and Pluronic F127 (bottom) recorded under the same experimental conditions and plotted using the same false-color intensity scale. Their normalized emission spectra are also shown, with Voigt fits drawn through the data points. The deconvoluted Lorentzian widths are 106 cm−1 in G and 138 cm−1 in F127.
Table 2.
Fluorescence action cross-sections of selected SWCNT species in various surfactants.
| SWCNT species | σ(λ22)×ΦFl (104 cm2/mol C) ; (number of SWCNTs measured) | |||||
|---|---|---|---|---|---|---|
| SBDS | K3(QL)6K3 (E) | K2(QL)6K2 (F) | K2(QL)5K2 (G) | K2(QF)5K2 (J) | Pluronic F127 | |
| (8,3) | 21 | 1.2 (1) | 8.9 (2) | |||
| (7,5) | 19 | 0.76 (3) | 5.1 (2) | 5.8 (1) | 3.1 (1) | |
| (7,6) | 14 | 0.63 (4) | 4.5 (2) | 2.0 (2) | ||
| (10,2) | 27 | 9.8 (3) | 21 (7) | |||
| (12,1) | 17 | 0.98 (3) | 1.8 (1) | 1.5 (1) | ||
| (11,3) | 18 | 1.7 (4) | 3.3 (3) | 1.5 (4) | ||
| (10,5) | 12 | 1.5 (4) | 0.80 (3) | |||
| (9,7) | 10 | 1.1 (1) | 0.83 (1) | |||
| Relative fluorimetric brightness | 1 | 0.050 ± 0.09 | 0.11 ± 0.01 | 0.32 ± 0.09 | 0.46 ± 0.22 | 0.13 ± 0.04 |
Figure 6.
Measured fluorescence action cross sections of selected SWCNT structures suspended in aqueous SDBS (circles), peptide K2(QL)5K2 (G) (triangles), and Pluronic F127 (squares). Data for SWCNTs in SDBS are taken from Ref. 9.
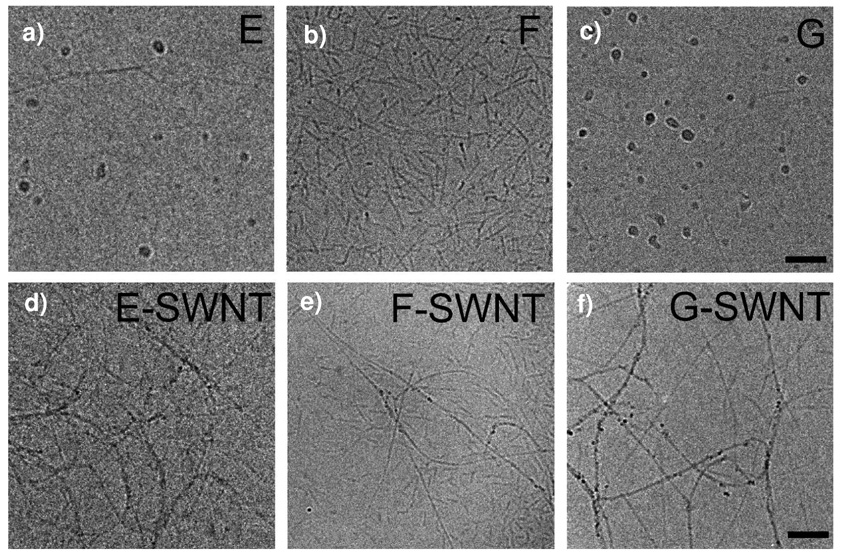
It is interesting to examine the relationship between the ability of a peptide to self-assemble into nanofibers and its ability to individually suspend and allow emission from SWCNTs. Figure 2 illustrates that peptides E, F, and G are the ones within the Kn(QL)mKn series most effective in suspending SWCNTs. As shown in Table 1, these peptides are also the only ones that can assemble into nanofibers. Their dramatic self-assembly properties were described previously.37 For example, it was found that K2(QL)6K2 (peptide F) forms exclusively β-sheet nanofibers ~100–150 nm in length, while K3(QL)6K3 (peptide E) and K2(QL)5K2 (peptide G) self-assemble into mixtures of nanofibers and micelles of various lengths and sizes. This behavior is illustrated by the cryo-TEM images of Figure 7a,b,c, which were acquired from solutions of peptides E, F and G without nanotubes. Figure 7d,e,f shows corresponding cryo-TEM images for these peptides in the presence of SWCNTs. It can be deduced that the added SWCNTs act as templates for peptide self-assembly. Frame 7e clearly shows a number of nanotubes visible as extended structures with lengths of ~300 nm or more, along with shorter fibrils composed of self-assembled β-sheets of peptide F as formed in the absence of SWCNTs. Frames 7d and 7f show that the peptides E and G adsorb onto and suspend SWCNTs in preference to forming fibrils and empty micelles. The peptides most effective at SWCNT suspension seem to be those that have some tendency to self-assemble in the absence of nanotubes. Table 1 summarizes some qualitative properties of the peptides studied here. Although the geometry of peptide F is ideal for forming independently self-assembling nanofibers, the geometrical requirements for wrapping a SWCNT are apparently somewhat different and favor peptide G, which has a slightly shorter amphiphilic region. This selectivity between closely related peptide sequences also demonstrates that these peptides are not solubilizing the nanotubes as a simple amphiphilic surfactant. Instead, the peptides interact with the nanotubes in a more specific fashion in which their tendency to anisotropically self-assemble is reinforced by the presence of the SWCNT.
Figure 7.
Cryo-TEM images of peptide solution samples. (a, b, c) Peptides E, F, and G peptides without SWCNTs. (d, e, f) Peptides E, F, and G with added SWCNTs. Scale bars are 100 nm.
Further insights into the nanotube-peptide interface can be obtained from optical measurements, because nanotube spectral peak positions reflect the local dielectric environment.40,41,43 The broadened near-IR emission features found for SWCNTs coated by peptides E and F suggest a nanotube environment that is nonuniform and imperfect. By contrast, the sharper spectral features observed using peptide G indicate a more uniform coating morphology.
Our findings suggest a general principle useful for developing high-performance SWCNT-based fluorescent labels and sensors. Biopolymers with tendencies to self-assemble into extended supramolecular structures are promising candidates for noncovalently suspending SWCNTs and preserving their optical properties. However, the best results are found using peptides (such as G) that are imperfect assemblers in the absence of an external template such as a SWCNT. To date, peptide-based SWCNT coatings have been designed to provide the highest water solubility of carbon nanotubes. This approach should optimize the peptide’s ability to suspend individual nanotubes in aqueous environments but will not necessarily achieve the goal of maximizing SWCNT fluorescence intensity, or allowing stabilization through chemical cross-linking, or providing a means for covalent attachment of targeting agents.
Within the Km(QL)nKm series, peptide G gave the most intense SWCNT near-IR fluorescence. In an attempt to further raise the emission efficiency, we studied a related structure, K2(QF)5K2 (peptide J), in which the leucine residues (L) were replaced by aromatic-containing phenylalanine residues (F). The importance of aromatic groups in surfactants used to suspend SWCNTs has been discussed previously.44 We used the methods described above to characterize SWCNTs coated with the new peptide J and found a fluorescence efficiency ~40% higher than that with peptide G (see Figure 2b and Figure 4). The measured values are listed in Table 2.
Emission features of individual SWCNTs are typically nearly Lorentzian in profile, as is characteristic of homogeneously broadened spectra.1,3,9 The full-widths at half-maximum (FWHM) for air-suspended nanotubes reportedly range between 100 and 130 cm−1 at room temperature and are dramatically reduced at lower temperatures.3,45 It is likely that electron-phonon interaction plays a key role in the line broadening mechanism. Another contribution apparently arises from environment, as can be inferred from the differences in spectral widths of bulk spectra in peptides E, F, and G (Figure 3a–d). To explore the effect of environment on line width in more detail, we recorded and analyzed emission spectra of a number of individual suspended SWCNTs coated with peptides E, F, G, and J, plus SDBS and Pluronic F127. In each case (see Figure 5) we observed Lorentzian profiles that were slightly broadened by the instrument response function (a Gaussian with FWHM of ~44 cm−1). The underlying Lorentzian spectral widths, δν, of individual nanotubes were then found by deconvolution.
The emission spectra of individual SWCNTs became broader as their environment changed from SDBS to any of the peptides studied here. It has been noted that SWCNT Lorentzian emission line widths reflect a dephasing process that is much faster than population decay of the emitting state.5 We suggest that spatial nonuniformities in SWCNT coatings cause local variations in exciton binding energy that induce dephasing as the exciton moves along the nanotube axis. In this view, the narrowest emission line widths of individual SWCNTs would be associated with the most uniform dielectric environments.
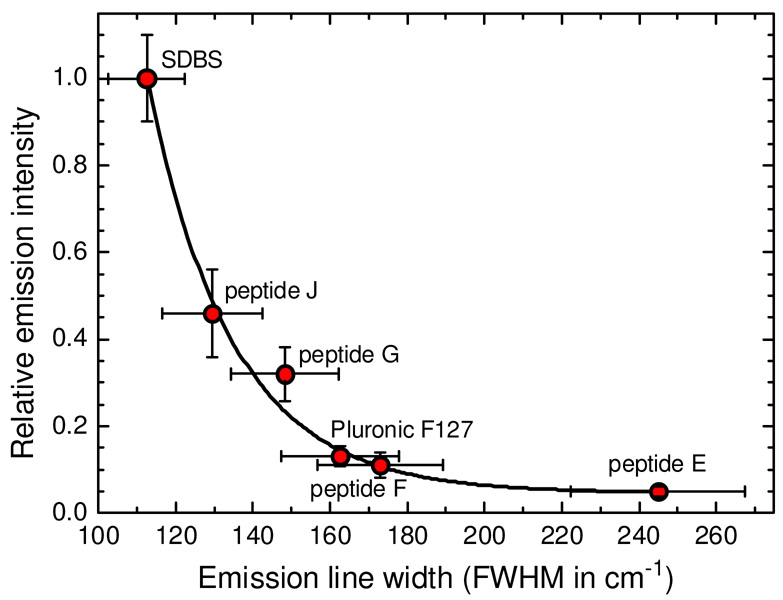
Examination of our single-nanotube measurements of line widths and emission efficiencies reveals a striking correlation. As shown in Figure 8, coatings that give sharper emission peaks also give the highest emission efficiencies. We presume that the variations in emission efficiencies reflect coating-related differences in the rate of nonradiative decay rate of the emitting excitonic state. One possible mechanism is that less uniform coatings lead to accelerated exciton decay as portions of the nanotube surface are exposed to perturbation by the surrounding solution. The data for relative emission efficiency vs. spectral line width can be fit by the decaying exponential function plotted as a solid curve in Figure 8:
| (1) |
When extrapolated to air-suspended SWCNTs, for which the reported (10,2) line width is ~100 cm−1,45 the equation predicts an emission efficiency nearly twice that of nanotubes in aqueous SDBS suspension. The physical basis for this exponential relation remains to be explored through further study. We note that spectral line widths measured in bulk samples contain additional inhomogenous broadening,9,33,34 and so will not obey the relation of eq 1. Nevertheless, properly prepared bulk samples seem to show a coating-dependent spectral width variation parallel to that found for individual nanotubes. Our findings therefore suggest that one can estimate the relative brightness of individual SWNCTs in different coating environments through simple bulk spectroscopy rather than through demanding measurements involving single-nanotube fluorescence microscopy.
Figure 8.
Relative emission intensities measured for individual aqueous SWCNTs in six coatings (taken from the last row of Table 2) as a function of emission line widths. Line width values in this plot were taken from measurements only on (10,2) nanotubes to avoid structure-dependent line width effects. Error bars on both axes represent the range of measured values, not standard deviations. The solid curve is an exponential best fit to the data.
Conclusions
Single-nanotube photometric measurements under controlled conditions have shown that the intensity of near-IR emission from SWCNTs in aqueous suspension depends strongly on the coating material. Emission in common biocompatible surfactants such as Pluronic F127, ss-DNA, and BSA is weak relative to that in SDBS. We have identified a new class of self-assembling peptides that should allow biocompatibility with improved SWCNT emission. The self-assembling properties of these multidomain peptides were found to correlate strongly with their ability to suspend nanotubes and preserve their emission efficiency. The peptides that allowed the brightest SWCNT emission were not those that displayed the strongest tendency to self-assemble, but rather those with similar but slightly modified structures and weaker self-assembly tendencies. We suggest that these peptides use the SWCNT surface as a template for self-assembly to form a stable coating that provides a uniform dielectric environment for the nanotube. Finally, a strong inverse correlation has been found between the spectral line widths of emission from coated SWCNTs and the efficiency of their emission. We believe that these findings will guide further rational design of peptide coatings to enable advanced applications of nanotubes in biology and medicine.
Supplementary Material
Peptide mass spectrometry data, bulk absorption spectra of peptide-suspended SWCNTs, further emission spectra for individual peptide-suspended SWCNTs, emission line width data for individual peptide-suspended SWCNTs, and AFM data for peptide-suspended SWCNTs. This material is available free of charge via the Internet at http://pubs.acs.org.
Acknowledgments
We thank L. Cognet for helpful discussions and experimental assistance, and H. Dong and S. E. Paramonov for assistance with TEM measurements. This research was funded by the Welch Foundation (grant C-0807 to R.B.W., grant C-1557 to J.D.H, and postdoctoral fellowship L-C-0004 to D.A.T.), the NSF Center for Biological and Environmental Nanotechnology (grant EEC-0647452), and Enscyse Biosciences (grant 08022602). E. L. B. has been supported by the National Institutes of Health under NIH Grant 5T32 GM008362. Any opinions, findings and conclusions or recommendations expressed in this material are those of the author(s) and do not necessarily reflect the views of the NIH.
References
- 1.Hartschuh A, Pedrosa HN, Novotny L, Krauss TD. Science. 2003;301:1354–1356. doi: 10.1126/science.1087118. [DOI] [PubMed] [Google Scholar]
- 2.Matsuda K, Kanemitsu Y, Irie K, Saiki T, Someya T, Miyauchi Y, Maryama S. Appl. Phys. Lett. 2005;86:12316-1–12316-3. [Google Scholar]
- 3.Lefebvre J, Fraser JM, Finnie P, Homma Y. Phys. Rev. B. 2004;69:075403-1–075403-5. [Google Scholar]
- 4.Bachilo SM, Strano MS, Kittrell C, Hauge RH, Smalley RE, Weisman RB. Science. 2002;298:2361–2366. doi: 10.1126/science.1078727. [DOI] [PubMed] [Google Scholar]
- 5.Cognet L, Tsyboulski D, Rocha J-DR, Doyle CD, Tour JM, Weisman RB. Science. 2007;316:1465–1468. doi: 10.1126/science.1141316. [DOI] [PubMed] [Google Scholar]
- 6.Cherukuri P, Bachilo SM, Litovsky SH, Weisman RB. J. Am. Chem. Soc. 2004;126:15638–15639. doi: 10.1021/ja0466311. [DOI] [PubMed] [Google Scholar]
- 7.Barone PW, Baik S, Heller DA, Strano MS. Nature Mater. 2005;4:86–92. doi: 10.1038/nmat1276. [DOI] [PubMed] [Google Scholar]
- 8.Lefebvre J, Austing DG, Bond J, Finnie P. Nano Lett. 2006;6:1603–1608. doi: 10.1021/nl060530e. [DOI] [PubMed] [Google Scholar]
- 9.Tsyboulski D, Rocha J-DR, Bachilo SM, Cognet L, Weisman RB. Nano Lett. 2007;7:3080–3085. doi: 10.1021/nl071561s. [DOI] [PubMed] [Google Scholar]
- 10.Carlson LJ, Maccagnano SE, Zheng M, Silcox J, Krauss TD. Nano Lett. 2007;7:3698–3703. doi: 10.1021/nl072014+. [DOI] [PubMed] [Google Scholar]
- 11.Cherukuri P, Gannon CJ, Leeuw TK, Schmidt HK, Smalley RE, Curley SA, Weisman RB. Proc. Natl. Acad. Sci. U. S. A. 2006;103:18882–18886. doi: 10.1073/pnas.0609265103. [DOI] [PMC free article] [PubMed] [Google Scholar]
- 12.Leeuw TK, Reith RM, Simonette RA, Harden M, Cherukuri P, Tsyboulski DA, Beckingham KM, Weisman RB. Nano Lett. 2007;7:2650–2654. doi: 10.1021/nl0710452. [DOI] [PubMed] [Google Scholar]
- 13.Jin H, Heller DA, Strano MS. Nano Lett. 2008;8:1577–1585. doi: 10.1021/nl072969s. [DOI] [PubMed] [Google Scholar]
- 14.Duque JG, Cognet L, Parra-Vasquez ANG, Nicholas N, Schmidt HK, Pasquali M. J. Am. Chem. Soc. 2008;130:2626–2633. doi: 10.1021/ja0777234. [DOI] [PubMed] [Google Scholar]
- 15.O'Connell M, Bachilo SM, Huffman CB, Moore V, Strano MS, Haroz E, Rialon K, Boul PJ, Noon WH, Kittrell C, Ma J, Hauge RH, Weisman RB, Smalley RE. Science. 2002;297:593–596. doi: 10.1126/science.1072631. [DOI] [PubMed] [Google Scholar]
- 16.Wang R, Cherukuri P, Duque JG, Leeuw TK, Lackey MK, Moran CH, Moore VC, Conyers JL, Smalley RE, Schmidt HK, Weisman RB, Engel PS. Carbon. 2007;45:2388–2393. [Google Scholar]
- 17.Welsher K, Liu Z, Daranciang D, Dai H. Nano Lett. 2008;8:586–590. doi: 10.1021/nl072949q. [DOI] [PubMed] [Google Scholar]
- 18.Zheng M, Jagota A, Semke ED, Diner BA, McClean RS, Lustig SR, Richardson RE, Tassi NG. Nat. Mater. 2003;2:338–342. doi: 10.1038/nmat877. [DOI] [PubMed] [Google Scholar]
- 19.Matsuura K, Saito T, Okazaki T, Ohshima S, Yumura M, Iijima S. Chem. Phys. Lett. 2006;429:497–502. [Google Scholar]
- 20.Wang S, Humphreys ES, Chung SY, Delduco DF, Lustig SR, Wang H, Parker KN, Rizzo NW, Subramoney S, Chiang YM, Jagota A. Nat Mater. 2003;2:196–200. doi: 10.1038/nmat833. [DOI] [PubMed] [Google Scholar]
- 21.Zorbas V, Ortiz-Acevedo A, Dalton AB, Yoshida MM, Dieckmann GR, Draper RK, Baughman RH, Jose-Yacaman M, Musselman IH. J. Am. Chem. Soc. 2004;126:7222–7227. doi: 10.1021/ja049202b. [DOI] [PubMed] [Google Scholar]
- 22.Xie H, Ortiz-Acevedo A, Zorbas V, Baughman RH, Draper RK, Musselman IH, Dalton AB, Dieckmann GR. J. Mater. Chem. 2005;15:1734–1741. [Google Scholar]
- 23.Arnold MS, Guler MO, Hersam MC, Stupp SI. Langmuir. 2005;21:4705–4709. doi: 10.1021/la0469452. [DOI] [PubMed] [Google Scholar]
- 24.Pender MJ, Sowards LA, Hartgerink JD, Stone MO, Naik RR. Nano Lett. 2006;6:40–44. doi: 10.1021/nl051899r. [DOI] [PubMed] [Google Scholar]
- 25.Witus LS, Rocha J-DR, Yuwono V, Paramonov SE, Weisman RB, Hartgerink JD. J. Mater. Chem. 2007;17:1909–1915. [Google Scholar]
- 26.Wang S, Humphreys ES, Chung SY, Delduco DF, Lustig SR, Wang H, Parker KN, Rizzo NW, Subramoney S, Chiang YM, Jagota A. Nat Mater. 2003;2:196–200. doi: 10.1038/nmat833. [DOI] [PubMed] [Google Scholar]
- 27.Zorbas V, Ortiz-Acevedo A, Dalton AB, Yoshida MM, Dieckmann GR, Draper RK, Baughman RH, Jose-Yacaman M, Musselman IH. J. Am. Chem. Soc. 2004;126:7222–7227. doi: 10.1021/ja049202b. [DOI] [PubMed] [Google Scholar]
- 28.Dieckmann GR, Dalton AB, Johnson PA, Razal J, Chen J, Giordano GM, Munoz E, Musselman IH, Baughman RH, Draper RK. J. Am. Chem. Soc. 2003;125:1770–1777. doi: 10.1021/ja029084x. [DOI] [PubMed] [Google Scholar]
- 29.Arnold MS, Guler MO, Hersam MC, Stupp SI. Langmuir. 2005;21:4705–4709. doi: 10.1021/la0469452. [DOI] [PubMed] [Google Scholar]
- 30.Pender MJ, Sowards LA, Hartgerink JD, Stone MO, Naik RR. Nano Lett. 2006;6:40–44. doi: 10.1021/nl051899r. [DOI] [PubMed] [Google Scholar]
- 31.Su Z, Mui K, Daub E, Leung T, Honek J. J. Phys. Chem. B. 2007;111:14411–14417. doi: 10.1021/jp0740301. [DOI] [PubMed] [Google Scholar]
- 32.Crochet J, Clemens M, Hertel T. J. Am. Chem. Soc. 2007;129:8058–8059. doi: 10.1021/ja071553d. [DOI] [PubMed] [Google Scholar]
- 33.Tsyboulski DA, Bachilo SM, Weisman RB. Nano Lett. 2005;5:975–979. doi: 10.1021/nl050366f. [DOI] [PubMed] [Google Scholar]
- 34.Weisman RB. Optical Spectroscopy of Single-Walled Carbon Nanotubes, Chapter 5. In: Saito S, Zettl A, editors. Carbon Nanotubes: Quantum Cylinders of Graphene. Amsterdam: Elsevier; 2008. pp. 109–133. [Google Scholar]
- 35.Tsyboulski DA, Bachilo SM, Kolomeisky AB, Weisman RB. ACS Nano. 2008;2:1770–1776. doi: 10.1021/nn800364r. [DOI] [PubMed] [Google Scholar]
- 36.Casey JP, Bachilo SM, Moran CH, Weisman RB. ACS Nano. 2008;2:1738–1746. doi: 10.1021/nn800351n. [DOI] [PubMed] [Google Scholar]
- 37.Dong H, Paramonov SE, Aulisa L, Bakota EL, Hartgerink JD. J. Am. Chem. Soc. 2007;129:12468–12472. doi: 10.1021/ja072536r. [DOI] [PubMed] [Google Scholar]
- 38.Weisman RB, Bachilo SM. Nano Lett. 2003;3:1235–1238. [Google Scholar]
- 39.Moore VC, Strano MS, Haroz EH, Hauge RH, Smalley RE. Nano Lett. 2003;3:1379–1382. [Google Scholar]
- 40.Wang F, Sfeir MY, Huang L, Huang XMH, Wu Y, Kim J, Hone J, O'Brien S, Brus LE, Heinz TF. Phys. Rev. Lett. 2006;96:167401-1–167401-4. doi: 10.1103/PhysRevLett.96.167401. [DOI] [PubMed] [Google Scholar]
- 41.Ohno Y, Iwasaki S, Murakami Y, Kishimoto S, Maruyama S, Mizutani T. Phys. Status Solidi B. 2007;244:4002–4005. [Google Scholar]
- 42.Choi JH, Strano MS. Appl. Phys. Lett. 2007;90 [Google Scholar]
- 43.Choi JH, Strano MS. Appl. Phys. Lett. 2007;90 [Google Scholar]
- 44.Zorbas V, Smith AL, Xie H, Ortiz-Acevedo A, Dalton AB, Dieckmann GR, Draper RK, Baughman RH, Musselman IH. J. Am. Chem. Soc. 2005;127:12323–12328. doi: 10.1021/ja050747v. [DOI] [PubMed] [Google Scholar]
- 45.Inoue T, Matsuda K, Murakami Y, Maruyama S, Kanemitsu Y. Phys. Rev. B. 2006;73:233401-1–233401-4. [Google Scholar]
Associated Data
This section collects any data citations, data availability statements, or supplementary materials included in this article.
Supplementary Materials
Peptide mass spectrometry data, bulk absorption spectra of peptide-suspended SWCNTs, further emission spectra for individual peptide-suspended SWCNTs, emission line width data for individual peptide-suspended SWCNTs, and AFM data for peptide-suspended SWCNTs. This material is available free of charge via the Internet at http://pubs.acs.org.


