Abstract
Optical coherence tomography (OCT) has demonstrated considerable potential for a wide range of medical applications. Initial work was done in the time domain OCT (TD-OCT) approach, but recent interest has been generated with spectral domain OCT (SD-OCT) approaches. While SD-OCT offers higher data acquisition rates and no movable parts, we recently pointed out theoretical inferior aspects to its performance relative to TD-OCT. In this paper we focus on specific limitations of swept source OCT (SS-OCT), as this is the more versatile of the two SD-OCT embodiments. We present experimental evidence of reduced imaging penetration, increased low frequency noise, higher multiple scattering (which can be worsened still via aliasing), increased need to control the distance from the sample, and saturation of central bandwidth frequencies. We conclude that for scenarios where the dynamic range is relatively low (e.g., retina), the distance from the sample is relatively constant, or high acquisition rates are needed, SS-OCT has a role. However, when penetration remains important in the setting of a relatively high dynamic range, acquisition rates above video rate are not needed, or the distance to the tissue is not constant, TD-OCT may be the superior approach.
1. Introduction
Optical coherence tomography (OCT) is now being used to examine a wide range of human pathologies [1,2]. Based on low coherence interferometry, OCT allows micrometer scale imaging at or in excess of video rate [3,4]. The original OCT studies were performed with time domain OCT (TD-OCT), while recently Fourier domain OCT (FD-OCT) and swept source OCT (SS-OCT), referred to collectively as spectral domain OCT (SD-OCT), have attracted a considerable amount of attention [1,5-9]. The theory behind each has been reviewed elsewhere but, in general for TD-OCT, an optical group delay is produced in the reference arm, although some methods work via a variant of this approach [1]. For SD-OCT, which generally has no moving parts, the whole spectral interferogram is recorded from the sample, and depth/amplitude information is obtained via the Fourier transform of the interferogram [1]. Among the major reasons for the recent attraction to SD-OCT are the high data acquisition rates and the claimed superior performance with respect to detection sensitivity. We recently demonstrated that, at least with current embodiments, the theoretical performance in terms of dynamic range and penetration of SD-OCT could be inferior to that of TD-OCT [1,10]. In this work, experimental data further supporting these conclusions is presented using a phantom of consistent composition and high scattering. In addition, the deleterious effects of high multiple scattering, complex conjugate ambiguity, and aliasing are demonstrated for SS-OCT in a moderately scattering sample. We conclude that for scenarios where the sample dynamic range is relatively low (ex: retina), the distance from the sample is relatively constant, or high acquisition rates are needed, SS-OCT may be the superior embodiment. However, when penetration remains important particularly in the setting of a relatively high dynamic range, acquisition rates above video rate are not needed, or the distance to the tissue is not constant, TD-OCT has distinct advantages.
2. Methods
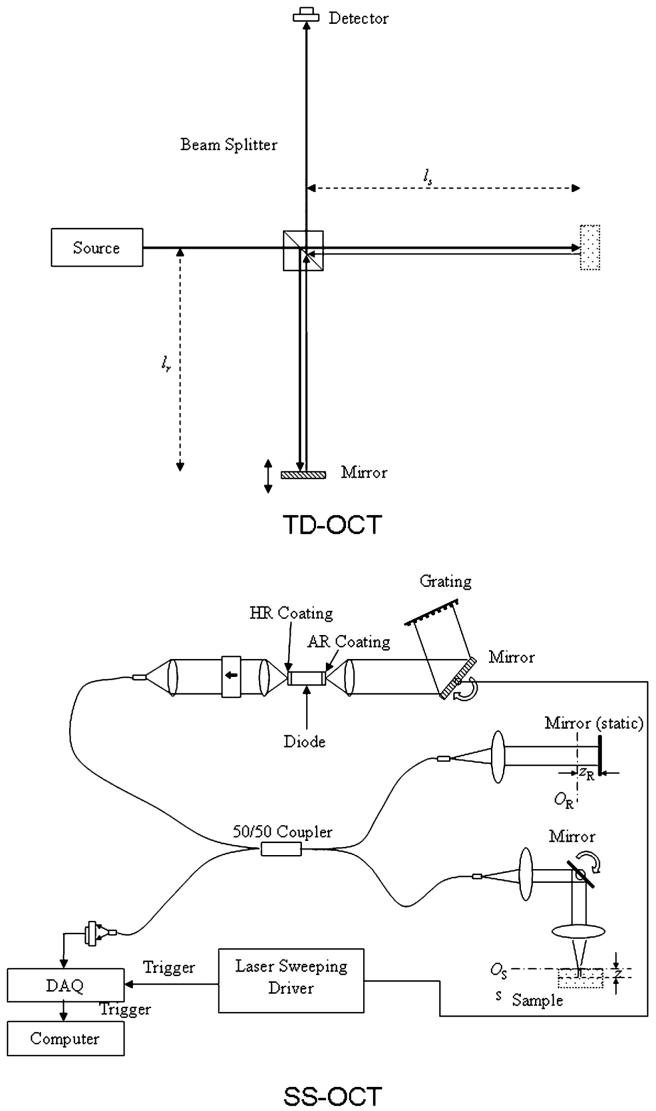
The focus of this paper is to expand upon SS-OCT limitations identified in our previous work, particularly providing supporting experimental evidence for the conclusions [10]. Since direct comparisons are made between SD-OCT and TD-OCT, schematics of both SS-OCT and TD-OCT are shown in Fig. 1. The principles of both are described elsewhere in detail [1,10]. Spectral radar or FD-OCT, whose dynamic range is the least of the three embodiments and whose use is the most limited for reasons discussed previously, is not addressed here [10]. As stated, TD-OCT performs ranging primarily by mechanically introducing an optical group delay in the reference arm. With SS-OCT, the source is frequency swept across its bandwidth, and the total interferogram for each A scan is obtained. Several aspects of SS-OCT imaging are relevant to expand upon. First, with SS-OCT, the power on the sample at any given frequency is higher than TD-OCT because the frequencies are swept. The importance of this is shown in Section 4, particularly with respect to multiple scattering and saturation of the central frequencies via the detector/preamplifier. In the latter case, this results in only the off-center frequencies being detected and Fourier transformed, resulting in a sinusoidal artifact. Second, while the reference arm mirror does not move, the path length in the reference arm is kept shorter than that in the sample arm (z offset, typically 500 μm), which is designed to better isolate the autocorrelation function [1,7]. The fact that fixing the mismatch at a specific distance may not be ideal for imaging is discussed in Section 4. Third, the system is low pass, so low frequency noise is less effectively removed than in TD-OCT, reducing performance [1,10].
Fig. 1.
Schematics of both TD-OCT and SS-OCT are shown. Images courtesy of [1].
We have previously defined our use of terms such as dynamic range, signal to noise ratio (SNR), and penetration to reduce ambiguity, a problem in the literature [10]. Defining these terms is critical, as unconventional definitions have led to significant misinterpretation of many past publications. They are also briefly reviewed here:
Dynamic range: In a system or device, the ratio of a specified maximum level of a parameter, such as power, current, voltage, or frequency, to the minimum detectable value of that parameter, is usually expressed in dB. Here, we are interested in the dynamic range of the final digitized image as it correlates with penetration in nontransparent tissue.
Signal to noise ratio (SNR): This is the ratio of the amplitude of the maximal signal to the amplitude of noise signals at a given point in time. SNR is usually expressed in dB and in terms of peak values for impulse noise and root-mean-square values for random noise. In defining or specifying the SNR, both the signal and noise should be characterized (e.g., peak signal-to-peak noise ratio) to avoid ambiguity. Photo current is the detected parameter in TD-OCT and SS-OCT, whereas photo-generated charge numbers are the detected parameter in FD-OCT. The different parameters do not affect the SNR if the parameters are appropriately defined. Here SNR describe the analog or radio frequency (RF) signal prior to digitization, which can be a point of confusion in the literature. Furthermore, groups have termed the described parameter the dynamic range, which again can be a considerable source of misinterpretation.
Sensitivity: In an electronic device (e.g., a communications system receiver) or detection device (e.g. PIN diode), the minimum input signal required to produce a specified output signal having a specified SNR, or other specified criteria is termed “sensitivity”. With OCT, the SNR is often chosen as 1. So the minimum input signal, usually defined as the minimum sample reflection intensity, equals the amount of signal that can produce the same amount of output as noise. As discussed below, image penetration is the contrast as a function of depth, dependent more on the dynamic range than on sensitivity, as opposed to other technologies. In other words, effective OCT imaging is not measuring the total backscattered photons but the contrast between the point spread function (PSF) at different spatial points.
Decibel: We define decibel as
| (1) |
However, this can be confusing since some authors use a definition found in the electronics literature:
| (2) |
The reasons for this are discussed elsewhere [10]. Therefore, this can result in the second yielding SNR and dynamic range values twice that of the first for the same system.
Resolution: The resolution here is defined as the FWHM of the point spread function measured from a totally reflective surface in a vacuum (air for approximation).
Contrast: There are many definitions of contrast, which are distinct from resolution [1]. It is contrast at depth which defines penetration. One method for calculating the contrast C is using the standard formula
| (3) |
where f is the mean (average) gray-level value of a particular object in an image (foreground) and b is the mean gray-level value of the surrounding region media (background).
Penetration: In describing penetration with OCT, we are not discussing individual photon penetration but the contrast as a function of depth. Essentially, we are looking at the ability to discriminate structure and not assessing backreflected absolute photon counts. This penetration is determined by the dynamic range, multiple scattering, resolution, and, to a lesser degree, total power. For OCT, high sensitivity will allow photon numbers of lower intensity to be detected, but is not equivalent to image contrast as a function of depth, as either low dynamic range or high multiple scattering would yield poor imaging penetration in spite of the increased photon counts.
Both TD-OCT and SS-OCT systems used are commercially available. These commercial systems were chosen because, with the extensive amount of engineering put forward in their development, they appear to have optimized performance to a point at least as good as anything quoted in the literature, particularly the detection electronics [11,12]. System parameters between each modality were matched as closely as possible. The Lightlab imaging engine (Westford, Massachusetts) (TD-OCT) used has a median wavelength of 1287 nm, an axial resolution of 13 μm, total power of 13 mW, and an A-scan rate of 3:13 kHz [11]. The OCM1300SS SS-OCT system (Thorlabs, Newton, New Jersey), was used for SS-OCT imaging [12]. This system had a median wavelength of 1325 nm, an axial resolution of 12 μm, total power of 10 mW, and an A-scan rate of 16 kHz. The spot size at the beam waist for the TD-OCT system is 24 μm, compared with 15 μm for the SS-OCT system, which corresponded to confocal parameters of 0.7 and 0.3 mm, respectively.
3D reconstructions of samples were made during postprocessing using Image J. The saved JPEG stream was converted to gray scale. The parameters set were a projection method of the brightest point, and a rotation angle increment of 3°. The reconstructions were saved as MPEG movies.
Choosing the appropriate sample to assess SS-OCT and TD-OCT reliably is challenging. Tissues with high dynamic range requirements, such as coronary atherosclerotic plaque and gastric mucosa, are very heterogeneous [3,13-15]. This would undoubtedly leave the results subject to criticisms that differences are solely the result of this variability. We therefore elected to use a tissue engineering scaffold with a well-defined biological composition, poly (lactide-co-glycolide) (PLGA) (Boehringer Ingelheim, Ingelheim, Germany) [16,17]. It is also known to be a relatively high scatterer, leading to a large dynamic range for achieving maximum penetration. This polymer consists of biomolecules present in the body but in a well-defined configuration, making it an ideal phantom. While the scattering coefficient has not been published, it is known to have a penetration of 300 μm by confocal microscopy and minimal absorption, supporting the assertion that it is representative of tissue with moderate to high dynamic range [18]. The scaffolding was selected based on experience with a wide range of materials, both biological and nonbiological. The scaffolding has the advantage of having homogeneous composition as well as reproducible structure and a high dynamic range. A total of five scaffolds were examined with a minimum of 200 B scans obtained per sample. The scaffolds were submersed in normal saline. The scaffold bundle widths by OCT were assessed by the average FWHM ± the standard error (SE) at the surface and at 1 mm depth (n = 6 for each of the five samples). The drop in intensity for both technologies at 1 mm was obtained by dividing the peak intensity at that depth by the intensity at the surface (n = 6 for each of the five samples). Data is expressed as percent reduction ± the SE. Statistical significance was assessed using a pairwise Student's t-test.
Focusing issues are also addressed here. While this topic does not involve limitations in dynamic range or penetration, there are difficulties with SD-OCT that do not occur with TD-OCT, adding further challenges to the use of the technology. To demonstrate difficulties with focusing, particularly the generation of inverted images (complex conjugate ambiguity), a bovine meniscus was used as heterogeneity was not problematic in identifying the effect [19,20]. The meniscus was obtained within three hours postmortem and kept in normal saline prior to imaging.
3. Results
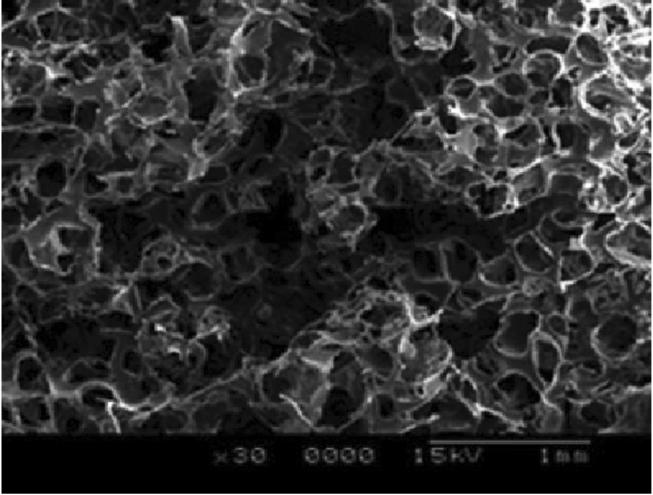
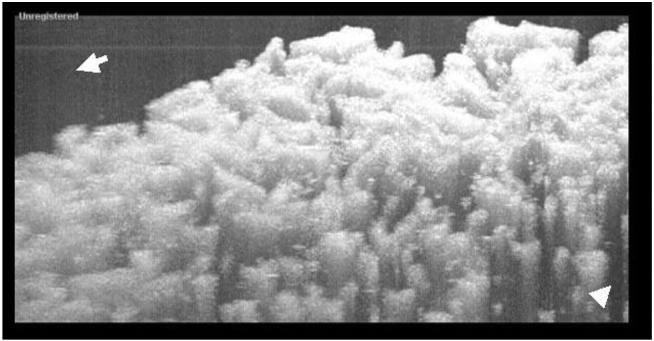
Direct comparisons are made of SS-OCT with TD-OCT on the PLGA scaffolding. 2D images are shown of the scaffolding imaged with both the TD-OCT and SS-OCT systems in Fig. 2. In the TD-OCT images, penetration extends beyond four layers, with the scaffolding bundles being easily resolvable at this depth (over 1:5 mm) while results were substantially worse with SS-OCT. A scanning electron microscopy micrograph of the image is shown in Fig. 3 [21]. The porous structure and layering of the scaffolding is shown, where the pore size ranges from 100 to 250 μm. The intensity dropped 24% ± 2% at 1 mm for TD-OCT versus 46% ± 3% over the same distance for SS-OCT (p < 0:001). With respect to the FWHM of the bundles at the surface, for TD-OCT they were 0:17 mm ± 0:05 mm versus 0:24 mm ± 0:05 mm for SS-OCT (p < 0:05). At 1 mm, the bundle widths were 0:24 mm ± 0:06 mm for TD-OCT versus 0:35 mm ± 0:08 mm for SS-OCT (p < 0:005). In addition to reduced penetration and FWHM, multiple artifacts are noted in the SS-OCT images that affect performance. The mechanisms are theorized below but briefly: the middle arrow in the SS-OCT image shows detector saturation of the central frequencies, the left arrow shows heavy multiple scattering, the lower right and farthest left arrow illustrates aliasing of the multiply scattered light, and the lower right corner arrow points to a loss of structural detail likely from limited dynamic range (resulting from a combination of mechanisms as described below).
Fig. 2.
(Color online) 2D images are shown of the scaffolding imaged with TD-OCT (left) and SS-OCT systems (right).
Fig. 3.
Scanning electron microscopy micrographs of the porous structure of PLGA scaffolding. The pore size ranges from 100 to 250 μm.
The effect seen by the insert and the line shown by the red arrow is well known to those using SD-OCT and occurs primarily at sites of high reflection. The important aspect of this line is shown in the insert of the figure, which is that it is sinusoidal in nature and not constant in intensity. The relevance of this is discussed in Section 4.
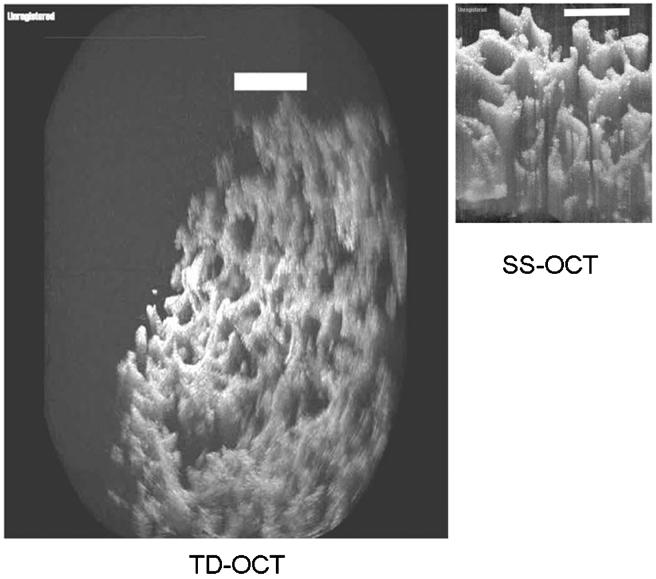
In the 3D images shown in Fig. 4, the scaffolding appears artificially wide or blurred out for SS-OCT and structural definition is lost less than 1 mm into the sample. Qualitatively, structural detail is seen far deeper and is more sharply defined with TD-OCT.
Fig. 4.
Still frames of the 3D projection of PLGA scaffolding using TD-OCT (left) and SS-OCT (right).
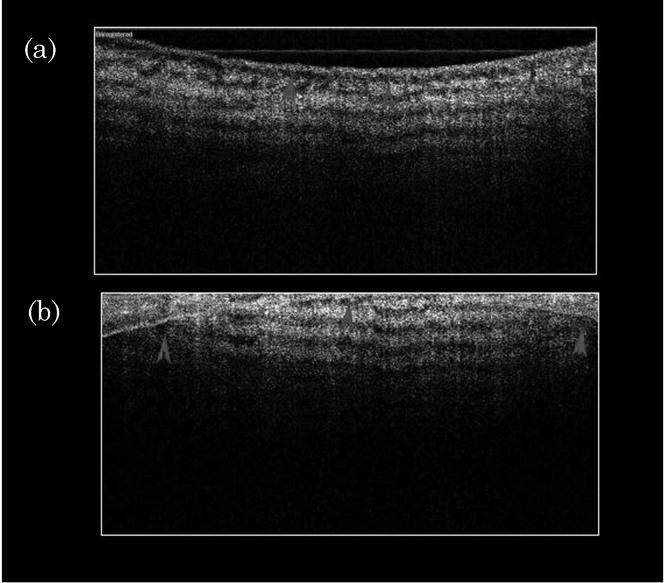
Figure 5(a) shows SS-OCT imaging with the focus on the surface of a bovine meniscus. The bovine meniscus has a smooth surface and discrete banding patterns from birefringence [19,22]. The arrows identify the tissue surface. However, when the focus has been 1 mm below the surface (as shown in Fig. 5(b), the image becomes severely distorted by the inverted image of the surface (complex conjugate ambiguity) [23].
Fig. 5.
(a) SS-OCT imaging with the focus on the surface of a bovine meniscus. The bovine meniscus has a smooth surface and discrete banding pattern from birefringence. The arrows identify the tissue surface. (b) When the focus has been moved 1 mm below the surface, the image becomes completely distorted by the inverted image of the surface (complex conjugate ambiguity).
SS-OCT is a low pass system that does not remove as effectively low frequency noise sources such as 1/f and thermal noise in the detector compared to TD-OCT, as we have previously described [1,10,24]. Figure 6 demonstrates low frequency noise that degrades the image and is noted most obviously in the high background signal. The postprocessing removal of noise results in a further reduction of dynamic range.
Fig. 6.
This figure demonstrates low frequency noise that is not removed in the detection electronics because SS-OCT is a low pass system. Postprocessing to reduce this noise is required, which degrades the image by removing the low frequency components of the autocorrelation function.
4. Discussion
Technological advances with SD-OCT represent one of the most important progresses in OCT research over the last decade, particularly its high data acquisition rate relative to TD-OCT. However, as we have pointed out in a previous publication [10], theoretical analyses as well as evaluation of data in the literature indicate that current embodiments have substantial detection limitations when compared to TD-OCT under the appropriate circumstances. We demonstrated that much of the previous work claiming essentially universally superior detection capabilities compared with TD-OCT are misleading, as either the experimental conditions (e.g., tissue used of relatively low dynamic range) or the inconsistent definitions of parameters result in comparison limitations. In the current work, by using a tissue engineering scaffold (PLGA), chosen because of the homogenous organization of its biological constituents and high scattering (i.e., large dynamic range), we are able to demonstrate in a relatively straightforward manner some of these limitations. The synthetic scaffold was used rather than human tissue to prevent variability and the criticism that differences were due to tissue heterogeneity. The literature quotes the average PLGA fiber size of 12 μm, which is consistent with the 17 ± 5 μm found with TD-OCT [25]. The slightly greater PSF of SS-OCT at the surface is consistent with multiple scattering, even with the superficial bundles seen in the images. The limitations of SS-OCT for the samples examined include a statistically significant reduced penetration, statistically significant reduced resolution with penetration, increased multiple scattering, aliasing of multiply scattered light, central wavelengths saturation, high background noise, and mirroring from negative z offsets (complex conjugate ambiguity).
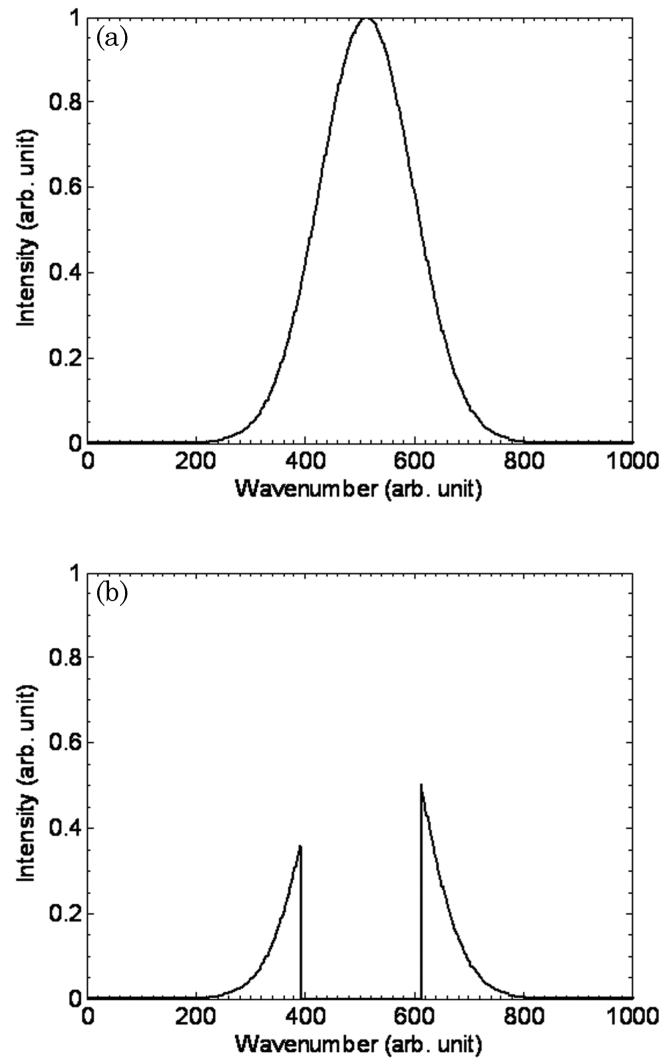
The lines identified by the farthest left arrows in Fig. 2 are well known to those using SS-OCT, particularly when imaging a highly reflective surface. They do not occur with TD-OCT. The localized structure of this line has been demonstrated more clearly in an enlargement in the picture in right bottom corner of Fig. 2. Analysis of the data and an understanding of the underlying theory behind SS-OCT strongly suggest a mechanism. The phenomenon is most likely due to central wavelength saturation or “chopping out” of frequencies in the backreflected light by intensity limitations of the detector/preamplifier. When these lines are examined at high resolution, consistent with theory, it is noted that the lines are not DC in intensity but are actually sinusoidal. When saturation occurs with TD-OCT, blindness results in that, for a given A scan, the detector/preamplifier is exposed to ALL frequencies at once, resulting in complete loss of signal from the reflector and typically the area behind it. TD-OCT then analyzes backreflected data detected time sequentially. If a backreflected signal from a place in the tissue is above the saturation point of the detector, that time point (and subsequent recovery time of the detector) will be lost from the image. In other words, a localized collection of pixels in the vicinity of the saturating surface is “blinded”. In contrast, with SS-OCT, the frequencies are swept across the sample, and then all frequencies are used to reproduce the A scan via the fast Fourier transform (FFT). Therefore, if the central frequencies of the swept radiation are above the threshold of the detector/preamplifier (i.e., the center frequencies are removed), only they will be lost and those at the edges of the spectrum will be processed (i.e., again the source is swept). The FFT is therefore only performed on these frequencies, which are well below and above the central frequencies. This principle is seen in Fig. 7. What results is a quasi-delta function pair, the FFT of which is almost sinusoidal (rather than DC) in nature [26]. This is the same pattern seen in the SS-OCT images. Since the sides are not true delta functions but have a finite width, the FFT is not purely sinusoidal. This phenomenon is a function of intensity (does not occur below saturation) and does not occur with TD-OCT.
Fig. 7.
A demonstration that, if the central frequencies of the swept radiation are above the threshold of the detector (i.e., the center frequencies are removed), the FFT is only performed on the frequencies well below and above the center, as can be seen in the figure. This FFT of the remaining two peaks, if their width is sufficiently small, produces a sinusoidal like pattern.
Because SS-OCT sweeps the bandwidth in small frequency intervals, the amount of power that can be and is delivered at a given frequency is much higher than with TD-OCT. In other words, the interferogram (single A scan) is determined from the FFT of a spectrum with much higher powers for each contributing frequency. This can result not only in central frequency saturation, but also increased multiple scattering [27-29]. Since multiple scattering increases much faster than penetration with power, a well described phenomenon, the multiple scattering deleterious effects outweigh any benefits penetration power has [28,29]. This is represented by the farthest left arrow in Fig. 2, where the classic tailing effect (shower curtain effect) [30] after the scatterer is seen due to multiple scattering by the dense scaffold. This results in reductions of both resolution and penetration.
The z offset between the reference and sample arm (target surface) is typically set around 500 μm, with the reference arm having the shorter length. When the z offset between the target and reference arm increases, such as with deep structures in the sample, higher frequencies are present in the backreflected signal, and their capture is required for correct reconstruction of the A scan. Therefore, resolving deeper structures can be ultimately limited by the frequency sensitivity of the detector/preamplifier. If the detection of higher frequencies fails, aliasing and distortion of the PSF will occur. This is a phenomenon that does not occur with TD-OCT. In addition to distorting normal structure, the aliasing or distortion of the multiple scattering can also occur (right arrow in Fig. 2), based on the same principles, which further degrades the image [29].
As has been pointed out in the original theoretical analysis, two of the reasons that SD-OCT has a reduced dynamic range are that it is a low pass system and it does not undergo logarithmic demodulation before A-D conversion. The fact that SD-OCT is low pass results in low frequency noise, such as thermal and 1/f noise, being mixed with the autocorrelation function. This is seen in the background of Fig. 6. The low frequency noise is generally removed with digital postprocessing, but this results in a further reduction in the dynamic range of the image as low frequency components of the autocorrelation function are also removed. With TD-OCT, the interferogram is Doppler shifted to higher frequencies by mechanical movement in the reference arm, allowing a bandpass filter to be introduced after the detector to reduce low frequency noise.
The other major reason for reduced dynamic range is the lack of logarithmic demodulation before A-D [1,10]. The A-D conversion and its respective signal loss are different for TD-OCT and SD-OCT. The maximum level of the quantizer is 2MΔ, where M is the bits of an A-D converter and Δ is the intervals of discrete levels. In TD-OCT, digital processing is applied to the analog autocorrelation A scan, which allows log 10 demodulation to maintain a high dynamic range. In a SD-OCT system, digital Fourier transform is conducted to calculate the A-scan signal from the quantized spectral interferogram. Prior to A-D conversion, in TD-OCT, the RF signal undergoes logarithmic demodulation. This leads to a theoretical maximal dynamic range near 80 dB. In contrast, with SD-OCT, the RF signal does not undergo logarithmic demodulation in current embodiments prior to A-D conversion, resulting in a maximum potential (excluding other sources of loss) dynamic range of less than 40 dB. For tissue with a low dynamic range, such as retina, this does not represent a major problem. However, if the backreflected signal intensity is greater than 30 dB between the surface and structures deeper within the sample, penetration can be limited by this lower dynamic range.
In Fig. 2, the ability to resolve structures greater than 500 μm below the surface is severely compromised in SS-OCT compared with TD-OCT. This is consistent with statistically significant reductions in the point spread function as well as intensity with SS-OCT relative to TD-OCT. The scaffolding was chosen because of its homogeneity and high scattering (i.e., dynamic range) [18]. Therefore, the difference in performance between the two embodiments on this medium, which was statistically significant at 1 mm penetration, can be assumed to occur for a combination of several reasons as discussed above and are consistent with the hypothesis of this paper. These include reduced dynamic range, low pass nature of the system, substantial multiple scattering, and potentially the large z offset resulting in aliasing (including aliasing of multiply scattered light).
Figure 5 demonstrates mirroring or complex conjugate ambiguity, which does not deal directly with either dynamic range or penetration, but represents a significant disadvantage of SD-OCT compared with TD-OCT. This occurs because, as a Fourier transform on any real-valued function (in the direct space) is Hermitian symmetrical around the origin (in the transform space), it generates a complex conjugate part that mirrors with the targeted A scan around the zero-optical-path-mismatching point. This could lead to the overlapping of the targeted A scan and its inverted/ghost image if the sample is too close to the zero-optical-path-mismatching point, or even if it intersects that point. In 5(a), an image of bovine meniscus is presented where the tissue surface represents a 500 μm z offset from the reference arm. The surface as well as the banding pattern from cartilage birefringence is sharply defined. However, the complex conjugate ambiguity is noted when the focus is too far into the tissue (reversed z offset) as a mirror image of the surface will develop. This is seen in Fig. 5(b) and results because of the need for a shorter length in the reference arm compared with the sample arm because the surface is brought too close. The fact that the point of focus cannot be too close, resulting in image inversion, or too far, resulting in aliasing and loss of resolution, makes it difficult to evaluate how it will be easily implemented in situations where the tissue is moving, image depth is sufficiently large, or for radial images where a large luminal diameter exists. Three major approaches attempting to rectify this problem, aiming on construction of complex spectral interferograms, have been put forward to reduce these issues, all of which are for FD-OCT, though potentially applicable to SS-OCT. However, they all involve manipulation of the reference arm, either through mechanical movement or modulation such as electro-optically [23,31,32]. However, they have only been of limited success and the addition of reference arm manipulation makes the techniques far from attractive and, at the very least, reduces acquisition rate.
A significant limitation of this study was that, while very close with respect to optical parameters, the systems were not identical. In particular, there was a difference in the confocal parameters between the two embodiments. This means that the spot size will increase in diameter more rapidly away from the beam waist for SS-OCT in this experiment compared with the TD-OCT setup. While this does not significantly affect axial resolution, central bandwidth saturation, low frequency noise, dynamic range, large z-offset frequency loss, or complex conjugate ambiguity, it can lead to a degradation of lateral resolution and potentially some increase in multiple scattering. Although this is not likely to represent a major problem in data interpretation due to the fact the difference is not substantially large and performance limitations described are occurring at the beam waist (in addition to off focus), this potential limitation of the study needs to be mentioned.
5. Conclusion
SS-OCT in its current embodiments, while having a faster data acquisition rate, has reduced performance relative to TD-OCT under the appropriate circumstances. These limitations include a reduced dynamic range, increased multiple scattering, aliasing of multiple scattering, loss of resolution with depth due to a large z offset (high frequency loss), central wavelengths saturation, low frequency noise vulnerability, and complex conjugate ambiguity. Therefore, when penetration remains important in the setting of a relatively high dynamic range, acquisition rates above video rate are not needed, or the distance to the tissue is not constant, TD-OCT has distinct advantages. However, where the sample dynamic range is relatively low (e.g., retina), the distance from the sample is relatively constant, or high acquisition rates are needed, SS-OCT may represent the superior embodiment.
Acknowledgments
M. E. Brezinski's work is currently funded by National Institute of Health (NIH) Grants R01 AR44812, R01 HL55686, R01 EB02638/HL63953, R01 AR46996, and R01 EB000419. The authors also thank Alicia N. Goodwin, Namita P. Kumar, and Julie A. Williams for their technical support. The authors have no financial conflicts with regard to the data published in this paper.
References
- 1.Brezinski ME. Optical Coherence Tomography, Principle and Practice. Academic; 2006. [Google Scholar]
- 2.Brezinski ME, Fujimoto JG. Optical coherence tomography: high-resolution imaging in nontransparent tissue. IEEE J. Sel. Top. Quantum Electron. 1999;5:1185–1192. [Google Scholar]
- 3.Brezinski ME, Tearney GJ, Bouma BE, Izatt JA, Hee MR, Swanson EA, Southern JF, Fujimoto JG. Optical coherence tomography for optical biopsy—properties and demonstration of vascular pathology. Circulation. 1996;93:1206–1213. doi: 10.1161/01.cir.93.6.1206. [DOI] [PubMed] [Google Scholar]
- 4.Tearney GJ, Brezinski ME, Bouma BE, Boppart SA, Pitris C, Southern JF, Fujimoto JG. In vivo endoscopic optical biopsy with optical coherence tomography. Science. 1997;276:2037–2039. doi: 10.1126/science.276.5321.2037. [DOI] [PubMed] [Google Scholar]
- 5.Fercher AF, Hitzenberger CK, Kamp G, Elzaiat SY. Measurement Of intraocular distances by backscattering spectral interferometry. Opt. Commun. 1995;117:43–48. [Google Scholar]
- 6.Wax A, Yang CH, Izatt JA. Fourier-domain low-coherence interferometry for light-scattering spectroscopy. Opt. Lett. 2003;28:1230–1232. doi: 10.1364/ol.28.001230. [DOI] [PubMed] [Google Scholar]
- 7.Yun SH, Tearney GJ, Bouma BE, Park BH, de Boer JF. High-speed spectral-domain optical coherence tomography at 1:3 μm wavelength. Opt. Express. 2003;11:3598–3604. doi: 10.1364/oe.11.003598. [DOI] [PMC free article] [PubMed] [Google Scholar]
- 8.Chinn SR, Swanson EA, Fujimoto JG. Optical coherence tomography using a frequency-tunable optical source. Opt. Lett. 1997;22:340–342. doi: 10.1364/ol.22.000340. [DOI] [PubMed] [Google Scholar]
- 9.Choma MA, Sarunic MV, Yang CH, Izatt JA. Sensitivity advantage of swept source and Fourier domain optical coherence tomography. Opt. Express. 2003;11:2183–2189. doi: 10.1364/oe.11.002183. [DOI] [PubMed] [Google Scholar]
- 10.Liu B, Brezinski ME. Theoretical and practical considerations on detection performance of time domain, Fourier domain, and swept source optical coherence tomography. J. Biomedical Optics. 2007;12:044007. doi: 10.1117/1.2753410. [DOI] [PubMed] [Google Scholar]
- 11. http://www.lightlabimaging.com/
- 12. http://www.thorlabs.com/
- 13.Yabushita H, Bouma BE, Houser SL, Aretz HT, Jang I-K, Schlendorf KH, Kauffman CR, Shishkov M, Kang D-H, Halpern EF, Tearney GJ. Characterization of human atherosclerosis by optical coherence tomography. Circulation. 2002;106(13):1640–1645. doi: 10.1161/01.cir.0000029927.92825.f6. [DOI] [PubMed] [Google Scholar]
- 14.Pitris C, Jesser C, Boppart SA, Stamper D, Brezinski ME, Fujimoto JG. Feasibility of optical coherence tomography for high resolution imaging of human gastrointestinal tract malignancies. J. Gastroenterol. 2000;35:87–92. doi: 10.1007/s005350050019. [DOI] [PubMed] [Google Scholar]
- 15.Zuccaro G, Gladkova N, Vargo J, Feldchtein F, Zagaynova E, Conwell D, Falk G, Goldblum J, Dumot J, Pnsky J, Gelikonov G, Davros B, Donchenko E, Richter J. Optical coherence tomography of the esophagus and proximal stomach in health and disease. Am. J. Gastroenetrol. 2001;96:2633–2639. doi: 10.1111/j.1572-0241.2001.04119.x. [DOI] [PubMed] [Google Scholar]
- 16.Karageorgiou V, Kaplan D. Porosity of 3D biomaterial scaffolds and osteogenesis. Biomaterials. 2005;26:5474–5491. doi: 10.1016/j.biomaterials.2005.02.002. [DOI] [PubMed] [Google Scholar]
- 17.Frenkel SR, Di Cesare PE. Scaffolds for articular cartilage repair. Ann. Biomed. Eng. 2004;32:26–34. doi: 10.1023/b:abme.0000007788.41804.0d. [DOI] [PubMed] [Google Scholar]
- 18.Ishaug Riley SL, Crane-Kruger GM, Yaszemski MJ, Mikos AG. Three-dimensional culture of rat calvarial osteo-blasts in porous biodegradable polymers. Biomaterials. 1998;19:1405. doi: 10.1016/s0142-9612(98)00021-0. [DOI] [PubMed] [Google Scholar]
- 19.Liu B, Harman M, Giattina S, Stamper DL, Demakis C, Chilek M, Raby S, Brezinski ME. Characterizing of tissue microstructure with single-detector polarization-sensitive optical coherence tomography. Appl. Opt. 2006;45:4464–4479. doi: 10.1364/ao.45.004464. [DOI] [PubMed] [Google Scholar]
- 20.Wojtkowski M, Kowalczyk A, Leitgeb R, Fercher AF. Full range complex spectral optical coherence tomography technique in eye imaging. Opt. Lett. 2002;27:1415–1417. doi: 10.1364/ol.27.001415. [DOI] [PubMed] [Google Scholar]
- 21.Ren T, Ren J, Pan K. The bone formation in vitro and mandibular defect repair using PLGA porous scaffolds. J Biomed Mater Res A. 2005;74:562–569. doi: 10.1002/jbm.a.30324. [DOI] [PubMed] [Google Scholar]
- 22.Drexler W, Stamper D, Jesser C, Li X, Pitris C, Saunders K, Martin S, Lodge MB, Fujimoto JG, Brezinski ME. Correlation of collagen organization with polarization sensitive imaging in cartilage: implications for osteoarthritis. J. Rheumatol. 2001;28:1311–1318. [PubMed] [Google Scholar]
- 23.Wang RKK. In vivo full range complex Fourier domain optical coherence tomography. Appl. Phys. Lett. 2007;90:054103. [Google Scholar]
- 24.Horowitz P, Hill W. The Art of Electronics. 2nd ed. Cambridge University: 1997. pp. 614–617. [Google Scholar]
- 25.Kin H, Kim HW. Sustained release of ascorbate-2-phosphate and dexamethasone from porous PLGA scaffolds for bone tissue engineering using mesenchymal stem cells. Biomaterials. 2003;24:4671–4679. doi: 10.1016/s0142-9612(03)00358-2. [DOI] [PubMed] [Google Scholar]
- 26.Goodman JW. Introduction to Fourier Optics. 2nd ed. McGraw Hill: 1996. [Google Scholar]
- 27.Smithies DJ, Lindmo T, Zhongping C, Nelson JS, Milner TE. Signal attenuation and localization in optical coherence tomography studied by Monte Carlo simulation. Phys. Med. Biol. 1998;43:3025–2044. doi: 10.1088/0031-9155/43/10/024. [DOI] [PubMed] [Google Scholar]
- 28.Yao G, Wang LV. Monte Carlo simulation of an optical coherence tomography signal in homogeneous turbid media. Phys. Med. Biol. 1999;44:2307–2320. doi: 10.1088/0031-9155/44/9/316. [DOI] [PubMed] [Google Scholar]
- 29.Leitgeb RA, Drexler W, Unterhuber A, Hermann B, Bajraszewski T, Le T, Stingl A, Fercher AF. Ultrahigh resolution Fourier domain optical coherence tomography. Opt. Express. 2004;12:2156–2165. doi: 10.1364/opex.12.002156. [DOI] [PubMed] [Google Scholar]
- 30.Thrane L, Yura HT, Andersen PE. Analysis of optical coherence tomography systems based on the extended Huygens-Fresnel principle. J. Opt. Soc. Am. A. 2000;17:484–490. doi: 10.1364/josaa.17.000484. [DOI] [PubMed] [Google Scholar]
- 31.Zhang J, Nelson JS, Chen ZP. Removal of a mirror image and enhancement of the signal-to-noise ratio in Fourier-domain optical coherence tomography using an electro-optic phase modulator. Opt. Lett. 2005;30:147–149. doi: 10.1364/ol.30.000147. [DOI] [PubMed] [Google Scholar]
- 32.Davis AM, Choma MA, Izatt JA. Heterodyne swept-source optical coherence tomography for complete complex conjugate ambiguity removal. J Biomed. Opt. 2005;10:064005. doi: 10.1117/1.2136147. [DOI] [PubMed] [Google Scholar]


