

Abstract
Cell surface proteins can play important roles in cancer pathogenesis. Comprehensive understanding of the surface protein expression patterns of tumor cells and, consequently, the pathogenesis of tumor cells, depends on molecular probes against these proteins. To be effectively used for tumor diagnosis, classification and therapy, such probes would be capable of specific binding to targeted tumor cells. Molecular aptamers, designer DNA/RNA probes, can address this challenge by recognizing proteins, peptides and other small molecules with high affinity and specificity. Through a process known as cell-SELEX, we used live acute myeloid leukemia (AML) cells to select a group of DNA aptamers that can recognize acute myeloid leukemia cells with dissociation constants (Kds) in the nanomolar range. Interestingly, one aptamer (KH1C12), compared with two control cell lines (K562 and NB4), showed significant selectivity to the target AML cell line (HL60) and could recognize the target cells within a complex mixture of normal bone marrow aspirates. The other two aptamers KK1B10 and KK1D04 recognize targets associated with monocytic differentiation. Our studies demonstrate that the selected aptamers can be used as a molecular tool for further understanding surface protein expression patterns on tumor cells and thus providing a foundation for effective molecular analysis of leukemia and its subcategories.
Introduction
Acute leukemia has been traditionally classified according to the FAB (French-American-British) system that is based on morphology and cytochemistry studies. In 2001, the World Health Organization (WHO) classification system of acute leukemia was introduced. Currently, therefore, a new basis for diagnosing both adult and pediatric acute leukemia has been established. This is based on a combination of cytological examination, immunophenotypic analysis by flow cytometry, and cytogenetic karyotyping, or molecular analysis of genetic mutations known to carry good or poor risk for patients.1 Because of the relatively simple technical requirements and short turnaround time, immunophenotyping and monitoring residual diseases in clinical practice by flow cytometry has been the method of choice. However, the available monoclonal antibodies are only used to classify tumors by tissue origin or lineage, not to identify the molecular events underlying the neoplastic process or the information required to aggressively pursue prognosis and clinical management.2 This picture changes significantly when we consider cell surface proteins which can play important roles in cell proliferation and differentiation in response to extracellular stimulatory and inhibitory signals.2 Specifically, the differences in surface protein expression among various types of tumor cells can potentially be used to diagnose and detect tumor cells and predict their behavior. Such differentiation in protein expression also gives the clues required, to predict effective therapeutic regimens, perform targeted therapy as well as determine long term outcomes.1 However, in order to define the molecular basis of a disease process, we must be able to generate the molecular signature of an individual disease. Therefore, by developing probes that can recognize surface proteins, it will open opportunities that can ultimately aid in profiling the surface protein changes that are related to neoplasia or diseases, and classify tumors according to their molecular characteristics instead of tissue origin or cell lineages.
In our earlier studies,3, 4 we used a cell-based aptamer selection strategy known as cell-based SELEX to develop aptamers that distinguish target cells (CCRF-CEM, human precursor T-cell acute lymphoblastic leukemia, T-ALL) from the control B-cell tumor (Ramos, human Burkitt's lymphoma) and vice versa. Having been derived from normal B- and T-lymphocytes, the tumor cells of B- or T-cell lineage have distinctive surface proteins, which is the reason we chose them to implement our aptamer selection strategy. We found that a panel of selected aptamer probes could recognize CEM T-ALL or Ramos cells mixed with normal human bone marrow cells and also real clinical specimen, demonstrating the potential clinical application of leukemia cell detection and characterization. However, we still needed to validate the potential of this strategy in identifying specific molecular markers in closely related tumor cells. Consequently, in this paper, we report the applicability of this procedure in two closely related acute leukemia cell lines, HL60 and NB4.
HL60 and NB4 cells are morphologically similar and can undergo in vitro granulocytic differentiation when treated with retinoic acid,5 a characteristic feature of APL. NB4, a model APL cell line, has the t(15;17) translocation involving the retinoic acid receptor alpha (RAR) gene. The resultant fusion proteins created by the specific translocation disrupt the function of RAR, which blocks the normal maturation of granulocytes, thus leading to the accumulation of abnormal promyelocytes. Treatment with ATRA, a derivative of vitamin A, causes differentiation of the immature leukemic promyelocytes into mature granulocytes.6 HL60 cells can also be induced to differentiate by ATRA, even though HL60 cells lack this chromosomal translocation. The underlying mechanism for such induced HL60 cell differentiation remains unclear. Both NB4 and HL60 cell line can be induced to differentiate towards monocytic and granulocytic pathways depending on the chemical inducer.1 By using the model system, we examine whether it is possible to select aptamers capable of detecting the difference in the surface protein expression between these closely related cell lines.
Materials and methods
Cell lines and cell culture
HL60, NB4 [t (15;17) (q22;q12)], K562 [t (9;21)(q34;q11)], CEM, Ramos, Jurkat cell lines, Kasumi-1[t(8;21)(q22;q22)], Monomac-6 [t(9;11)(p22;q23)], HEL and MV4-11 [t(4;11)(q21;q23)] were used for the studies. All cells were maintained in culture with RPMI-1640 (American Type Cell Culture) culture media, supplemented with 20% heat-inactivated FBS (Kasumi-1 and MV4-11) and the rest with 10% FBS and 100Units/mL penicillin-streptomycin (Cellgro). They were incubated at 37°C under a 5% CO2 atmosphere. The leftover human bone marrow samples were obtained from the Hematopathology Laboratory, Department of Pathology, University of Florida/Shands Hospital.
DNA primers and library
The DNA library used for cell-based aptamer selection consisted of a pool of oligonucleotides made up of a continuous stretch of 45 randomized nucleotides flanked on both ends by PCR primer sequences. The 5′ end is labeled by fluorescein isothiocyanate (FITC) (5′ FITC- ATC CAG AGT GAC GCA GCA N45 TGG ACA CGG TGG CTT AGT 3′). The forward primer was labeled at the 5′ end with FITC (5′ FITC- ATC CAG AGT GAC GCA GCA 3′) and the reverse primer with biotin at the 5′ end (5′ Biotin- ACT AAG CCA CCG TGT CCA 3′). All sequences were synthesized by standard phosphoramidite chemistry using a 3400 DNA synthesizer (Applied Biosystems) and purified by reverse phase HPLC (Varian Prostar). During selection, eluted sequences were amplified by PCR, and the FITC-labeled sequences were separated from the biotinylated complementary strand by denaturation (200mM NaOH) and streptavidin-biotin interactions. All PCR mixtures contained 50 mM KCl, 10 mM TrisHCl (pH 8.3), 1.5 mM MgCl2, dNTPs (each at 2.5 mM), 0.5μM each primer, and Hot start Taq DNA polymerase (5units/μl). Amplifications were carried out in a Biorad 1 Cycler at 95°C for 30 sec, 56.3°C for 30 sec, and 72°C for 30 sec, followed by the final extension for 3 min at 72°C. The FITC-labeled sequences were used to continue and monitor progress of selection by flow cytometry.
Cell-based selection
In this study, HL60 was used as target (positive cell line) and NB4 for counter selection (negative cell line). Twenty nmol of DNA library was dissolved in 500 μl of binding buffer (4.5 g/liter glucose, 5 mM MgCl2, 0.1 mg/ml tRNA and 1mg/ml BSA, all dissolved in Dulbecco's PBS with magnesium chloride and calcium chloride). The DNA pool was denatured at 95°C for 5 min and quickly cooled on ice for 10 min. The detailed SELEX procedure is outlined in previous studies.3 Briefly, 5 × 10⁶ HL60 cells were washed twice with washing buffer (4.5 g/liter glucose, 5 mM MgCl2, dissolved in Dulbecco's PBS with 0.1g/L magnesium chloride and 0.133g/L calcium chloride) and centrifuged at 940 rpm for 5min at 4°C. The cells were incubated with the DNA pool in binding buffer, on ice in an orbital shaker for 45 min. After incubation, the cells were washed three times to remove unbound DNA sequences. The bound DNA sequences were eluted with 500 μl binding buffer by heating at 95°C for 10 min and centrifugation. The supernatant containing the DNA sequences was incubated with 2 × 10⁷ NB4 cells to perform a subtraction. The unbound sequences were amplified by PCR using FITC- and biotin-labeled primers. The selected sense ssDNA strands were separated from the biotinylated antisense ssDNA by alkaline denaturation and affinity purification with streptavidin-coated Sepharose beads (GE Healthcare). The entire selection process was repeated according to the extent of enrichment. To acquire aptamers with high affinity and specificity, the washing strength was enhanced gradually by extending wash time (2-5 min), as well as increasing the volume of washing buffer (3-5 mL) and the number of washes (3-5 times). Additionally, an increased amount of FBS (10% - 20%) was added to the incubation mixture, while the number of cells was reduced from 5 million to 1 million. The enrichment of specific sequences was monitored using flow cytometry. By 16 rounds of selection, there was significant enrichment of DNA sequences to enable selective recognition of the target cells rather than the negative cell line. The enriched pool was amplified by PCR using unlabeled primers and the PCR products cloned into Escherichia coli using TOPO TA cloning Kit for sequencing (Invitrogen). The positive clones were sequenced by a high throughput sequencing facility at the University of Florida.
Flow cytometry assays
Using flow cytometry to monitor aptamer binding to cultured cells
The enrichment of aptamer candidates during selection was determined by flow cytometry. The FITC-labeled ssDNA at a final concentration of 250nM was incubated with 1 × 10⁶ target, or negative control cells, in 200μl binding buffer containing 20% FBS and placed on ice for 30 min. The cells were washed twice with binding buffer, and the pellets with the bound sequences were resuspended in 350μl binding buffer. The fluorescence intensity was determined with a FACScan cytometer (BD Immunocytometry Systems) by counting 30,000 events. The FITC-labeled unselected ssDNA library was used as a negative control. To determine the cell specificity of the selected aptamers, cell lines including K562, Monomac-6, HEL, Kasumi-1, MV4-11, Jurkat, Ramos and CEM were used in binding assays by flow cytometry
Determination of aptamer affinity
The screening of potential aptamers and the binding affinity of the successful aptamer candidates were performed using flow cytometry. To determine the binding affinity of the aptamers, target cells (1 × 10⁶) were incubated with varying concentrations of FITC-labeled aptamer in a 200 μl volume of binding buffer containing 20% FBS. Cells were washed twice with binding buffer, resuspended in 350 μl buffer and analyzed by flow cytometer. The FITC-labeled unselected library was used as a negative control to determine nonspecific binding. All binding assays were in triplicate. The mean fluorescence intensity of the unselected library was subtracted from that of the aptamer with the target cells to determine the specific binding of the labeled aptamer. The equilibrium dissociation constant (Kd) of the aptamer-cell interaction was obtained by fitting the dependence of intensity of specific binding on the concentration of the aptamers to the equation Y = B max X/(kd + X), using Sigma Plot (Jandel, San Rafael, CA).
Competition assays
Cell-based selection may identify multiple aptamers for multiple targets as well as multiple aptamers for a single target. We therefore tested the selected aptamers for competition against each other. We tested aptamers selected at the same time, as well as those known to bind to leukemia cell lines.3 In competition assays, unlabeled competitive aptamer was incubated with HL60 cells in 10-fold excess concentration (2.5μM), and then the labeled aptamer was added at a final concentration of 250nM. The cells were washed, and their fluorescence intensity was determined by flow cytometry.
Effect of temperature on the binding of KH1C12
Since the selection of the aptamers was done on ice, all of the binding assays reported here were performed at a temperature of 4°C. We have observed that some of the aptamers selected at lower temperatures may not bind well at elevated temperatures, such as 37°C, and that this may affect further studies using such aptamers under physiological conditions. We therefore performed binding assays at 37°C to verify the stability of aptamer binding to its target. Three separate assays were performed. In set one, the aptamer was heated to 95°C and cooled on ice immediately, while in sets two and three, it was cooled to room temperature and 37°C, respectively. Aptamers were incubated with the target at 37°C, and fluorescence intensity was determined by flow cytometry. Aptamers denatured at 95°C, cooled immediately at 4°C and incubated on ice were used as positive control.
Test selected aptamers with cells in normal human bone marrow cells and acute leukemia cells
We tested the recognition pattern of the selected aptamers with the different types of cells in normal bone marrow aspirates. FITC-labeled aptamer, together with peridinin -chlorophyll- protein-labeled anti-CD45 antibody (PerCP-CD45, BD Biosciences), were incubated with normal bone marrow aspirates. FITC-labeled unselected DNA library was used as a control. We next tested the feasibility of using an aptamer to identify its target when it is mixed with normal human bone marrow aspirates. Again, FITC-labeled aptamer was mixed with PerCP-antiCD45 and incubated with a mixture of normal bone marrow aspirates and HL60 or NB4 cells. These mixtures were assayed by flow cytometry. We also determined the interaction of the selected aptamers with real clinical patient samples. Different leukemia samples were tested, including AML, APL, T-cell and B-cell ALL. FITC-labeled aptamers were mixed with PerCP-antiCD45 and/or R-phycoerythrin-labeled anti-CD117 antibody, (PE-anti-CD117, BD Biosciences).
Chemically Induced differentiation Assays
Differentiation agents, all-trans-retinoic acid (ATRA) and butyric acid sodium salt were obtained from Sigma. ATRA was dissolved in ethanol and sodium butyrate in water at stock concentrations of 10mM and 0.5M, respectively. These were aliquoted and stored. Before induction of differentiation, HL60 and NB4 cells were quantified and assessed for viability by tryphan blue dye exclusion test on hemacytometer. Cells (viability over 95%) were seeded in RPMI-1640 at 100 000 cells/mL in total volume of 5mL per each sample in Petri dishes. Differentiation was induced at final concentrations of 1μM ATRA (granulocytic pathway) and 0.5mM sodium butyrate (monocytic pathway). The cells were incubated at 37°C in a humidified atmosphere of 5% CO2. Control experiments were done with equal volumes of ethanol for ATRA experiments and water for sodium butyrate. All experiments were done in triplicate. The extent of differentiation was assessed between 1-5 days by nitroblue tetrazolium (NBT) reduction assay and the functional recognition of the aptamers probes also assessed by flow cytometry.
NBT reduction Test
NBT reduction was performed using standard methodology, and the percentage of cells that contained intracellular black formazan deposits was determined. Briefly, treated and untreated cells at specific time points of inducer exposure were washed with PBS and about 100 000 cells in 50μl volume incubated with NBT solution at 37°C for 30min. Cytospin slide preparations were made and the smear allowed to dry. Cells were stained with Accustain Wright stain. Differential counts were performed under light microscope (Leica DM6000B) on a minimum count of 200 cells. The percentage of cells containing intracellular formazan deposits was determined.
Binding studies of aptamers with differentiated cells by flow cytometry
The effect of differentiation of HL60 and NB4 cells on the binding pattern of KH1C12, KK1B10 and KK1D04 was determined. At the same time points of differentiation used for the NBT reduction test, portions of the cells were incubated with the aptamers at a final concentration of 250nM for 30min on ice. The cells were washed and assayed by flow cytometry. Unselected DNA library was used as a background fluorescence signal. The fluorescence intensity of the individual aptamers was compared with the control cells without differentiation.
Verification of aptamers binding to monocytic differentiated cells
This assay was done with normal bone marrow cells. The cells were incubated with specific aptamers labeled with biotin at the 5′ end and the fluorescence signal detected using PE-labeled streptavidin. Each individual aptamers was incubated alongside with monocyte specific monoclonal antibodies anti-CD14 labeled with Allophycocyanin (APC) and FITC labeled anti-CD64. After incubation and washing, the florescence signal was detected by flow cytometry.
Results
Selection and binding assays
Cell-SELEX was effectively used for the selection using HL60 as positive and NB4 as negative cell lines. A random ssDNA pool (approximately 1014) was subjected to sequential binding and elution to enrich DNA sequences that can recognize surface markers of the target cells. Two myeloid cell lines, HL60 and NB4, were chosen as the model system to select DNA sequences for differential recognition. HL60 was used as the target cell line and NB4 for counter selection. The introduction of counter selection provides the opportunity to eliminate, as much as possible, common surface markers while enriching differential markers on the target cells. DNA pool collected after each round of selection was amplified by PCR. The enrichment of the DNA pool through successive selection was monitored by flow cytometry. The increased fluorescence intensity is an indication of the enrichment of cell-binding DNA sequences (Figure 1). With the increasing numbers of selection cycles, there was steady increase in the fluorescence intensity on the target cells, while there was no significant change of fluorescence intensity on the control cells. By the 16th round of selection, the fluorescence signals on the target cells significantly exceeded those on the control cells. That notwithstanding, the enrichment fluorescence intensity seemed not to be very large as is generally observed between target and control cells. We believe that this observation is due to the closeness of these two cell lines. In addition the intensity of the fluorescence signal can be influenced by the coupling efficiency of the fluorophore.
Figure 1.
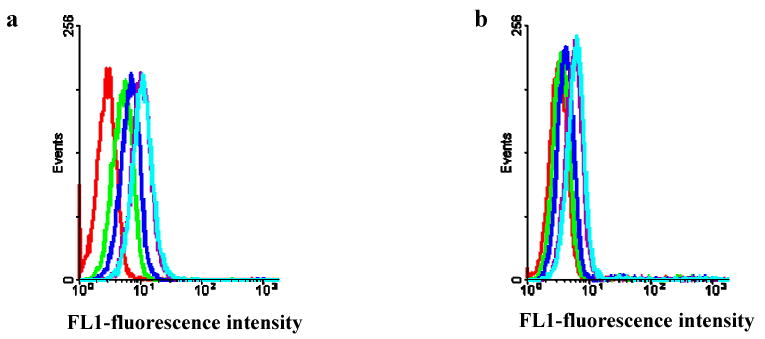
Flow cytometry assays to monitor the enrichment of aptamer candidates during selection. (a) the target cells, HL60; (b) the negative cells, NB4. The fluorescence intensity is shown as the following: control unselected library (red); DNA pools; 12th -round DNA pool (green), 13th round DNA pool (blue), 14th round DNA pool (purple), and 16th round DNA pool (light blue).
The significantly enriched DNA pool was used for DNA cloning, and the positive clones were sequenced using a high throughput sequencing facility at the Interdisciplinary Center for Biotechnology Research (ICBR), University of Florida. The DNA sequences were grouped into families based on their sequence homology. Representative sequences from the different families were chosen to test their interactions with the target cells. Out of the initial 10 sequences tested, 8 showed significant binding to the target, HL60 (Table 1). We then determined the dissociation constant for some of the selected aptamers, and all were in the nanomolar range. As shown in Table 1 and Figure 2, KH1C12 and KHG11 showed selective binding to the target, and they bound to target with very high affinity (kd = 5.4 ± 1.6 nM and 6.1 ± 2.1 respectively). In general, the nanomolar range dissociation constants of the selected aptamers compare well with that of antibodies.
Table 1.
Different aptamer sequences showing recognition to HL60 and their corresponding kd
| Aptamer | Recognition | Sequence | Kd (nM) |
|---|---|---|---|
| KH1C12 | ++++ | ATCCAGAGTGACGCAGCATGCCCTAGTTACTACTACTCTTTTTA GCAAAC GCCCTCGCTTTGGACACGGTGGCTTAGT | 4.5± 1.6 |
| KHG11 | ++++ | ATCCAGAGTGACGCAGCATGCTCATCCACGATTCTGGCGAATTT AGTGCCTGTCTTTTTCTCTTGGACACGGTGGCTTAGT | 6.1 + 2.1 |
| KH2B05 | ++ | ATCCAGAGTGACGCAGCACACACAACCTGCTCATAAACTTTACT CTGCTCG AACCATCTCTGGACACGGTGGCTTAGT | 184.5 ± 20.2 |
| KH1A02 | ++ | ATCCAGAGTGACGCAGCAGGCATAGATGTGCAGCTCCAAGGAG AAGAA GGAGTTCTGTGTATTGGACACGGTGGCTTAGT | 106.1 ± 15.4 |
| KK1B10 | +++ | ATCCAGAGTGACGCAGCAGATCAGTCTATCTTCTCCTGATGGGTT CCT ATTTATAGGTGAAGCTGGACACGGTGGCTTAGT | 256.0 ± 72.0 |
| KK1D04 | +++ | ATCCAGAGTGACGCAGCACAAAGTCTCTTCGGCGCGAATCAGTTC ATC TTTCCCTGATGGGGGTGGACACGGTGGCTTAGT | 204.6 ± 48.4 |
| KH1B08 | + | ATCCAGAGTGACGCAGCATTCAAATCACACGACGCATTGAAACA CTCTACAATATCACATTTA TGG ACA CGG TGG CTT AGT | ND |
| KH3H03 | + | ATCCAGAGTGACGCAGCACTGGCGCCTTCTACTTCAAGGCAATA AGCT CAATCAATATCATCGTGGACACGGTGGCTTAGT | ND |
Abbreviations: Kd, dissociation constant; nM, nanomolar; ND, not determined
The fluorescence intensity of KH1C12 with HL60 cells was chosen as the maximum with an estimated >95% of cell binding (++++). The fluorescence intensities with other aptamers were therefore compared and accordingly assigned approximate binding intensity. A “–”indicates that the fluorescence intensity is similar to that of the unselected library.
Figure 2.
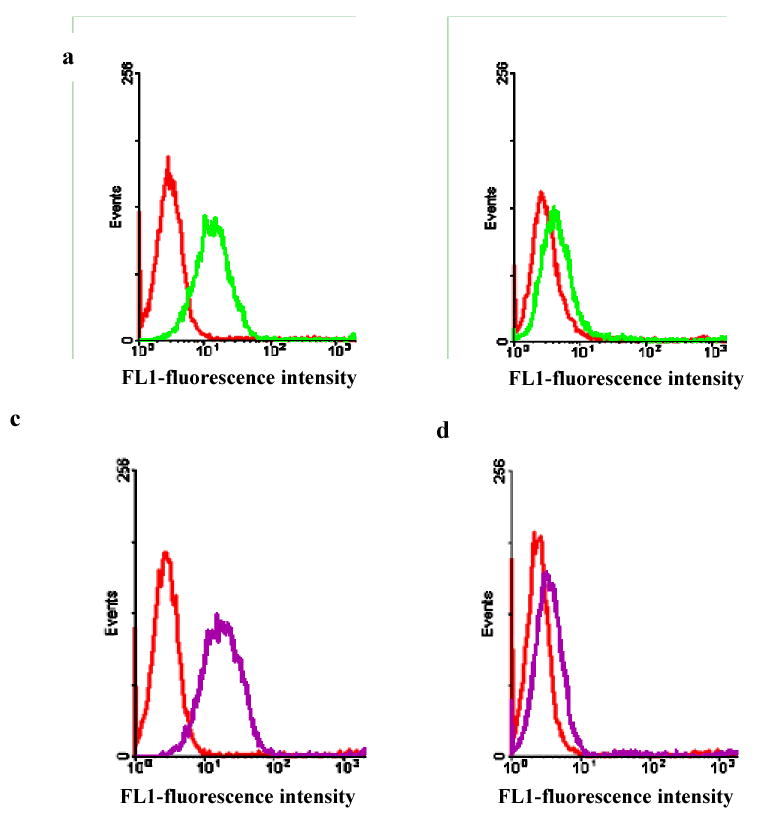
Identification of potential aptamer candidates. Binding assays of selected aptamers, KH1C12 with target HL60 (a), and control cells NB4 (b); KHG11 with the target Hl60 (c) and control cells NB4 (d). The red histogram shows the background binding.
We tested the influence of the other aptamers selected along with KH1C12, as well as those known to bind to leukemia cell lines, 3, on the binding of KH1C12 to its target. Ten-fold excess of the unlabeled competitor was first incubated with HL60 before cells were incubated with KH1C12 to ensure the competitive advantage. As shown in Supplementary Figure 1, only KHG11 could block the binding of KH1C12. As a positive control to check the effectiveness of the assay, the unlabeled KH1C12 also blocked the binding of the FITC-labeled KH1C12 (Supplementary Figure 2k). The observation that KHG11 influence the binding of KH1C12 suggests that these aptamers bind to the same target and/or to the same binding pocket though they have significant sequence diversity (Table 1). None of the other selected aptamers had any influence on the binding of KH1C12. This result further confirmed the binding specificity of selected aptamers.
Since the KH1C12 aptamer showed better affinity than KHG11 and initial study suggesting that both seem to bind to the same molecule on target cell, KH1C12 was further characterized for its interaction with other cell lines, including myeloid and T- and B-cell leukemia lines. As shown in Table 2, aptamer KH1C12 showed no recognition at all to T-cell and B-cell lines tested (Supplementary Figure 2). On the other hand, we observed a differential recognition pattern to myeloid cell lines. Aptamer KH1C12 did not have any interaction with the K562 (erythroid leukemia cell line with t(9;22) translocation) or HEL (erythroleukemia) cell lines. However, some level of recognition was observed with Kasumi-1, t(8, 21) translocation (AML-M2), Monomac-6 (AML-M5), and MV4-11 (biphenotypic B myelomonocytic leukemia) (Table 2 and Supplementary Figure 1).
Table 2. Recognition pattern of KH1C12 aptamer to different leukemia cell lines.
| Cell line | Disease | KH1C12 |
|---|---|---|
| HL60 | AML/APL | ++++ |
| NB4 | APL | - |
| Kasumi-1 | AML | + |
| Monomac- 6 | AML | ++ |
| MV4-11 | AML | ++ |
| HEL | AML | - |
| K562 | CML | - |
| Ramos | B-cell | - |
| CEM | T-cell, ALL | - |
| Jurkat | T-cell, ALL | - |
The fluorescence intensity of KH1C12 with HL60 cells was chosen as the maximum with an estimated >95% of cell binding (++++). The fluorescence intensities with other cell lines were therefore compared and accordingly assigned approximate binding intensity. A “–” indicates that the fluorescence intensity is similar to that of the unselected library.
Abbreviations: AML, acute myeloid leukemia; APL, acute promyelocytic leukemia; CML, chronic myeloid leukemia; ALL, acute lymphoblastic leukemia.
The stability of aptamer binding to target cells was also assessed at different temperatures. Since aptamers were selected at 4°C, a study was done to verify the suitability of using this aptamer at physiological temperature. The aptamer/cell mixtures were incubated at 4°C, room temperature and 37°C. As shown in flow cytometry binding assays in Supplementary Figure 3, there was no significant change in fluorescence intensities among the three different temperatures tested. This observation is important for further development of assays testing the uses of these aptamers for targeted therapy or for apoptotic and viability assays at physiological conditions.
Testing on normal human bone marrow aspirates and patients' leukemia samples using selected aptamers
Although there are significant differences between patients' leukemia cells in clinical samples and established leukemia cell lines7, considering this variability, we assessed the suitability of using the selected aptamers for molecular recognition of leukemia cells in clinical samples. These aptamers were used, along with characteristic monoclonal antibodies, as positive controls. As a first step, the FITC-labeled aptamer was incubated with normal bone marrow aspirates. KH1C12 showed no recognition with any subpopulation of the normal bone marrow aspirates (Figure 4a). However, when the bone marrow aspirates were mixed with HL60 or NB4 cells, and incubated with the aptamer, KH1C12 could selectively recognize the target HL60 cells (Figure 4b), but not the negative control NB4 cells (Figure 4c). This property may be useful especially when real clinical specimen is involved. Generally leukemia clinical specimen has diverse cell constituents and the importance of a probe to single out diseased cells cannot be overemphasized. The recognition of the selected aptamers with clinical samples was diversed. As shown in table 3, the selected aptamers showed between 20 and 40% recognition of the AML patients samples tested compared. Interestingly, Sgc4 showed 70% recognition to AML samples but however showed broad recognition to other leukemia. Expectedly, none of the AML aptamers could identify any of the T-cell and B-cell samples tested and only one aptamer selected, KK1D04, was positive for the one APL sample tested.
Figure 4.
KH1C12 interaction with normal bone marrow cells (a) and its recognition with HL60 and NB4 cells, each in mixture with normal bone marrow aspirates. FITC-labeled KH1C12 and PerCP-labeled anti-CD45 antibody were incubated with HL60 (b) and NB4 cells (c) mixed with normal bone marrow aspirates (blue dots: lymphocytes, green dots: granulocytes and red dots: leukemic cells. The incubation mixtures were assayed by flow cytometry. KH1C12 could recognize HL60, but not NB4, in mixture with normal bone marrow cells. This is shown by the increase in fluorescence intensity in FL1-Height of the red dots (b), but not in (c)
Table 3. Recognition of leukemia clinical samples by the selected aptamers.
| Aptamer | KH1C12 | KHG11 | KH3H03 | KH2B05 | KH1A02 | KK1B10 | KK1D04 | Sgc43 | Sgc83 |
|---|---|---|---|---|---|---|---|---|---|
| T-cell | 0/3 | 0/3 | 0/3 | 0/3 | 0/3 | 0/3 | 0/3 | 1/3 | 0/3 |
| B-Cell | 0/2 | 0/2 | 0/2 | 0/2 | 0/2 | 0/2 | 0/2 | 1/2 | 0/2 |
| AML | 2/10 | 2/10 | 0/10 | 0/10 | 3/10 | 3/10 | 4/10 | 7/10 | 2/10 |
| APL | 0/1 | 0/1 | 0/1 | 0/1 | 0/1 | 0/1 | 1/1 | 1/1 | 0/1 |
Aptamers from different publication as referenced
Effect of differentiation on aptamer binding
Several studies have reported NB4 and HL60 differentiation pathways associated with ATRA and sodium butyrate induction.8, 9,10, 11, 12 We therefore used the nitroblue tetrazolium (NBT) reduction test to assess and confirm that the leukemic blasts differentiate into peroxidase-positive leukocytes (neutrophils and monocytes). Upon induction of ATRA, NB4 and HL60 cells differentiate along the granulocytic pathway, whereas sodium butyrate induces the monocytic pathway. Metcalf and Boyd11 reported that sodium butyrate induced differentiation in virtually 100% of HL60 cells over a four-day interval to cells with multiple phenotypic markers of monocytes. Treatment of HL60 and NB4 cells with 1μM ATRA and 0.5mM sodium butyrate was studied for up to 5 days. Continued exposure of the cells to these differentiating agents resulted in morphological and functional changes, including decrease in cell volume and increase in black formazan deposits over time in both cells lines (Figures 5a, b, c and 6a, b, c). Associated with these events, the selected aptamers showed various patterns of recognition to the differentiated cells. Generally, KH1C12 did not show any observable change in fluorescence intensity among the treated HL60 cells with ATRA and sodium butyrate ((Figures 5e, f and 6e, f) and the controls ((Figures 5d and 6d), suggesting that there was no significant change in the expression level of target. On the other hand, KK1B10 and KK1D04 produced significant change in binding patterns with both cell lines. Both aptamers lost significant fluorescence signal (KK1D04 reduced to background) with ATRA-induced HL60 and NB4 cells (Figure 5h, k and 6h, k). In contrast, they showed an increase in fluorescence signal intensity when cells were induced to differentiate with sodium butyrate (Figure 5i, l and 6i, l). These findings suggest that the targets recognized by KK1B10 and KK1D04 are up-regulated when leukemic cells differentiate toward monocytic cells.
Figure 5.
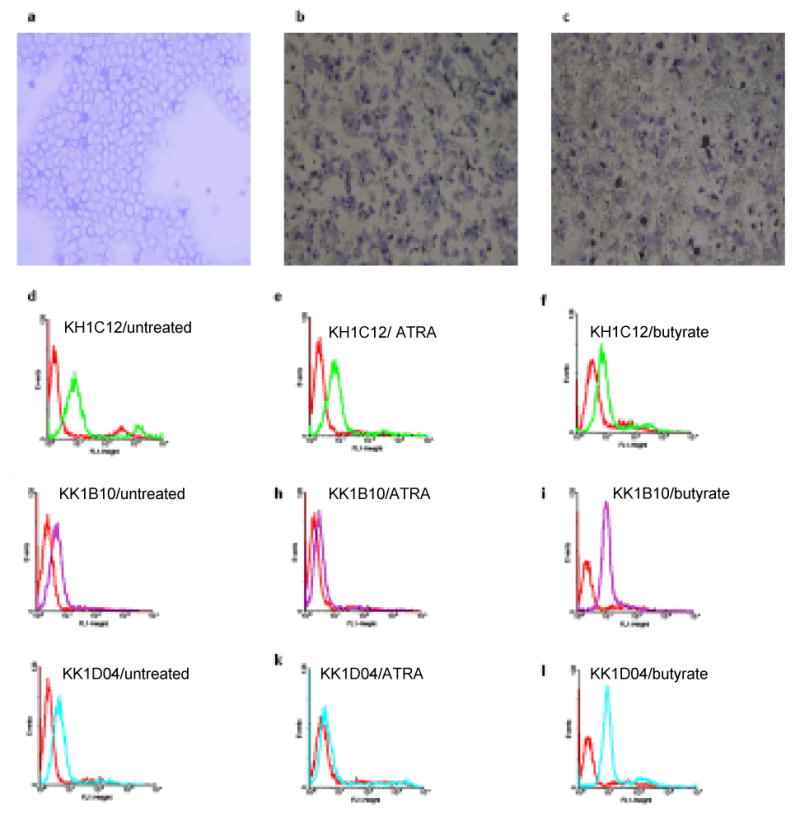
Cytospin preparations followed by Accustain Wright staining of HL60 cells (a) untreated, (b) ATRA-induced differentiated, and (c) sodium butyrate-induced differentiated, showing the formation of formazan deposits (×10 magnification). The FACscan histograms above show the binding profile of the selected aptamers to the untreated, ATRA treated and sodium butyrate treated cells. The red histograms show fluorescence background using the unselected DNA library.
Figure 6.
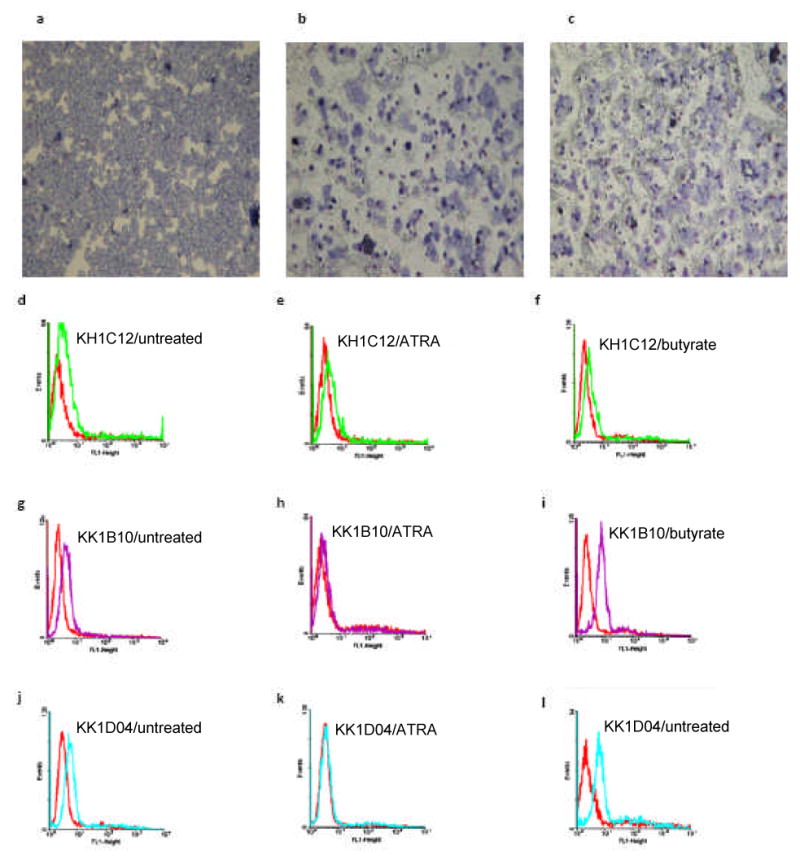
Cytospin preparations followed by Accustain Wright staining of NB4 cells (a) untreated, (b) ATRA-induced differentiated, and (c) sodium butyrate- induced differentiated, showing the formation of formazan deposits (×10 magnification). The FACscan histograms show the binding profile of the selected aptamers to the untreated, ATRA treated and sodium butyrate treated cells. The red histograms show fluorescence background using the unselected DNA library.
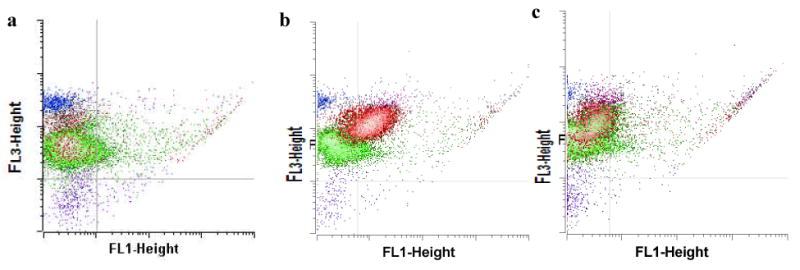
The observation that the florescence signal intensity of KK1B10 and KK1D04 was increased with monocytic differentiated HL60 and NB4 cells was further assessed with monocytic cells from bone marrow aspirate. The assay was done alongside with monocytes specific antibodies CD14 and CD64. The aptamers KK1B10 and KH1C12 were used in this assay. Figure 7a shows the various cell types in bone marrow aspirate. The gated area, showing high florescence signal for CD64 represents monocytes. The aptamers KH1C12 and KK1B10 response to these monocytes are represented in figures 7b – 7e. KH1C12 shows some level of recognition in all stages of the monocytic population as shown in figure 7e and represented in histogram in figure 7d. On the other hand, KK1D04 showed tremendous recognition with mature monocytes (figure 7b and 7c) implying that as cells differentiate into monocytes, the target protein is highly expressed. This may explain why KH1C12 signal intensity did not change but significantly increased for KK1B10 when the HL60 and NB4 cells were differentiated to monocytes.
Figure 7.

Flow cytometry analysis of aptamers binding to monocytic cells in bone marrow aspirate. (a) Dot plot of bone marrow cells as identified by FITC-labeled anti-CD64. The gated cells (purple) with high anti-CD64 signal represent monocytic cells. (b) and (c) represent KK1B10 signal (blue) whereas (d) and (e) represent KH1C12 signal (blue). Unselected library was used as fluorescence background (purple).
Discussion
Using the strategy of the cell-based SELEX system, we report here the development of a molecular aptamer probe that can distinguish target HL60 cells from control NB4 cells, demonstrating the achieved specificity of selected aptamers. These two cell lines are closely related morphologically5 and that the leukemic cells of most patients with AML are generally homogenous with respect to the expression of myeloid cell surface antigens.13 As such, it should have been very difficult to generate aptamers to distinguish between them. Nonetheless, we were able to accomplish this task by identifying aptamer KH1C12 which could selectively recognize the target HL60 cells, but not the negative control NB4 cells. Moreover, aptamer KH1C12 recognized HL60 with high affinity (4.5 nM), and its binding to target was not significantly influenced by increasing the temperature to 37°C, a critical advantage in the development of probes for in vivo applications. We could not make comparison to any antibody in regards to this selective recognition potential since to the best of our knowledge, there is no such antibody. At best the antigens may be differentially expressed on the different myeloid cell lines. Apparently, we also identified aptamers that can recognize target as well as control cells. However, none of the aptamers selected against myeloid leukemia cell lines showed recognition to any of tested cell lines of T-cell or B-cell leukemias or lymphomas. The counter selection strategy can help to select cell-specific aptamer probes, but it is not feasible to remove all the aptamer sequences that recognize both target and control cells. Other reported studies also showed similar findings and concluded that the counter selection strategy might not be completely effective.3, 14 The preliminary observation that the selected aptamers can recognize real clinical patient samples is significant. This is an indication of the potential of these probes when they are well developed and optimized. Further testing of more clinical specimen will however be needed to fully establish the feasibility of further development of these aptamers for clinical use.
The HL60 and NB4 cell lines have played important roles as model cell systems in analyzing the various mechanisms underlying cellular differentiation events. For instance, microarray analysis of TPA-induced differentiation of HL-60 cells has resulted in the identification of a large number of genes that showed altered expression. A number of downstream targets were induced by TPA, and some of these are thought to be essential for the onset of differentiation.15 Similarly, Lijun et al.16 reported that ATRA-induced differentiation of NB4 cells resulted in about 168 up-regulated, and over 179 down-regulated, genes. Many of the altered genes are thought to encode products that participate in signaling pathways, cell differentiation, programmed cell death, transcription regulation and production of cytokines and chemokines. Therefore knowing the molecular mechanisms associated with differentiation and maturation of hematopoietic cells may be useful for the manipulation of blood cell production.
We therefore used these cell systems to assess the effect of cellular differentiation on the binding capacity of three aptamers selected by cell-SELEX. To accomplish this, we compared the changes in fluorescence intensities of these aptamers as they interacted with undifferentiated and differentiated cells. Although the binding pattern of aptamer KH1C12 was not affected by cell differentiation, the fluorescent signals of both KK1B10 and KK1D04 aptamers to HL60 and NB4 cells are altered during chemical induced cell differentiation. Both aptamers showed decreased binding signals in ATRA-treated cells, but increased binding signals in sodium butyrate-treated cells, indicating their target proteins are differentially regulated in two different differentiation processes induced by two chemical products. It has been severally reported that both NB4 and HL60 cell line can be induced to differentiate towards monocytic and granulocytic pathways depending on the chemical inducer, ATRA inducing granulocytic differentiation17, 18 and sodium butyrate inducing monocytic/macrophage diffentiation.10, 11, Therefore, it is conceivable that the targets recognized by both KK1B10 and KK1D04 are associated with monocytic differentiation and they can potentially be useful probes for study of monocytic differentiation process. Our study suggests qualitative and quantitative differences in the protein targets of KK1B10 and KK1D04 occur during monocytic and granulocytic differentiation. Similarly, Mollinedo et al10 observed that treatment of HL60 cells with sodium butyrate, induced monocytic differentiation, causing remarkable increase in AP-1 binding activity. Another monocytic differentiation agent 1 alpha,25-dihydroxyvitamin D3, induced a weak, but appreciable, increase in AP-1 activity. Furthermore, addition of sodium butyrate or 1 alpha,25-dihydroxyvitamin D3 to HL-60 cells induced the expression of c-fos, c-jun, jun B and jun D proto-oncogenes. In contrast, when HL-60 cells were treated with retinoic acid, a granulocytic differentiation inducer, no enhanced AP-1 binding activity was observed, and only a weak increase in jun D mRNA level was detected. The findings of our studies indicate that aptamer based technology can also be used as a tool for comparative analysis between tumor cells and their differentiated forms, which could enable us to identify gene products that may have specific roles in cellular differentiation and tumor pathogenesis.
Malignancy such as myeloid leukemias is composed of tumor cells at different differentiation direction and at different differentiation stages. Leukemia cells are classified as myeloid leukemia as long as they show evidence of one of the following differentiation, erythroid, granulocytic, monocytic or megakaryocytic differentiation. Having molecular probes that can recognize a specific differentiation pathway would be very useful in leukemia studies as well as in clinical leukemia diagnosis. Although this study only produced a few specific aptamers, it demonstrates the capability of the cell-based aptamer selection strategy in identifying markers for subclasses of AML and the potential for exploring new and useful disease surface markers.
Supplementary Material
Figure 3.

Binding curve of the KH1C12 aptamer with HL60 cells. Cells were incubated with varying concentrations of FITC-labeled aptamer in triplicate. The mean fluorescence intensity of the unselected library (background binding) at each concentration was subtracted from the mean fluorescence intensity of the corresponding aptamer.
Acknowledgments
We thank the DNA sequencing core, ICBR at the University of Florida. This work is supported by NIH GM079359 and CA122648, and NSF grant.
References
- 1.Ikeda A, Shankar DB, Watanabe M, Tamanoi F, Moore TB, Sakamoto KM. Molecular targets and the treatment of myeloid leukemia. Molecular Genetics and Metabolism. 2006;88:216–224. doi: 10.1016/j.ymgme.2006.03.011. [DOI] [PubMed] [Google Scholar]
- 2.Aribi A, Ravandi F, Giles F. Novel Agents in Acute Myeloid Leukemia. The Cancer J. 2006;12(2):77–91. [PubMed] [Google Scholar]
- 3.Shangguan D, Li Y, Tang Z, Cao ZC, Chen HW, Mallikaratchy P, Sefah K, Yang CJ, Tan W. Aptamers evolved from live cells as effective molecular probes for cancer study. PNAS. 2006;103(32):11838–11843. doi: 10.1073/pnas.0602615103. [DOI] [PMC free article] [PubMed] [Google Scholar]
- 4.Tang Z, Shangguan D, Wang K, Shi H, Sefah K, Mallikratchy P, Chen HW, Li Y, Tan W. Selection of Aptamers for Molecular Recognition and Characterization of Cancer Cells. Anal Chem. 2007;79:4900–4907. doi: 10.1021/ac070189y. [DOI] [PubMed] [Google Scholar]
- 5.Labbaye C, Zhang J, Casanova JL, Lanotte M. Regulation of Myeloblastin Messenger RNA Expression in Myeloid leukemia Cells Treated With All-Trans Retinoic Acid. Blood. 1993;81(2):574–481. [PubMed] [Google Scholar]
- 6.Bhatia M, Kirkland JB, Meckling-Gill KA. Monocytic Differentiation of Promyelocytic Leukemia Cells in Response to 1,25-Dihydroxyvitamin D3 Is Independent of Nuclear Receptor Binding. J Biol Chem. 1995;270(27):15962–15965. doi: 10.1074/jbc.270.27.15962. [DOI] [PubMed] [Google Scholar]
- 7.Leupin N, Kuhn A, Hügli B, Grob TJ, Jaggi R, Tobler A, Delorenzi M, Fey MF. Gene expression profiling reveals consistent differences between clinical samples of human leukemia and their model cell lines. British Journal of hematology. 2006;135:520–523. doi: 10.1111/j.1365-2141.2006.06342.x. [DOI] [PMC free article] [PubMed] [Google Scholar]
- 8.Olins AL, Hermann H, Lichter P, Olins DE. Retinoic Acid Differentiation of HL-60 cells Promotes Cytoskeletal Polarization. Experimental Cell Research. 2000;254:130–142. doi: 10.1006/excr.1999.4727. [DOI] [PubMed] [Google Scholar]
- 9.Marques-Silva VM, De Souza MHO, Teixeira MCL, Arcuri RA, Rumjanek VM. Myeloid leukemia Differentiation by Phorbol Ester and Retinoic Acid: A Practical Approach. Journal of Clinical Laboratory Analysis. 1990;4:342–349. doi: 10.1002/jcla.1860040506. [DOI] [PubMed] [Google Scholar]
- 10.Mollinedo F, Gajate C, Tugores A, Flores I, Naranjo JR. Differences in expression of transcription factor AP-1 in human promyelocytic HL60 cells during differentiation towards macrophages versus granulocytes. Biochem J. 1993;294:137–144. doi: 10.1042/bj2940137. [DOI] [PMC free article] [PubMed] [Google Scholar]
- 11.Boyd AW, Metcalf D. Induction of differentiation in HL60 leukemia cells: A cell cycle dependent all-or-none event. Leuk Res. 1984;8(1):27–43. doi: 10.1016/0145-2126(84)90029-8. [DOI] [PubMed] [Google Scholar]
- 12.Collins JS. The HL60 Promyelocytic Leukemia Cell Line: Proliferation, Differentiation, and cellular Oncogene Expression. Blood. 1987;70(5):1233–1244. [PubMed] [Google Scholar]
- 13.Griffin DJ, Larcom P, Schlossman FS. Use of Surface Markers to Identify a Subset of Acute Myelomonocytic Leukemia Cells With Progenitor Cell Properties. Blood. 1983;62(6):1300–1303. [PubMed] [Google Scholar]
- 14.Cerchia L, Ducongeé F, Pestourie C, Boulay J, Aissouni Y, Gombert K, Tavitian B, de Franciscis V, Libri D. Neutralizing Aptamers from Whole-Cell SELEX Inhibit the RET Receptor Tyrosine Kinase. Plos Biology. 2005;3(4):0697–0704. doi: 10.1371/journal.pbio.0030123. [DOI] [PMC free article] [PubMed] [Google Scholar] [Retracted]
- 15.Zheng X, Ravatn R, Lin Y, Shih Wei-Chung, Rabson A, Strair EH, Conney A, Chin Khew-Voon. Gene expression of TPA induced differentiation in HL60 cells by DNA microarray analysis. Nucleic Acid Research. 2002;30(20):4489–4499. doi: 10.1093/nar/gkf580. [DOI] [PMC free article] [PubMed] [Google Scholar]
- 16.Yang L, Zhao H, Li SW, Ahrens K, Collins C, Eckenrode S, Ruan Q, Mclndoe RA, She JX. Gene Expression Profiling during All-trans Retinoic Acid-induced Cell Differentiation of Acute Promyelocytic Leukemia Cells. Journal of Molecular Diagnostics. 2003;5(4):212–221. doi: 10.1016/S1525-1578(10)60476-X. [DOI] [PMC free article] [PubMed] [Google Scholar]
- 17.Chomienne C, Ballerini P, Balitrand N, Daniel MT, Fenaux P, Castaigne S, degos L. All-Trans Retinoic Acid in Acute Promyelocytic Leukemias. II. In Vitro studies: Structure-Function Relationship. Blood. 1990;76(9):1710–1717. [PubMed] [Google Scholar]
- 18.Collins SJ, Robertson KA, Mueller L. Retinioc Acid-Induced Granulocytic Differentiation of HL60 Myeloid Leukemia Is Mediated Directly through the Retinoic Acid Receptor (RAR-α) Molecular and Cellular Biology. 1990;10:2154–2163. doi: 10.1128/mcb.10.5.2154. [DOI] [PMC free article] [PubMed] [Google Scholar]
Associated Data
This section collects any data citations, data availability statements, or supplementary materials included in this article.