

Abstract
Diabetes compromises endothelial function and inhibits reparative neovascularization. The neurotrophin receptor p75NTR is scarcely present in healthy endothelial cells (EC), but diabetes induces p75NTR in capillary EC of ischemic limb muscles. Here, we show that forced p75NTR expression impairs survival, proliferation, migration, and adhesion capacities of EC and endothelial progenitor cells (EPC) and inhibits EC tube formation. In EC, p75NTR depresses the VEGF-A/Akt/eNOS/NO pathway and reduces VEGF-A, ITGB1, BIRC5, PTTG1, and VEZF1 mRNA levels. Moreover, both diabetes and p75NTR transfer down-regulate VEGF-A, ITGB1, and VEZF1 in adductor muscles. Forced p75NTR expression by ischemic limb muscles impairs post-ischemic neovascularization and blood flow recovery in normoglycemic mice. Conversely, p75NTR inhibition in diabetic muscles restores proper post-ischemic neovascularization and prevents apoptosis of muscular capillary EC and bone marrow-resident Sca-1+Lin- progenitor cells. Collectively, our data identify the anti-angiogenic action of p75NTR and suggests the therapeutic potential of p75NTR inhibition to combat diabetes-induced microvascular liabilities.
Diabetes induces apoptosis and reduces the function of endothelial cells (EC) and endothelial progenitor cells (EPC). As a result, post-ischemic reparative angiogenesis and vasculogenesis are both impaired in diabetic subjects.1-12 The consequences are harmful: In the leg, severe microangiopathy aggravates atherosclerosis-induced muscular ischemia, thus contributing to gangrene and cutaneous ulcers with a severely impaired healing potential, which make amputation of the diabetic foot an all-too-frequent necessity.13,14 A remedy to prevent and treat such diabetic microvascular complications is urgently needed.
Neurotrophins (NTs) have been extensively studied for their actions on the nervous system. However, it is becoming increasingly evident that the expression and function of NTs is also important in the cardiovascular system. Both EC and EPC express tropomyosin kinase receptors (trk), which are tyrosine-kinases binding NTs with high affinity. The NT nerve growth factor (NGF) and brain-derived neurotrophic factor (BDNF), acting on trkA and trkB respectively, promote EC survival and angiogenesis.3,15-18 Moreover, NGF, via trkA, is an autocrine survival factor for cardiomyocytes.19 NTs have another receptor of 75 KD MW (p75NTR). p75NTR contains a death domain and belongs to the TNF receptor super-family, but it does not bind TNF-α. In neural cells, p75NTR mediates apoptosis and cell cycle arrest.20-22 It was proposed that p75NTR has a low affinity for mature NTs, as it preferentially binds pro-forms of NTs.23-25 However, the mechanisms underpinning p75NTR activation and downstream molecular signaling have not been fully elucidated. Notably, no investigation of the role of p75NTR on EC and EPC survival and function or on blood vessel growth has been attempted to date. We previously reported that p75NTR is scarce in capillary EC of healthy murine limb muscles, but that expression strikingly increases following induction of type-1 diabetes and hindlimb ischemia; two conditions that also promote EC apoptosis.3,10,26
This study demonstrates that p75NTR promotes apoptosis of EC and vascular progenitor cells and inhibits neovascularization. We explain the anti-angiogenic effect of p75NTR by its inhibitory effect on the vascular endothelial growth factor A (VEGF-A)/Akt kinase axis. Finally, we provide evidence that p75NTR is responsible for the impaired neovascularization response to peripheral ischemia in diabetes.
Results
Adenovirus-mediated p75NTR transduction of EC
Under standard culture conditions, human umbilical vein EC (HUVEC) have insignificant p75NTR expression level (see Null group of Fig. 1a and 1b,). To study p75NTR functions in EC we forced the expression of the human p75NTR or Null control in HUVEC by adenovirus-mediated gene transfer. Successful p75NTR transduction was confirmed by both western blot and FACS analysis (Fig. 1a and 1b).
Fig. 1. Adenovirus-mediated p75NTR transduction of EC promotes apoptosis via caspase-3 cleavage and stimulates the production of apoptotic microparticles from HUVEC.
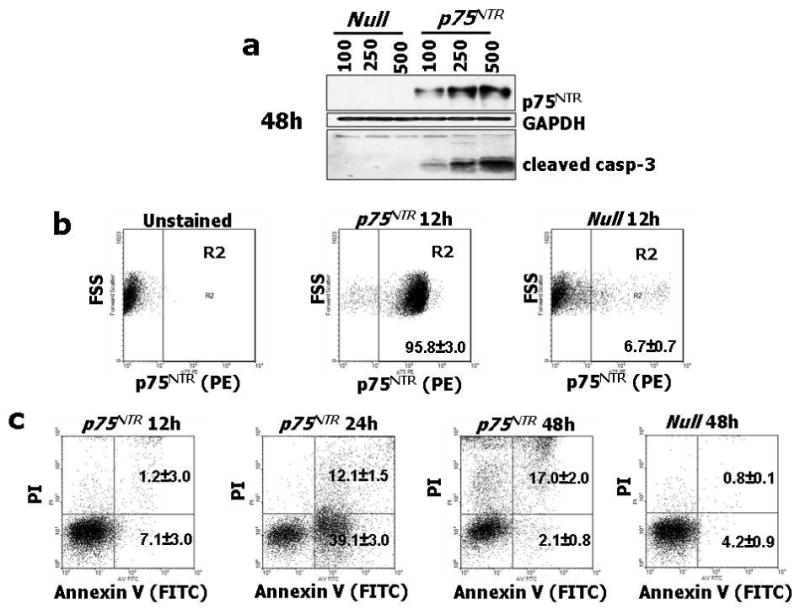


(a) HUVEC were infected with 100, 250 and 500 M.O.I. of Ad.Null or Ad.p75NTR, as indicated. After 48h, cell lysates were collected and subjected to western blotting with antibodies to p75NTR, cleaved caspase-3, and GAPDH (used as loading control). (b) FACS analyses for p75NTR show abundant receptor expression (95.8±3%) at 12h from gene transfer with Ad.p75NTR (250 M.O.I.), while at 12h from Null gene transfer, p75NTR-expressing HUVEC are only 6.7±0.7%. (c) p75NTR-expressing HUVEC were gated and studied at 12h, 24h, and 48h for co-expression with Annexin-V and propidium iodide (PI) to detect apoptosis. This analysis revealed that at 12h from Ad.p75NTR, less than 9% of p75NTR-carrying cells presented Annexin-V on the external plasma membrane. Early apoptosis (cells positive for Annexin-V and negative for PI, lower right squares) peaked at 24h (39.1±3% of p75NTR-expressing HUVEC), followed by late apoptosis (cells positive for both Annexin-V and PI, upper right squares) at 48h from Ad.p75NTR (17.05±2% of p75NTR-expressing HUVEC). (d) HUVEC were treated as described in (a) and apoptotic nuclei were detected by TUNEL assay. Fluorescent images are representative of apoptosis rate in Null-HUVEC and p75NTR-HUVEC. Bar graphs quantify apoptosis, which is expressed as percentage of TUNEL-positive nuclei (green fluorescence) to total nuclei (stained in blue fluorescence by DAPI). Data are presented as means±SEM. *P<0.05 and **P<0.001 vs. Ad.Null. (e,f) Caspase-3 activity assay was performed on HUVEC (e) or MVEC (f). Cells (5000 cells/well) were infected with 100, 250 or 500 M.O.I. of Ad.Null or Ad.p75NTR or left uninfected (PBS). After 48h, Caspase-Glo 3/7 was incubated for 1h before recording luminescence. The apoptosis inducer staurosporin (stauro, 1μM) was used as reference in (e). Values are means±SEM. *P<0.05 and **P<0.001 vs. Ad.Null. (g) Upper panel: Concentration of endothelial apoptotic microparticles (EMP) released by Null-HUVEC or p75NTR-HUVEC under no other stimulation or following incubation with the apoptosis inducer staurosporin (100 nM, 16h). Values are means±SEM. **P<0.01 vs. Ad.Null. Lower panel: p75NTR is present in EMP released by HUVEC. The shadow peak corresponds to fluorescence background obtained with the isotypic control of p75NTR antibody. The second peak represents the specific labelling of EMPs with fluorescent p75NTR antibody. (h) Caspase-3 activity assay performed on HUVEC infected with Ad.Null or Ad. p75NTR (each at 100 and 250 M.O.I.) before being treated with PBS, proNGF (5ng/mL), NGF (100ng/mL), or BDNF (100ng/mL) for 24h. Values are means±SEM. *P<0.01 vs. PBS.
p75NTR promotes EC apoptosis
Next, we studied the impact of increased p75NTR expression on HUVEC survival. FACS analysis showed that p75NTR expression precedes appearance of apoptosis in p75NTR–transduced HUVEC (p75NTR–HUVEC) (Fig. 1b and 1c). Early apoptosis (cells positive for Annexin-V and negative for propidium iodide (PI)) peaked at 24h, followed, at 48h, by late apoptosis (Annexin-V+PI+ cells). We confirmed the pro-apoptotic effect of p75NTR in HUVEC by TUNEL apoptosis assay (Fig. 1d), western blot for the apoptosis marker cleaved (activated) caspase-3 (Fig. 1a), and caspase-3 activity assay (Fig. 1e). Additionally, we measured the release of endothelial apoptotic microparticles (EMP)27-29 from p75NTR and Null-transduced HUVEC (Null-HUVEC) with or without exposure to the apoptosis inducer staurosporin (100nM, 16h). Under both circumstances, p75NTR enhanced EMP release and p75NTR was present in EMP (Fig. 1g). Taken together, these results demonstrate that p75NTR promotes HUVEC apoptosis, via caspase-3 activation, in a concentration-response manner. The pro-apoptotic effect of p75NTR was confirmed on human microvascular EC (MVEC) (Fig. 1f).
There is no consensus as to whether p75NTR needs ligand activation to start its death signal. We investigated this possibility on p75NTR- or Null-HUVEC by adding recombinant proNGF, NGF, or BDNF. Both proNGF and NGF slightly increased apoptosis in p75NTR-HUVEC but not Null-HUVEC (Fig. 1h). By contrast, in this experimental setting, BDNF did not influence apoptosis. To rule out the possibility that endogenously produced ligands cause apoptosis via p75NTR, we cultured p75NTR-HUVEC and Null-HUVEC in the presence of a NGF neutralizing antibody3,19 or a soluble trkB receptor.17 Blockade of endogenous NGF or BDNF did not alter apoptosis rate (data not shown). This series of results suggests that p75NTR can induce EC apoptosis via both ligand-dependent and -independent mechanisms.
p75NTR impairs EC proliferation, migration, and in vitro angiogenesis
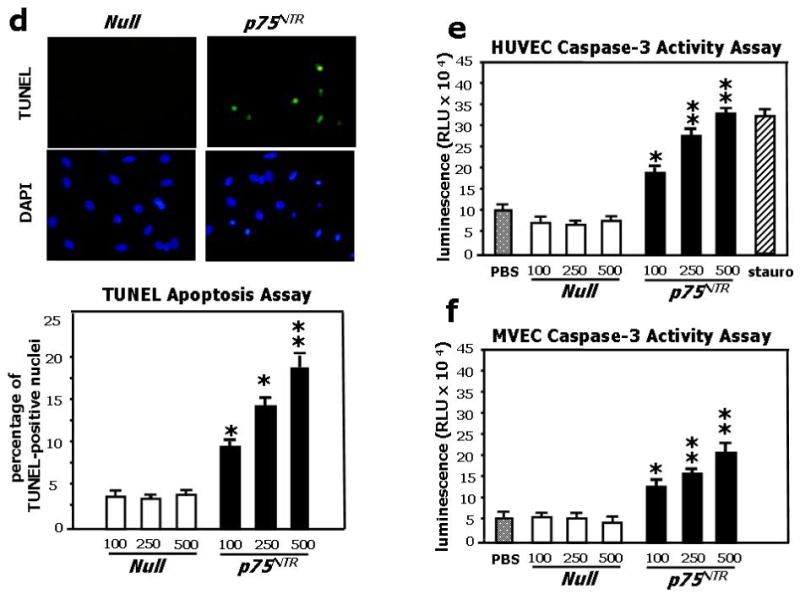
In neural cells, p75NTR promotes cell cycle arrest.20 Since EC replication is intrinsic to the angiogenesis process, we studied the impact of p75NTR on HUVEC cycle progression. HUVEC were synchronized at G1/S boundary by serum starvation and the progression of cell cycle upon release from the G1-block was analyzed by flow cytometry. As shown in Fig. 2a, the control Null-HUVEC entered the cell cycle and progressed through S-phase and G2-M. p75NTR-HUVEC were delayed in cycling, as shown by the reduced percentage of cells in S-phase (P<0.01 at 21h). Correspondingly, the level of phosphorylated tumor suppressor retinoblastoma protein (Rb), a marker of cell cycle progression,30 was less in p75NTR-HUVEC (Fig. 2b). The anti-proliferative effect of p75NTR on EC was further confirmed by BrdU incorporation assay (Fig. 2c).
Fig. 2. p75NTR inhibits EC cell cycle progression and impairs EC ability to proliferate, migrate, adhere, and form capillary-like tubular structures in vitro.
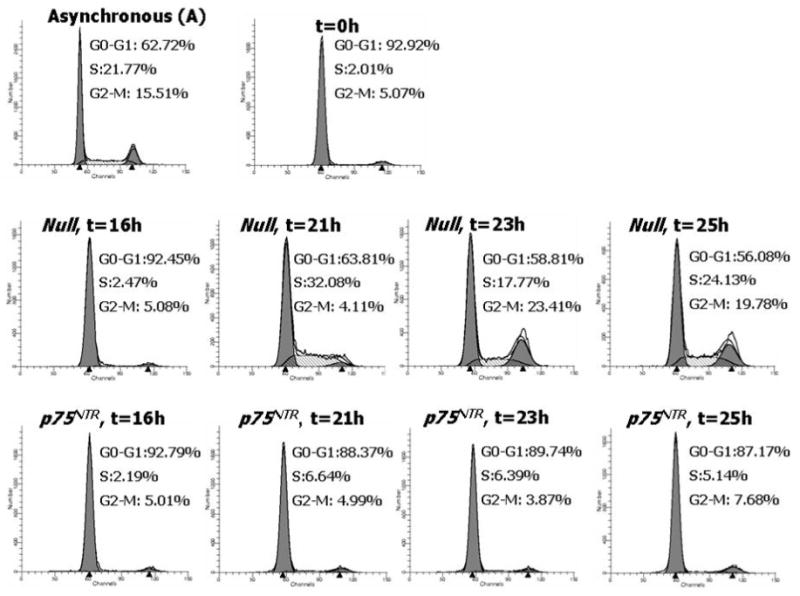
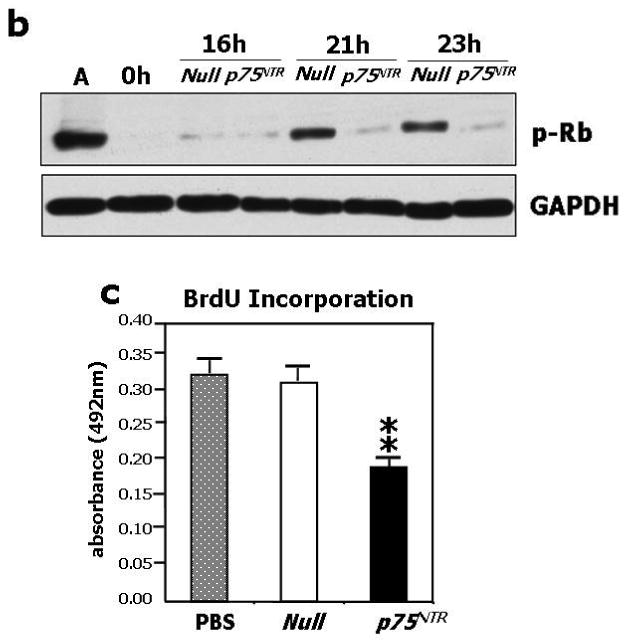
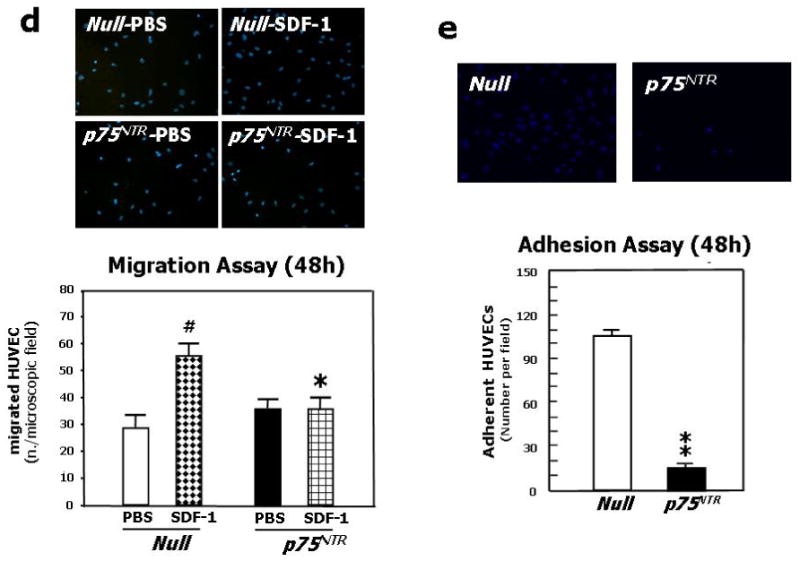
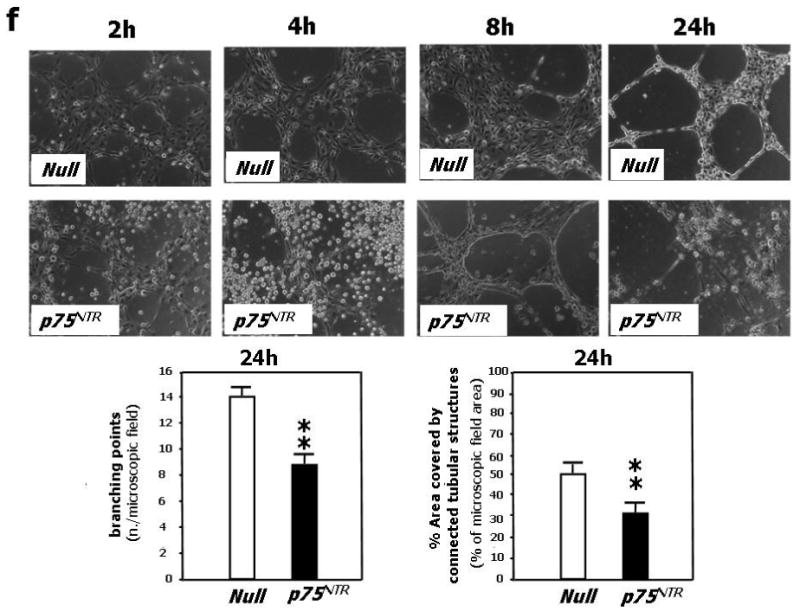
(a) HUVEC were infected with either Ad.Null or Ad.p75NTR (250 M.O.I.). Cells were synchronized by overnight serum starvation. After release, by flow cytometric analysis, cell cycle progression was assessed at the indicated time points. The percentage of cells in G1, S, and G2 phases is indicated in figures. (b) Western blot analysis of phosphorylated tumor suppressor retinoblastoma protein (p-Rb) (marker of cell cycle progression) on total cell extracts derived from HUVEC. GAPDH was used as loading control. (c) Proliferation (measured by BrdU incorporation) of HUVEC infected with Ad.Null or Ad.p75NTR (250 M.O.I.) or uninfected (PBS). **P<0.01 vs. Ad.Null. (d) Migration toward SDF-1 (100ng/mL) or PBS (vehicle) of HUVEC infected 48h in advance with Ad.p75NTR or Ad.Null (250 M.O.I.) In bar graph, values are means±SEM. #P<0.05 vs. Ad.Null combined with PBS, *P<0.05 vs. Ad.Null combined with SDF-1. Upper panels show representative microscopic fields (original magnification 200×) (e) Adhesion assay of HUVEC infected 48h earlier as in (d). HUVEC adhesion was quantified by counting adherent cells following washing of non adherent cells and DAPI staining of nuclei of adherent cells. In bar graph, values are means±SEM. **P<0.01 vs. Ad.Null. Upper panels show representative photomicrographs (magnification 200×) (f) Time-course (up to 24h from cell seeding) of tubular structure formation on matrigel. Twelve hours before being seeded on Matrigel-coated dishes, HUVEC were infected with Ad.Null or Ad.p75NTR. In bar graph, the quantification of EC tube network formation at 24h from seeding is expressed as the number of intersecting points of tubular structures for microscopic field (left) as well as the % of microscopic field area covered by connected tubular structures (right). Values are means±SEM. **P<0.01 vs. Ad.Null. Upper panel: show representative photomicrographs (original magnification 100×).
EC migration is essential for neovessel formation. We tested the effect of p75NTR on EC migratory capacity toward stroma derived factor-1 (SDF-1), which is a classic chemotactic stimulus for the cells of the endothelial lineage.31,32 At both 12h and 48h from transduction, SDF-1 promoted migration of Null-HUVEC. By contrast, the migratory capacity of p75NTR-HUVEC to SDF-1 was severely impaired (Fig. 2d for 48h; 12h data not shown).
Cell-matrix adhesion is also fundamental for vessel growth and maintenance. At both 12h and 48h from transduction, p75NTR-HUVEC showed reduced adhesion capacity to fibronectin (Fig. 2e for 48h; 12h data not shown).
Finally, we tested the angiogenic potential of p75NTR-HUVEC by performing a matrigel assay, which allows determination of the EC potential to give rise to blood vessel-like tubular structures in vitro, thus mimicking angiogenesis. In this assay, which was initiated at 12h post-gene transfer and carried out in the presence of growth factors, the anti-angiogenic effect of p75NTR was evident (Fig. 2f).
p75NTR impairs EPC survival and functions
The growth of new blood vessels needs the participation of both angiogenesis, developed by pre-existing vessels, and vasculogenesis, which involves EPC. Therefore, we extended our study to human peripheral blood EPC. As shown in supplementary Fig. 1, p75NTR negatively impacted on EPC survival (activated caspase-3 assay, panel b), proliferation (FACS analysis of BrdU incorporation, panel c), migration toward SDF-1 (panel d), and adhesion (data not shown).
p75NTR induces a pro-apoptosis and anti-angiogenesis signalling pathway in EC
p75NTR transduction decreased VEGF-A and Ser473-phospho-Akt levels in HUVEC (Fig. 3a). Phospho-Akt positively controls EC survival and angiogenesis by several downstream mediators, including endothelial nitric oxide synthase (eNOS).33 Correspondingly, we found that p75NTR transduction impaired Ser1177-phosphorylation of eNOS (Fig. 3a) and eNOS-derived NO production (Fig. 3b). Normal phospho-eNOS content was restored by gene delivery of either VEGF-A or a constitutive active Akt mutant form (Myr-Akt) in p75NTR-HUVEC (Fig. 3c). By contrast, Myr-Akt did not rescue VEGF-A level in p75NTR-HUVEC, thus suggesting that VEGF-A lies upstream of Akt phosphorylation (Fig. 3c). Focal adhesion kinase (FAK), upstream of Akt, controls EC migration, proliferation and survival.34 Phospho (active)-FAK was less in p75NTR-HUVEC and, as expected, Myr-Akt did not restore phospho-FAK to normal levels (Fig 3c). By contrast, VEGF-A increased phospho-FAK in p75NTR-HUVEC (Fig. 3c). In EPC, p75NTR reduced the levels of both phospho-Akt and phospho-eNOS (supplementary Fig. 1d).
Fig. 3. p75NTR inhibits pro-angiogenesis and pro-survival pathways in EC and mouse limb muscles.
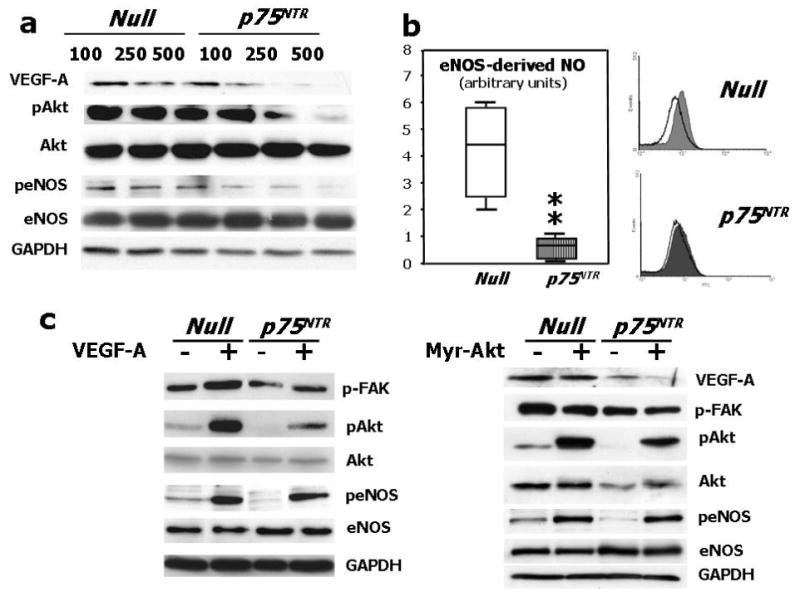
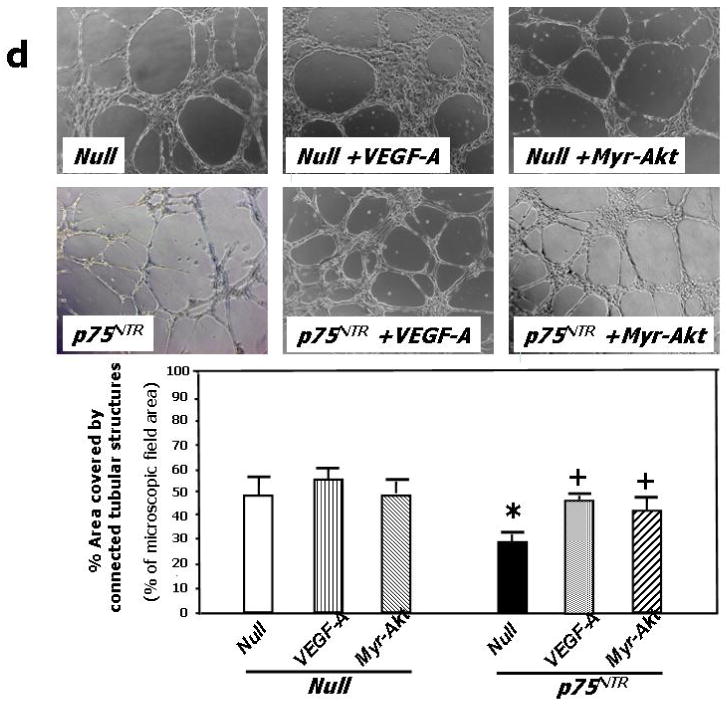
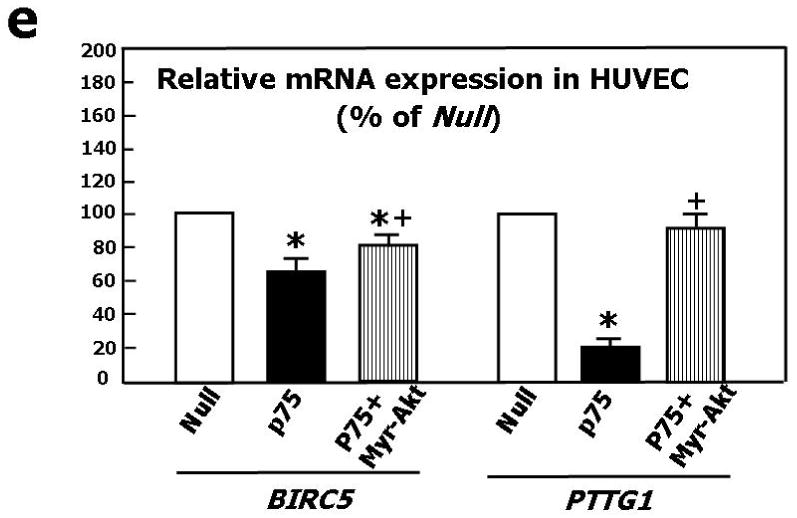
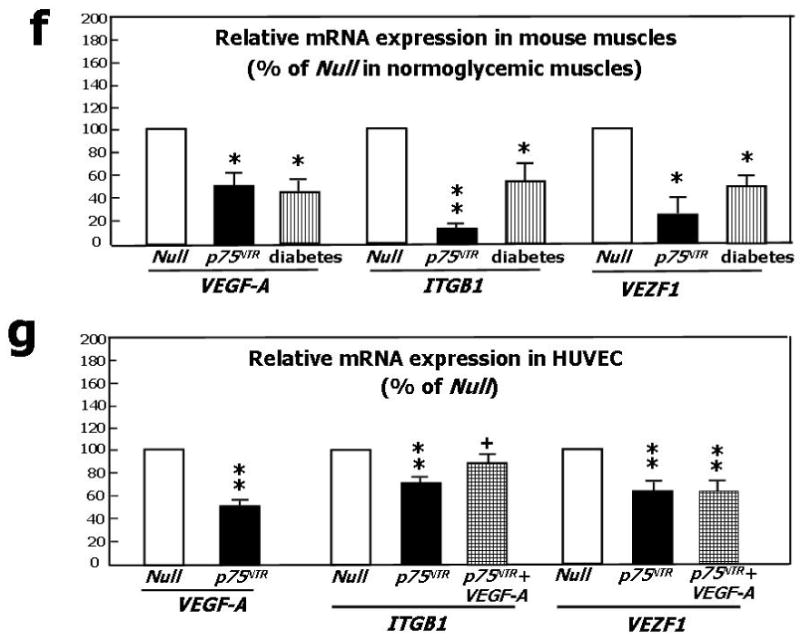
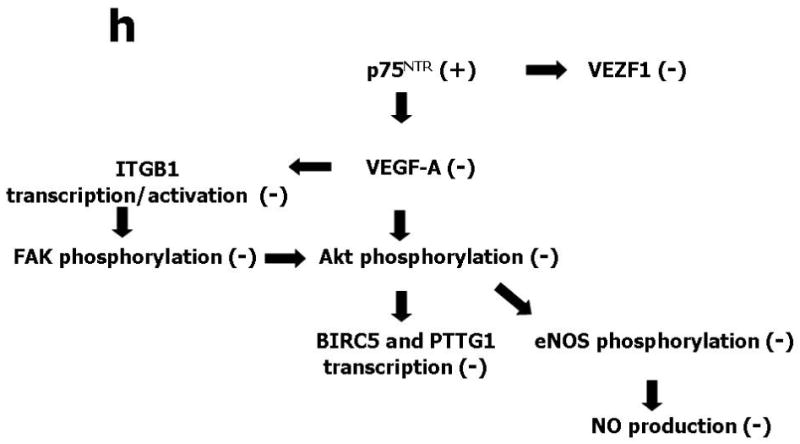
(a) Western blotting showing protein expression of VEGF-A, phospho-Akt, total Akt, phospho-eNOS, and total eNOS. GAPDH was used as loading control. HUVEC were infected with Ad.Null or Ad.p75NTR (100, 250, and 500 M.O.I.) and then lysated for western blotting. Bands are representative of three independent experiments. (b) HUVEC were infected with Ad.Null or Ad.p75NTR (250 M.O.I.). The release of NO was analyzed using the fluorescent probe DAF-2DA in the presence or absence of the eNOS preferential inhibitor L-NIO. FL1 fluorescence, emitted by DAF-2DA after reaction with NO, was determined by FACS. The bar graph shows the NOS-mediated FL1 mean fluorescence intensity after subtraction of eNOS-independent fluorescence emitted in presence of L-NIO. Representative histographs are shown on the right. Full curves are representative of NO release in the absence of L-NIO. Empty curves show NO release in the presence of L-NIO. Values in bar graph are means±SEM **P<0.01 vs. Ad.Null; (c) Left Panel: Protein expression of phospho-FAK, phospho-Akt, total Akt, phospo-eNOS, and total eNOS, in HUVEC infected with Ad.Null or Ad.p75NTR (each at 250 M.O.I.) plus Ad.VEGF-A or its control Ad.Null (each at 10 M.O.I.). GAPDH is used as a loading control. Bands are representative of three independent experiments. Right Panel: Protein expression of VEGF-A, phospho-FAK, total Akt, phospho-Akt, total eNOS, and phospo-eNOS in HUVEC infected with Ad.Null or Ad.p75NTR (each at 250 M.O.I.) plus Ad.Myr-Akt or its control Ad.Null (each at 100 M.O.I.). GAPDH is used as a loading control. Bands are representative of three independent experiments. (d) Both Ad.VEGF-A and Ad.Myr-Akt rescued tube formation capacity of p75NTR-transduced HUVEC. Cells were infected as described in (c) at 12h before being seeded in matrigel. Images were taken at 24h from seeding. Values in the quantification graph are means±SEM.* P<0.05 vs. Ad.Null plus Ad.Null, +P<0.05 vs. Ad.p75NTR plus Ad.Null. (e) Relative mRNA expression (determined by real-time RT-PCR, using RNA 18S as reference) of BIRC5 (survivin) and PTTG1 (securin) in p75NTR-HUVEC and Null-HUVEC. Co-infection with Myr-Akt enhanced BIRC5 and PTTG1 content of p75NTR-HUVEC. Values are means±SEM.* P<0.05 vs. Ad.Null, +P<0.05 vs. Ad.p75NTR. (f) Relative mRNA expression of VEGF-A, ITGB1, and VEZF1 in the adductor muscles of normoglycemic mice following its transduction with Null (Null) or p75NTR (p75NTR) and in Null-transduced diabetic limb muscles (diabetes). Values are means±SEM.*P<0.05 and **P<0.01 vs. Ad.Null in normoglycemic muscles. (g) Relative mRNA expression of VEGF-A, ITGB1, and VEZF1 in p75NTR-HUVEC and Null-HUVEC. Co-infection with VEGF-A rescued the mRNA level of ITGB1 but not of VEZF1 in p75NTR-HUVEC. Values are means±SEM.** P<0.01 vs. Ad.Null, +P<0.05 vs. Ad.p75NTR. (h) Schematic representation of the molecular signalling emanating from p75NTR in EC.
To investigate the role of depressed VEGF-A and phospho-Akt in the anti-angiogenic action of p75NTR, we performed a rescue experiment in the matrigel assay model. The capacity of p75NTR-HUVEC to form tubular structures was restored by either VEGF-A or Myr-Akt (Fig. 3d), suggesting that the anti-angiogenic action of p75NTR is caused by inhibition of the VEGF-A/Akt pathway.
p75NTR downregulates BIRC5 and PTTG1 mRNA levels in EC
To further understand the p75NTR-induced molecular program contributing to EC apoptosis and anti-angiogenesis, we performed a GeArray for apoptosis and cell cycle-related genes on mRNA extracted from p75NTR-HUVEC and Null-HUVEC. Results (not shown) were confirmed by real time RT-PCR. As shown in Fig. 3e, p75NTR reduced the mRNA expression of BIRC5 (survivin) and pituitary tumor-derived transforming gene (PTTG1, also named securin), which are pro-angiogenic and pro-EC survival mediators transcriptionally controlled by phospho-Akt.35,36 Accordingly, Myr-Akt increased BIRC5 and PTTG1 in p75NTR-HUVEC.
Expressional changes induced by p75NTR over-expression in limb muscles confirm the activation of an anti-angiogenesis program, which is also present in diabetic muscles
We previously found that p75NTR expression by capillary EC correlated with apoptosis and with reduced capillary density.3,37 Here, we have employed full genome expression profiling using Illumina bead-arrays interrogating 46,600 murine genome transcripts to study the global impact of p75NTR transduction on the gene expression program of normoperfused murine muscle. The overall changes in the transcriptome were analyzed at the levels of specific functional pathways using Panther-annotated protein group analysis.38 This analysis identified, in addition to a number of inflammatory or muscle-specific pathways (data not shown), a specific, statistically significant reduction in gene-sets involved in endothelial survival and angiogenesis processes, i.e. VEGF-signalling and integrin-signalling. Analysis of the corresponding genes in more detail identified 3 pivotal genes (VEGF-A, ITGBL1, VEZF1) that were suppressed by p75NTR, relative to a number of well-established endothelial-specific genes (data not shown). By real-time RT-PCR, we confirmed that p75NTR alters the expression of VEGF-A, ITGBL1 and VEZF1 in both murine muscles and HUVEC (Figs. 3f and 3g). Notably, muscular expression of VEGF-A, ITGBL1 and VEZF1 is dramatically down-regulated by diabetes (Fig. 3f). VEGF-A transfer corrected ITGB, but not VEZF1 deficit in p75NTR-HUVEC. The scheme in Fig 3h illustrates our interpretation of the molecular change induced by p75NTR in EC.
p75NTR impairs post-ischemic neovascularization and blood flow (BF) recovery in a mouse model of limb ischemia
To test the impact of p75NTR on blood vessel growth in ischemic limb muscles, Ad.p75NTR (V5-tagged) or Ad.Null was injected into the ischemic adductor of normoglycemic mice. We verified successful gene transfer by western blot analysis for p75NTR (Fig. 4a). By immunohistochemistry for V5 (red fluorescence), we observed localization of the transgene in capillary EC (recognized by FITC-isolectin staining –green fluorescence-) of the ischemic muscles (Fig. 4b). Limb BF was measured by colour laser Doppler at 0, 7, and 14d post-ischemia. A severe delay in BF recovery was observed in the p75NTR group (Fig. 4c for 14d post-ischemia; other data not shown). Correspondingly, capillary density was reduced in p75NTR-over-expressing muscles (Fig. 4d). In additional mice sacrificed at 5d post-ischemia, which, in comparison to 14d, is a time-point more informative on ischemia-induced EC proliferation and apoptosis, we observed that p75NTR induces apoptosis (Fig. 4e) and inhibits proliferation (Fig. 4f) of capillary EC. Interestingly, intramuscular Ad.p75NTR increased the abundance of apoptotic Sca-1+Lin- cells resident in the ipsilateral limb BM (Fig. 4g and 4e). Sca-1+Lin- represents a murine progenitor cell population able to give rise to EC.39,40 To determine whether Sca-1+Lin- cell apoptosis was associated with transgene expression in the BM, we searched for V5 in BM (by western blot), but we did not find it. To further investigate whether gene delivery to ischemic muscles can infect BM-resident cells, we injected muscles with Ad.GFP and, after 3d, we performed FACS analysis for GFP fluorescence of total BM cells. We did not detect any GFP fluorescence (data not shown). These experiments disclaim the possibility of p75NTR transduction of BM cells following intramuscular gene delivery.
Fig. 4. Forced p75NTR expression inhibits reparative neovascularisation in ischemic limb muscles.
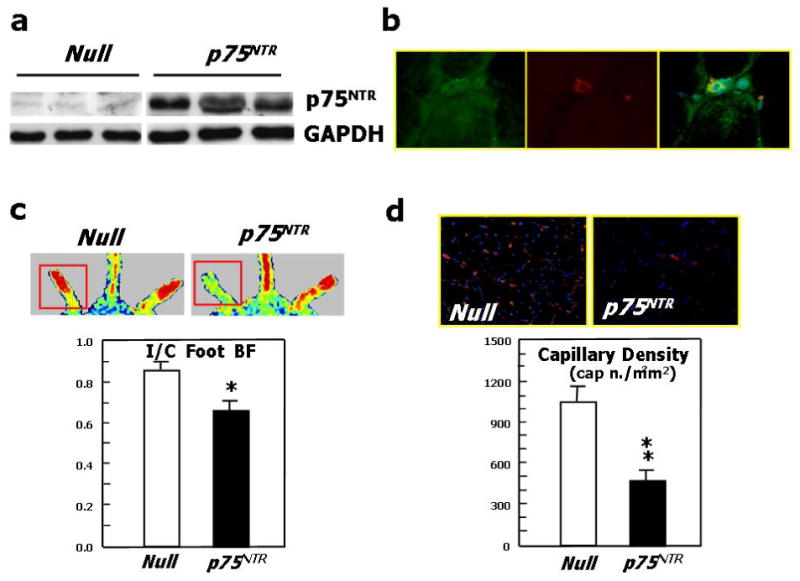
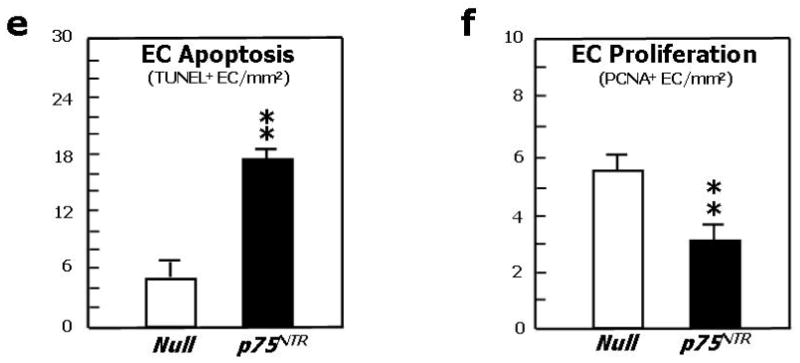

(a)Western blot analysis showing p75NTR expression by ischemic murine limb muscles previously infected with Ad.p75NTR (109 p.f.u.). (b) Staining of muscular section with an antibody for V5 (green fluorescence) and with the endothelial marker isolectin-B4 (red fluorescence) shows that muscular capillary EC express the transgene (yellow fluorescence, from merging) following infection of muscles with Ad.p75NTR (V-5 tagged). (c) Recovery of the blood flow (BF) to the ischemic foot (expressed as the ratio between BF in the ischemic to BF in the contra-lateral foot) at 14d after ischemia induction and intramuscular gene transfer with Ad.p75NTR or Ad.Null. Values are means±SEM. *P<0.05 vs. Ad.Null. Representative laser Doppler images taken at 14d post-ischemia induction are also shown. Squares include the area of interest, where blood perfusion was calculated. Color scale from blue to brown indicates progressive increases in BF; (d) Capillary density of ischemic adductor muscles of mice described in (c). Values are means±SEM. **P<0.01 vs. Ad.Null. Images in upper panels show muscles stained with isolectin B4 (red fluorescence) to recognize EC and counterstained with DAPI (blue fluorescence) to recognize nuclei; (e) Apoptosis (revealed by TUNEL assay) and (f) proliferation (revealed by immunhistochemistry for the proliferating cell antigen PCNA) of EC in limb muscles at 5d post-ischemia induction and gene transfer. Values are means±SEM. **P<0.01 vs. Ad.Null; (g) the percentage of BM-resident Sca-1+Lin-progenitor cells undergoing apoptosis (recognized by Annexin-V staining) increased in response to transduction of ischemic muscles with p75NTR. Values are means±SEM. *P<0.05 vs. Ad.Null; (h) Representative examples of FACS analyses are shown for BM-MNC taken from ischemic limbs previously infected with Ad.p75NTR or Ad.Null. First, monocytic cells were identified by size/granularity (left panel), followed by selection of Sca-1+Lin-cells (R2, central panel). Finally, the percentage of Annexin-V-positive cells was calculated (R4, right panel).
Diabetes increases p75NTR expression and apoptosis of BM-resident progenitor cells
Extending our previous findings of an association between diabetes, p75NTR expression and apoptosis in EC,3 we provide new evidence that – even in the absence of superimposed ischemia - diabetes increases the abundance of both Sca-1+p75NTR+ (Fig. 5a) and Sca-1+Lin- p75NTR+ cells (Fig. 5c) in limb BM. Diabetic Sca-1+p75NTR+ cells expressed the apoptosis marker Annexin-V (Fig. 5 d, e, f). These data suggest a role for p75NTR in diabetes-induced progenitor cell apoptosis.
Fig. 5. Diabetes increases p75NTR in BM progenitor cells.
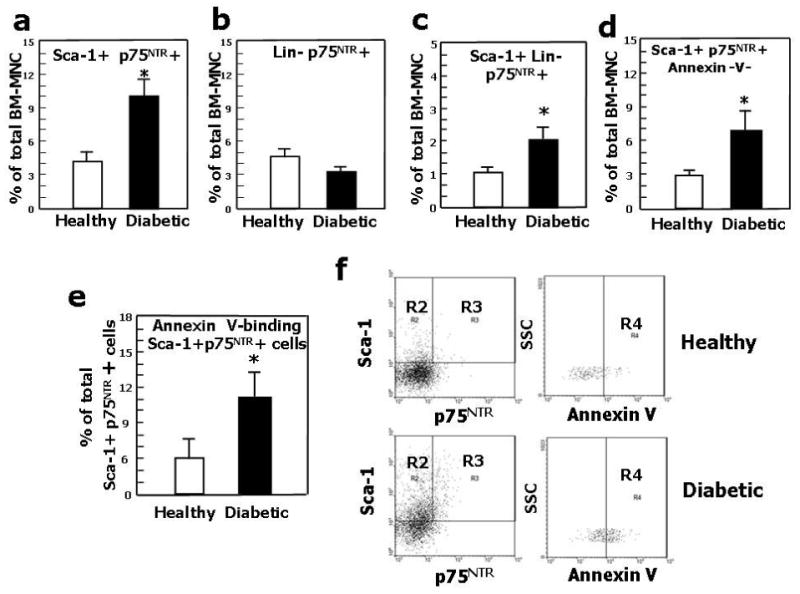
(a), (b), The percentage of BM-MNC co-expressing Sca-1 and p75NTR (a)increased in diabetic mice, while the percentage of BM-MNC Lin- cell expressing p75NTR (b) did not change. (c) The percentage of Sca-1+ Lin- p75NTR+ increased in diabetic BM-MNC. (d) The percentage of Sca-1+p75NTR+Annexin-V+ cells increased in diabetic BM-MNC. (e) The percentage of Sca-1+p75NTR+ cells undergoing apoptosis (recognized by Annexin-V staining) increased in the BM-MNC of diabetic mice. Values are means±SEM. *P<0.05 vs. healthy mice. (f) Identification of apoptotic cells (gate R4) among Sca-1+p75NTR+ (gate R3) BM-MNC. After selection of monocytic cells according to size and granularity (not shown) and further identification of Sca-1+p75NTR+ cells (left panel), positivity for Annexin-V was assessed (right panel) in cells derived from healthy or diabetic mice.
Blocking p75NTR re-establishes proper post-ischemic neovascularization and BF recovery in diabetic mice undergoing peripheral ischemia
We finally tested the hypothesis that p75NTR plays a major role in diabetes-induced impaired neovascularization response to limb ischemia. This was accomplished in diabetic mice by investigating whether blocking p75NTR, using an adenovirus carrying a dominant negative mutant form of p75NTR (Ad.DN-p75NTR), restores proper post-ischemic neovascularisation and BF recovery. Supplementary Fig. 2 confirms our previous data of increased p75NTR expression by capillary EC in ischemic muscles of diabetics in comparisons to normoglycemic mice.3 As shown in Fig. 6a, foot BF recovery overtime was impaired in diabetic mice receiving the control virus Ad.GFP. Ad.DN-p75NTR had no effect in normoglycemic mice, whereas it improved BF recovery in diabetic mice, making it comparable to that of normoglycemic controls. Representative Doppler images of hindlimbs at 15d post-ischemia are presented (Fig. 6b). We observed a similar trend when measuring intra-muscular BF (Fig. 6c). Additionally, post-ischemic clinical outcome (calculated as the number of auto-amputated or necrotic fingers in the ischemic foot)9,41 was worsened by diabetes. Notably, Ad.DN-p75NTR improved the clinical outcome of diabetic mice (number of necrotic/amputated fingers at 15d: 1.6±0.9 in diabetic with Ad.DN-p75NTR.vs. 3.7±0.9 in diabetic with Ad.GFP, P<0.05 and vs. 1.4±0.7 in healthy with Ad.GFP, P=N.S.). As shown in Fig. 6d, the capillarization response to ischemia was not altered by Ad.DN-p75NTR in normoglycemic mice. Diabetes impaired post-ischemic neovascularization, with this effect being prevented by Ad.DN-p75NTR. Furthermore, Ad.DN-p75NTR improved EC proliferation (assessed by MCM-2 staining42 -Fig 6e-) and inhibited EC apoptosis (TUNEL assay -Fig. 6f-) in diabetic muscles. Notably, intra-muscular Ad.DN-p75NTR reduced Sca-1+Lin- cell apoptosis in the diabetic BM (Fig. 6g and 6h).
Fig. 6. Inhibition of p75NTR signalling in diabetic limb muscles restores proper neovascularisation and BF recovery following limb ischemia.
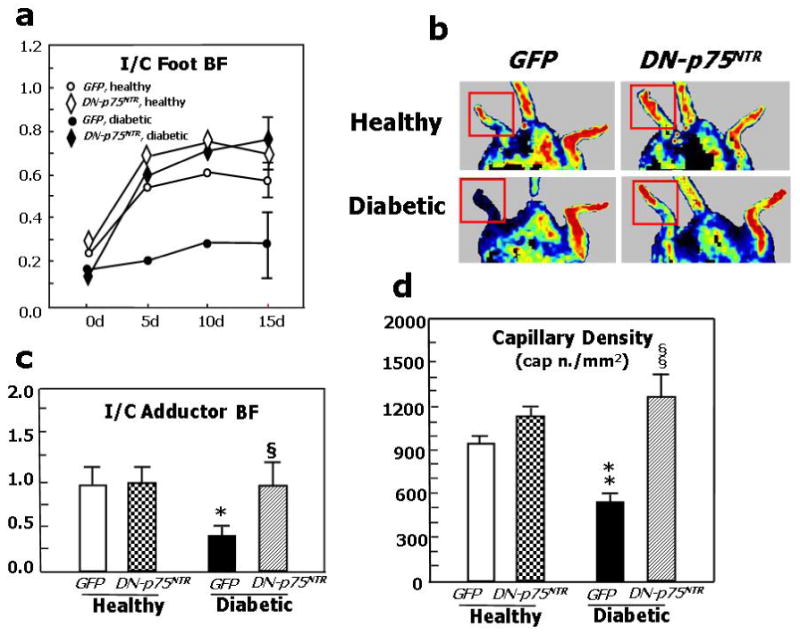
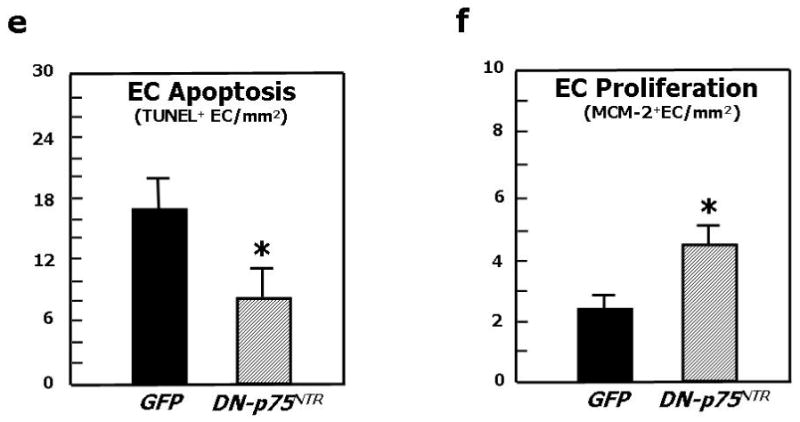
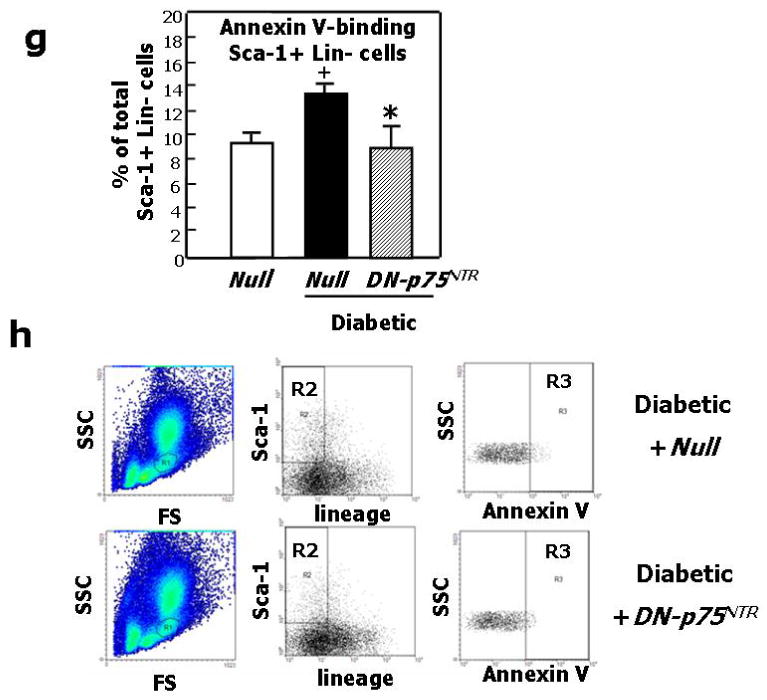
Unilateral limb ischemia was induced in diabetic and normoglycemic mice before an adenovirus carrying a dominant negative mutant of p75NTR (Ad.DN-p75NTR) or Ad.GFP was delivered to the ischemic adductor. (a) Time-course of post-ischemic BF recovery (calculated by laser colour doppler) in diabetics and normoglycemic mice treated with Ad.DN-p75NTR or Ad.GFP; (b) Representative laser Doppler images taken at 14d after induction of ischemia are shown. Squares include the area of interest; (c) Recovery of BF (measured by Oxford Optronic) to the ischemic adductor (expressed as the ration between BF in the ischemic to BF in the contra-lateral muscle) at 14d after ischemia induction. Values are mean±SEM. *P<0.05 vs. healthy with Ad.GFP, §P<0.05 versus diabetic with Ad.GFP. (d) Capillary density in the ischemic adductor at 14d post-ischemia. Values are means±SEM. **P<0.01 vs. healthy with Ad.GFP, §§P<0.05 vs. diabetic with Ad.GFP. (e) Apoptosis (revealed by TUNEL assay) and (f) proliferation (revealed by immunhistochemistry for the proliferation antigen MCM-2) of capillary EC in diabetic limb muscles at 14d post-ischemia induction. Values are means±SEM. *P<0.05 vs. Ad.GFP. (g) The percentage of BM-resident Sca-1+Lin- progenitor cells undergoing apoptosis (recognized by Annexin-V staining) is significantly reduced by intramuscular delivery of Ad.DN-p75NTR in diabetic mice. Values are means±SEM. +P<0.05 vs. healthy with Ad.Null.*P<0.05 vs. diabetic with Ad.Null. (h) Representative examples of FACS analyses of diabetic BM are shown. First, monocytic cells were identified by size/granularity (left panel), followed by selection of Sca-1+Lin- cells (R2, central panel). Finally, the percentage of cells positive for Annexin-V was calculated (R4, right panel).
Discussion
We previously showed and confirm here that diabetes induces p75NTR expression in capillary EC belonging to ischemic limb muscles3. With this study, we provide evidence that p75NTR induces apoptosis of EC and EPC and severely impairs their pro-angiogenesis function. The apoptotic and cell cycle inhibitor effects of p75NTR on neural cells were already known.20-22 In neural cells, p75NTR plays an ambiguous “Jekyll-and-Hyde” role, being able to either kill or stimulate cell survival and differentiation.21,22 By contrast, according to our findings, p75NTR has only detrimental actions on cells belonging to the endothelial lineage.
We have showed the strong anti-neovascularization effect of p75NTR in a mouse model of limb ischemia. In normoglycemic mice, p75NTR transduction of ischemic muscles enhanced apoptosis and reduced proliferation of capillary EC, thus ultimately depressing post-ischemic neovascularization and BF recovery. Interestingly, p75NTR transduction of muscles enhanced apoptosis of BM-resident Sca-1+Lin- progenitor cells. Since we were able to exclude the possibility that the transgene penetrated the BM, we are encouraged to speculate that the increase in apoptosis of BM-resident progenitor cell may be due to more severe limb ischemia following p75NTR over-expression.
Conclusive proof that p75NTR is responsible for diabetes-induced impaired reparative neovascularization is provided by the experiment in which p75NTR activity in ischemic limb muscles was blocked by a dominant negative p75NTR mutant form. Whilst the p75NTR dominant negative had no effects in normoglycemic mice, it inhibited EC apoptosis, normalized EC proliferation, and restored proper muscular capillarization and BF recovery in diabetic mice. Notably, blocking p75NTR in diabetic limb muscles additionally resulted in survival of BM-resident Sca-1+Lin- progenitor cells. This is in line with the observed increased apoptosis of BM cells following muscular p75NTR over-expression.
Overall, our in vivo findings have important clinical implications and may help to design innovative therapeutic approaches able to promote angiogenesis and vasculogenesis in a diabetic context.
Notably, the molecular signalling pathways that we identified to be downstream of p75NTR in EC totally differ from those previously described in neural cells. In fact, we newly report here that p75NTR inhibits the VEGF-A/Akt/eNOS/NO pathway. This is probably the most relevant pathway for angiogenesis and EC survival33,43 and its deficit may per se justify the impairment of EC function. In line with this hypothesis, co-transduction with either VEGF-A or Myr-Akt rescued the capacity of p75NTR-HUVEC to form vascular-like tubular structures on matrigel. Moreover, Myr-Akt improved survival of p75NTR-HUVEC (unpublished data, 2007). Phospho-Akt positively regulates the transcription of BIRC535 and PTTG1,36 which resulted in both being downregulated by p75NTR. Notably, Myr-Akt totally or partially rescued BIRC5 and PTTG1 mRNA expression levels in p75NTR-HUVEC. BIRC5, which was named survivin for its pro-survival action, was recently discovered to be a positive mediator of angiogenesis.35,44,45 Interestingly, BIRC5 also modulates cell cycle entry by interaction with Cdk4 and activation of Cdk2/Cyclin E complex leading to Rb phosphorylation.46 This may be reconciled with the impaired cell cycling capacity and reduced phospho-Rb levels observed in p75NTR-transduced HUVEC. PTTG1 was also reported to positively modulate angiogenesis.36,47
Illumina technology-based analysis of p75NTR-transduced murine muscles followed by real-time PCR of cultured HUVEC has identified that p75NTR downregulates the mRNA expression of ITGB1 and of the endothelial specific VEZF1 transcription factor, in vitro and in vivo. Notably, we also found down-regulated VEGF-A, ITGB1, and VEZF-1 in diabetic muscles, which in part confirms previous reports of VEGF-A reduction as cause of diabetes-induced impaired neovascularization in skeletal muscles and myocardium.1,4,48,49 Reduction in ITGB1 content may be explained by the p75NTR-induced decrease in VEGF-A. In fact, in microvascular EC, VEGF-A upregulates the mRNA expression and activity of alpha(6)beta(1) integrin, which in turn mediates VEGF-A driven angiogenesis.50 VEGF-A additionally binds to alpha(9)beta(1) integrin and this interaction is also essential for VEGF-A induced angiogenesis.51 In line with this observation, VEGF-A rescued ITGB1 level in p75NTR-HUVEC, once again suggesting that VEGF-A down-regulation plays an important role in orchestrating the molecular changes triggered by p75NTR in EC. The only outsider to this VEGF-A-based network seems to be VEZF1, whose impaired mRNA content was not corrected by VEGF-A in p75NTR-HUVEC. VEZF1 is a relatively scarcely explored transcription factor that was implicated in in utero vasculogenesis, post-natal angiogenesis, and EC survival.52-54 Our expressional data discount the control of VEZF1 by VEGF-A. It is also improbable that VEZF-1 lies upstream of VEGF-A, because the anti-angiogenic effect caused by knocking down VEZF1 expression was reportedly not corrected in the presence of VEGF-A.54 Further studies are necessary to define the role of decreased VEZF1 in diabetes-induced microvascular complications. Our interpretation of the coordinated changes induced by p75NTR in the molecular program of EC is summarized in Figure 3h. Because the importance of VEGF-A for the survival of neural cells has been established,55 VEGF-A reduction may be also involved in p75NTR-induced apoptosis of neural cells.56 This hypothesis should be validated by future studies.
We finally conclude that p75NTR over-expression is sufficient and necessary for altering angiogenesis in diabetes and becomes an obligatory target for therapy.
Methods
Cell cultures
HUVEC and MVEC were purchased from Cambrex (Belgium) and grown in EGM-2 medium (EBM-2 supplemented with EGM-2 SingleQuots, Cambrex) containing 5% FBS (Cambrex). HUVEC and MVEC were used between the second and the fifth passage in culture. Human endothelial progenitor cells (EPC) were enriched from peripheral blood of healthy volunteers: peripheral blood mononuclear cells (PB-MNC) were separated by density-gradient centrifugation (Histopaque 1077, Sigma), washed in phosphate buffered saline (PBS) and plated on fibronectin (10μg/ml, Sigma)-coated tissue culture plates in the EPC medium EGM-2MV (EBM-2 MV supplemented by EGM-2 MV SingleQuots, Cambrex) containing 10% FBS at a density of 1×10⁶ MNC per cm2. At day 4, non-adherent cells were removed and the adherent EPC were used for experiments.
Adenoviruses (Ad)
In order to prepare Ad. p75NTR, the complete coding sequence of human p75NTR was excised using EcoRI from a Bluescript plasmid (generous gift from Prof. Dario Marchetti, Louisiana State University, USA) and cloned in the adenovirus shuttle vector pDC515 (Microbix Biosystems, Canada) downstream of the mouse cytomegalovirus promoter. Replication-deficient adenoviruses were generated by site-specific FLP-mediated recombination of the cotransfected shuttle and genomic plasmids in 293 cells. Viral stocks were amplified, CsCl banded, and titrated as previously described.57 To add a C-terminal V5 tag, the complete coding sequence of p75NTR was amplified using KOD proofreading DNA polymerase (Novagen) to remove the stop codon. A perfect clone was excised and subcloned in a pDC515 shuttle vector containing the coding sequence of the V5 tag ready for adenovirus generation. Adenoviral vectors carrying human p75NTR (Ad. p75NTR) with or without a V5-tag were prepared. Ad-rad66 (empty vector, also called Ad.Null) was used as negative control. To prepare the Ad.DN-p75NTR, the regions containing the extracellular and transmembrane domains of rat p75NTR was subjected to PCR and cloned into TrackCMV vector and subsequently sequenced for any PCR errors. The recombinant adenovirus was generated using bacterial recombination according to He et al 58 A high titer virus was produced using CsCl gradients and the CsCl was removed by dialysis. Ad.VEGF-A and Ad.Myr-Akt expressing a constitutively active mutant form of Akt were previously used by us.12,26
in vitro gene transfer
In order to infect HUVEC, MVEC, or human EPC, Ad.VEGF-A and its control Ad.Null was used at 10 M.O.I. Ad.Myr-Akt and its control Ad.Null was used at 100 M.O.I. The other Ads were used at 100 to 500 M.O.I.
Western-Blot analyses
Proteins were extracted from cultured cells, muscles, or BM by using ice-cold buffer A (50mM Hepes, 150mM NaCl, 1mM EDTA, 1mM EGTA, 25mM NaF, 5mM NaPPi, 1%Triton, 1% NP40, 1 mM Na3VO4, 0,25% sodium deoxycholate, 0.5mM Na-orthovanadate, 1 mM benzamidine, 0.1mM phenylmethylsulfonyl fluoride) or ice-cold RIPA buffer. Protein concentration was determined using the Bio-Rad Protein Assay Reagent (Bio-Rad). Detection of proteins by Western blot analysis was done following separation of whole cell extracts (50μg) on SDS-polyacrylamide gels. Proteins were transferred to polyvinylidene difluoride membranes (PVDF, Amersham-Pharmacia) and probed with the following antibodies: anti mouse p75NTR (clone ME20.4, Upstate Biotechnology, 1:1000), Ser 1177-phospho-eNOS (Cell Signaling, 1:1000), eNOS (Santa Cruz Biotechnology, 1:500), VEGF-A (Santa Cruz Biotechnology, 1:2000), Ser473-phospho-Akt (Cell Signaling, 1:1000), Akt (Cell Signaling, 1:1000), phospho-Rb (Upstate Biotechnology, 1:500), p-FAK (pY397, Transduction Laboratories, 1:1000), cleaved-caspase-3 (Cell Signaling, 1:1000), V5 (Novus Biological, 1:1000). GADPH (R&D System, 1:2000) was used as loading control. For detection, secondary antibody goat anti rabbit or anti mouse conjugated to horseradish peroxidase (Amersham Pharmacia, 1:5000) were used, followed by chemiluminescence reaction (ECL, Amersham Pharmacia).
FACS analysis of HUVEC for p75NTR, Annexin-V, and PI
Surface antigen expression by HUVEC was analyzed by flow cytometry using combinations of phycoerythrin (PE)-conjugated mouse anti-human p75NTR and FITC-conjugated Annexin-V antibodies (both from BD Bioscience Pharmigen (BD)). Cells were also stained with PI. Unstained and single staining controls were performed to define positivity. Data were obtained on a FACS Calibur flow cytometer (BD) and analyzed using WinMDI (Purdue University, West Lafayette, USA). Cell numbers are expressed as percent of HUVEC. The experiment was performed in triplicate and repeated 3 times.
Caspase-Glo assay
HUVEC (7×10³/well) and EPC (3×10⁴/well) were seeded in flat bottomed 96-well plates and infected with Ad.Null or Ad.p75NTR (each at 100, 250, and 500 M.O.I.). Caspase-3 activity was measured by using a luminescent cell death detection kit (Caspase-Glo Assay, Promega), according to the instruction of the manufacturer. The apoptosis inducer staurosporin (1μM, for 4h) was used as a positive control of apoptotic death. The Caspase-Glo assay was also used to assess the effect of proNGF (5ng/mL, a concentration which was found to induce apoptosis of p75NTR-expressing EC,17 Alomone), NGF (100ng/mL, Upstate), BDNF (100ng/mL, Upstate), soluble trkB receptor (used at 4ng/mL to block endogenous BDNF activity, R&D Systems),17 and a goat-raised NGF neutralizing antibody (kindly donated by Dr. Luigi Aloe, CNR, Rome, Italy).3,19 PBS and 0.01% non immune goat serum were used for controls in these experiements.19 Each experiment was performed in triplicate and repeated at least 3 times.
TUNEL apoptosis assay of HUVEC and EPC
HUVEC or EPC were seeded (1.5×10⁴/well) on gelatine and fibronectin-coated Labtek™ slides (Nalge Nunc Int.) and infected with Ad.Null or Ad.p75NTR overnight. After 48h, cells were fixed with 4% paraformaldehyde. TUNEL assay was performed according to the manufacturer's instructions (Calbiochem). Nuclei were counterstained with DAPI. At least 500 cells (in eight randomly captured microscopic fields at 400× magnification) were scored in a blinded fashion to calculate the percentage of TUNEL-positive nuclei. Data are expressed as the average percentage of apoptotic nuclei. The experiment was performed in triplicate and repeated 3 times.
Flow cytometry analysis of apoptotic microparticles
Endothelial microparticles (EMP) were collected from the conditioned culture medium of HUVEC by two centrifugation steps (1500 × g for 15 min, followed by 20500 × g for 5 min) and stored and at -80°C. Then, EMP were numbered by flow cytometry analysis as AnnexinV-positive microparticles, as described.59 Analyses were performed using PE-conjugated mouse anti-human p75NTR antibody and its corresponding isotype control provided by BD. EMP (20μL) were incubated with 20μL of antibody for 30min in the dark. EMP were then analysed on a Beckman-Coulter EPICS XL flow cytometer in the presence of Flowcount calibrator beads. EMP gate was defined as events with a 0.1-1μm diameter and examined on a fluorescence/forward light scatter plot. The experiment was repeated 3 times.
Cell cycle analysis
HUVEC were infected with Ad.p75NTR or Ad.Null (150 M.O.I.) and then synchronized by serum deprivation (0.1% FBS) for 16h. Next, cells were washed twice with PBS, released in complete medium, and harvested at different time points (indicated in Fig. 2a). After fixation in 70% ethanol and RNase A (100μg/ml, Sigma) treatment for 1h at 37°C, cells were stained with PI (50μg/ml, Sigma) on ice in the dark for 30min. DNA content was analyzed by flow cytometric analysis (Becton Dickinson FACScan, San Jose California) and quantification was performed by using the software Modfit LT for MAC version 2.0 (from Verity Software house, Topsham, Maine, USA). The experiment was repeated 3 times.
BrdU incorporation
HUVEC (5×10³/well) were seeded in a 96-well plate and infected overnight (in EBM2 supplemented with 0.1% FBS) with Ad.Null or Ad.p75NTR (250 M.O.I.). Then, the medium was replaced with complete EGM2 added with BrdU (10μM) for 24h. BrdU incorporation by HUVEC was measured by using a BrdU immunofluorescence assay kit from Roche, according to the manufacturer's instructions. Briefly, HUVEC were fixed and made permeable with FixDenat solution for 1h, then incubated with monoclonal anti-BrdU peroxidase-conjugated antibody (anti-BrdU-POD) for 90min. Bound anti-BrdU-POD was detected by a substrate reaction, then quantified by an ELISA plate reader. Each experiment was performed using 6 wells per group and repeated 3 times.
EPC were plated in a 6-well plate and infected with Ad.Null or Ad. p75NTR (500 M.O.I.) in EBM2 with 0.1% FBS overnight. Then, the medium was changed in complete EGM2 containing BrdU (10μM) for 72h and the incorporation of BrdU by EPC was measured by FACS. Briefly, EPC were trypsinized, washed with PBS, and fixed with 70% ethanol on ice for 30min. Then, DNA was denaturated in 2N HCl with 0.5% Triton X-100 for 30min at room temperature and neutralized in 0.1M Na2B4O7, pH 8.5. Cells were finally incubated with monoclonal anti-BrdU antibody (Dako, 1:100) for 1h at room temperature, centrifuged, washed, stained with FITC-conjugated secondary for 30min and read at a FACS Calibur (Becton Dickinson). Evaluation was performed blind. Data were analyzed using CellQuest software (Becton Dickinson). Each experiment was performed in triplicates and repeated 3 times.
Migration assay
The migratory function of p75NTR or Null-transduced HUVEC and EPC was evaluated (at 12h and 48h from gene transfer) by using fibronectin-coated (10μg/ml, Sigma) 24-well-plate transwell migration inserts (Corning, Artington, UK) with a polycarbonate membrane of 8-μm (HUVEC) or 5-μm (EPC) pore size. Briefly, cells were trypsinized and resuspended in EBM-2 containing 0.1% bovine serum albumin (BSA, Sigma). Cells (0.5×10⁵) were placed in the upper chamber, while EBM-2 containing 0.1% BSA and human recombinant SDF-1 (100ng/mL) was placed in the lower chamber. To control for spontaneous migration (negative control), EBM-2 with 0.1% BSA was used in the lower chamber. Cells were incubated in a humidified incubator at 37°C for 5h (HUVEC) or overnight (EPC). Non-migrated cells were removed by gently wiping the upper surface of the membrane with a cotton swab. Membranes were fixed in methanol, excised with a scalpel and mounted on microscope slides with mounting medium containing DAPI (Vectashield, Vector Technologies). Level of migration was assessed by counting the number of cells present on the lower surface of the membrane in 8 randomly captured fluorescence microscopic view fields (magnification 200X). Evaluation was performed blind. Each experiment was performed in triplicate and repeated 3 times.
Adhesion assay
Ninety-six-well tissue culture plates were coated for 1h with fibronectin (10μg/ml in PBS) and then blocked for 1h at 37°C with 1% BSA in PBS and washed 3 times with PBS before cell seeding. At 12h and 48h from infection with Ad.p75NTR or Ad.Null (250 M.O.I. for HUVEC, 500 M.O.I. for EPC), transduced HUVEC (15×103/well) or EPC (20×103/well) were seeded in EGM2 with 10% FCS and incubated at 37°C. One hour later, non-adherent cells were discarded by washing 3 times and adherent cells were fixed (10 % formalin in PBS, pH 7.4 for 10min at room temperature) and stained with DAPI (2.5μg/ml, Sigma,) for 10min in the dark. Plates were then rinsed extensively with water and cell adhesion was quantified by counting adherent cells (magnification 200×). Evaluation was performed blind. Each experiment was performed in triplicate and repeated 3 times.
Matrigel assay
HUVEC (105 cell/well) were infected with Ad.p75NTR or Ad.Null (250 M.O.I.) and, after 12h or 24h, seeded in 24-well plates coated with 300 μL of Matrigel supplemented with growth factors (Becton Dickinson). For rescue experiments with VEGF-A and Myr-Akt, cells were co-infected with Ad.p75NTR or Ad.Null (250 M.O.I.) plus either 10 M.O.I. of Ad.VEGF-A or its control Ad.Null or 100 M.O.I. of Ad.Myr-Akt or its control Ad.Null. Plates were incubated at 37°C and photographed at different times from seeding. Capillary-like structure formation was examined under an inverted phase photomicroscope. Tube formation was quantified by counting the number of intersection points in randomly captured microscopic fields and/or by calculating the % microscopic field area covered by connected tubular structures (magnification 100×). Evaluation was performed blind. Each experiment was performed in triplicate and repeated 3 times.
NO generation assay
NO generation was assessed in p75NTR-HUVEC and Null-HUVEC. Briefly, transduced HUVEC were detached by trypsinization and divided into four groups with n=4 replicates containing 2×10⁵ cells. Samples were pre-incubated in sample buffer (200 mM Tris-HCl, 10mM CaCl2, 10mM MgCl2, 1.33mM NaCl, 65mM KCl, 5mM D-glucose, 0.1% BSA and 50μM L-arginine (all Sigma). To the p75NTRL-NIO and NullL-NIO groups, the NOS inhibitor L-N5-(1-Iminoethyl)ornithine (L-NIO, 100μM, Merck, UK) was added for 10min whereas the other two groups remained without inhibitor. DAF-2DA (5μM; Invitrogen, UK) was added to all samples and incubated in the dark for 3h at 37°C. Cells were washed with sample buffer and immediately FL1 fluorescence was determined in a FACS Calibur flow cytometer (BD). FL1 mean fluorescence intensity was calculated and unspecific fluorescence remaining after NOS inhibition by L-NIO was subtracted from uninhibited FL1 fluorescence intensity to obtain NOS specific DAF fluorescence values reflecting NO generation.
Gene transfer to murine muscles
Anaesthetized mice received 3 adenovirus injections (for a total of 109p.f.u. virus in 20μL) into 3 equidistant sites of the normoperfused or ischemic left adductor muscles. When desired, ischemia was induced (vide infra) immediately before gene transfer.
Illumina beadarray gene expression profiling
RNA samples from Null and p75NTR infected murine muscle were amplified and biotinylated using the Illumina TotalPrep RNA amplification Kit (Ambion, Austin, TX). Eight samples that passed quality control were randomly allocated to Sentrix Mouse-6 Expression bead chip arrays (Illumina, San Diego, CA), interrogating 46,600 transcripts from the mouse genome. Samples were hybridized to the beadchip arrays, followed by scanning and feature extraction, all performed at ServiceXS (Leiden, The Netherlands). Array data were extracted using Illumina BeadStudio software. Normalization and statistical analysis of the bead summary data from the arrays was carried out using the limma package 5 in R/Bioconductor (www.bioconductor.org). Bead summary intensities were normalized using quantile normalization and differential expression between the treatments of interest was assessed using a moderated t-test.60 This test is similar to a standard t-test for each probe except that the standard errors are moderated across genes to ensure more stable inference for each gene using Baysian statistics. Genes were considered significant if the P values, adjusted for multiple testing by using Benjamini and Hochberg's method,61 were <0.05. The false discovery rate was thereby controlled to be <5%. Differential modulation of specific pathways was assessed using the Panther-annotated protein group expression statistical analysis.62 Micro-array expression data are available at the NCBI Gene Expression Omnibus (GEO) (http://www.ncbi.nlm.nih.gov/project/geo) under accession number GSE9910.
GEArray
Human GEArray kit (SuperArray Inc., Bethesda, MD, USA), composed of 113 genes connected to the p53 signaling pathway and two housekeeping genes (actin and GADPH), was used to characterize gene expression profile of HUVEC cells infected with Ad.p75NTR or Ad.Nul (250 M.O.I.). Total RNA was isolated from cells by RNeasy isolation kit (Qiagen, Crawley, UK). cRNA probes for array analysis were synthesized following the manufacturer's directions. Differential gene expression patterns were detected by autoradiography. The experiment was performed in triplicate and data were confirmed by real-time quantitative PCR.
Real-time quantitative RT-PCR
Total RNA was isolated from HUVEC and murine muscles (RNeasy, Qiagen, UK) and RNA quality confirmed using the RNA Nano LabChip in a bioanalyzer (Agilent). RNA was reverse transcribed (Sensiscript reverse transcriptase, Qiagen) and quantitative PCR was performed in a LightCycler (Roche, Burgess Hill, UK) using the following primers: 18s rRNA (forward: 5′- TAGAGGGACAAGTGGCGTTC -3′, reverse: 5′- TGTACAAAGGGCAGGGACTT- 3′), murine VEGF-A (forward: GGAGATCCTTCGAGGAGCACTT, reverse: GGCGATTTAGCAGCAGATATAAGAA), human VEGF-A (forward: CTACCTCCACCATGCCAAGTG, reverse: GATGATTCTGCCCTCCTCCTT), human BIRC5 (forward: TCCGGTTGCGCTTTCCT, reverse: TCTTCTTATTGTTGGTTTCCTT), human PTTG1 (forward: CGGCTGTTAAGACCTGCAATA, reverse: TTCAGCCCATCCTTAGCAACC), mouse ITGB1 (forward: CGTGGTTGCCGGAATTGTTC, reverse: ACCAGCTTTACGTCCATAGTTTG), human ITGB1 (forward: AAGCTTTTAATGATAATTCATGACAG, reverse: GCCACTTTGCTTTTTGGATG), murine VEZF1 (forward: CAGCAGCCGAACTTCGTTG, reverse: CAGGCTTACTGGGTTTCTTGAC), human VEZF1 (forward: GACAGCAGCCGAACTTCGTT, reverse: TGCCCGAGGAAGATGTAGTGA), human p75NTR (forward: GTGGGCCTTGTGGCCTAC, reverse: TGTGGCCTACATAGCCTTC). The analyses were performed on at least 4 samples per time and repeated three times.
Limb ischemia and diabetes models
Left limb ischemia was induced in anaesthetized CD1 male mice, as described.3,9,12,41 Type-1 diabetes was induced by streptozotocin, as also described.63 Diabetic mice did not received insulin and were studied between 1 and 3 months from diabetes onset. In all experiments, normoglycemic controls were age-and gender-matched.
Clinical outcome from ischemia and BF measurements
Following limb ischemia induction, we evaluated the toe and foot necrosis event, as described.9,10,41 Superficial BF of the ischemic and contralateral foot was analyzed at different time-points from ischemia induction by color laser Doppler (Lisca Perimed, Sweden) and the ratio between BF in the ischemic foot and BF in controlateral foot was calculated and used as an index of % BF recovery.3,9,10,12,41 Intra-muscular BF was measured by Oxylite/Oxyflow (Oxford Optronic, Oxford, UK) by inserting a probe in the adductor muscle of anaesthetized mice.26 The number of auto-amputated or necrotic fingers in the ischemic foot was calculated, as previously explained.9,41 A minimum of n=12 mice per group were studied.
Capillary density
Capillary density was determined on H&E-stained transverse sections of adductor muscles (observed at 1000X magnification) by the aid of an ocular graticule, as previously described.3,9,10,12,41 and in fluorescent sections stained for isolectin B4 (red fluorescence) (Molecular Porbes) to identify EC and with DAPI (blue fluorescence) (Sigma Aldrich) to identify nuclei. A minimum of n=6 muscles per each group were used for these analyses.
Apoptosis and proliferation in muscles
Apoptosis was recognized by TUNEL assay, as previously described.3,9,10,12,41 Cell proliferation was recognized by IHC for either the proliferation cell nuclear antigen (PCNA) or the mini-chromosome maintenance protein 2 (MCM2), a marker of cycling cells, as also previously published.26,42 Additional sections were triple stained for either TUNEL, isolectin B4, and DAPI or PCNA, isolectin B4, and DAPI. A minimum of n=6 muscles per each group were used for these analyses.
Other immunohistochemical analyses of muscular sections
Following the delivery of V5-tagged Ad.p75NTR to adductor muscles, transgene expression by capillary EC was evaluated by staining paraffin-embedded adductor sections with a FITC-conjugated primary antibody recognizing V5 (Novus Biological, 1:200) and EC by Alexa 568-conjugated isolectinB4 (Molecular Probe, 1:200). In a separate experiment, expression of endogenous mouse p75NTR by EC was analyzed by co-staining adductor sections with a FITC-conjugated primary antibody recognizing mouse p75NTR (Calbiochem, 1:200)and Alexa 568-conjugated isolectinB4.
FACS analyses of bone marrow
BM-MNC were obtained from the left leg of freshly killed CD1 mice, as described previously.64 Briefly, tibiae and femora were flushed with DMEM (Cambrex) containing 5% FCS (Biochrom, Berlin, Germany). Cells were separated and passed through a 70μm cell strainer (BD, Oxford, UK). Single cell suspensions were centrifuged on Histopaque 1083 (Sigma) to obtain MNC. Surface antigen expression of MNC was analyzed by flow cytometry using combinations of PE-labelled anti-Sca-1 (BD), FITC-labelled anti-lineage markers-Alexa 488 (Caltag), FITC-labelled or biotynilated Annexin-V (BD), and Cy5 labeled-p75NTR (Advance Targeting System, CA, USA) together with PE- or FITC-labelled anti-rabbit secondary antibody (Sigma Aldrich) (all monoclonal). Unstained and staining controls for single colors and secondary antibodies were performed to define positivity. Data were obtained on a FACS Calibur flow cytometer (BD) and analyzed using WinMDI (Purdue University, West Lafayette, USA). Cell numbers are expressed as percent of a sub-population as specified. A minimum of n=6 mice per group were used for these analyses.
FACS for GFP fluorescence of BM cells
Anaesthetized normoglycemic and diabetic mice received 3 injections of Ad.GFP (for a total of 109p.f.u. in 20μL) into 3 equidistant sites of the ischemic left adductor muscles. After 3d, BM-MNC were obtained from both legs of freshly killed CD1 mice. The presence of green fluorescent BM-MNC was determined by FACS Calibur flow cytometer (BD). A minimum of n=5 mice per group were used for these analyses.
Statistical analysis
All results are expressed as the mean±SEM. Statistical analysis was performed via a t-test when two groups were analyzed, or via an ANOVA, followed by a Bonferroni post hoc test for multiple comparisons. A P value of <0.05 was taken as statistically significant. The statistical analysis used for Illumina data is described above.
Supplementary Material
Acknowledgments
This study was supported by the British Heart Foundation (BHF) through the project grant RFLS.RJ4769 to Dr Emanueli and by the European community FP6 through the European Vascular Genomic Network of Excellence (EVGN). Dr Emanueli holds a BHF Basic Science Lectureship (RFLS.RJ4430) and Andrea Caporali is a BHF PhD student (RFLS.SM6266). The laboratories from the Bristol Heart Institute, the University of Amsterdam, and INSERM are partners in EVGN. We thank Dr. Mark Bond (Vascular Biology, Bristol Heart Institute) for important suggestions and gift of reagents, Miss Jill Tartlan (Molecular Biology Facility, Bristol Heart Institute) for technical help, and Dr. Elinor Griffiths (Department of Biochemistry, Bristol Heart Institute) for critical revision and editing of the manuscript.
Bibliography
- 1.Yoon YS, et al. Progressive attenuation of myocardial vascular endothelial growth factor expression is a seminal event in diabetic cardiomyopathy: restoration of microvascular homeostasis and recovery of cardiac function in diabetic cardiomyopathy after replenishment of local vascular endothelial growth factor. Circulation. 2005;111:2073–85. doi: 10.1161/01.CIR.0000162472.52990.36. [DOI] [PubMed] [Google Scholar]
- 2.Tepper OM, et al. Human endothelial progenitor cells from type II diabetics exhibit impaired proliferation, adhesion, and incorporation into vascular structures. Circulation. 2002;106:2781–6. doi: 10.1161/01.cir.0000039526.42991.93. [DOI] [PubMed] [Google Scholar]
- 3.Salis MB, et al. Nerve growth factor supplementation reverses the impairment, induced by Type 1 diabetes, of hindlimb post-ischaemic recovery in mice. Diabetologia. 2004;47:1055–63. doi: 10.1007/s00125-004-1424-5. [DOI] [PubMed] [Google Scholar]
- 4.Rivard A, et al. Rescue of diabetes-related impairment of angiogenesis by intramuscular gene therapy with adeno-VEGF. Am J Pathol. 1999;154:355–63. doi: 10.1016/S0002-9440(10)65282-0. [DOI] [PMC free article] [PubMed] [Google Scholar]
- 5.Loomans CJ, et al. Endothelial progenitor cell dysfunction: a novel concept in the pathogenesis of vascular complications of type 1 diabetes. Diabetes. 2004;53:195–9. doi: 10.2337/diabetes.53.1.195. [DOI] [PubMed] [Google Scholar]
- 6.Krankel N, et al. Hyperglycemia reduces survival and impairs function of circulating blood-derived progenitor cells. Arterioscler Thromb Vasc Biol. 2005;25:698–703. doi: 10.1161/01.ATV.0000156401.04325.8f. [DOI] [PubMed] [Google Scholar]
- 7.Ingram DA, et al. In Vitro Hyperglycemia or a Diabetic Intrauterine Environment Reduces Neonatal Endothelial Colony Forming Cell Numbers and Function. Diabetes. 2007 doi: 10.2337/db07-1507. [DOI] [PubMed] [Google Scholar]
- 8.Gallagher KA, et al. Diabetic impairments in NO-mediated endothelial progenitor cell mobilization and homing are reversed by hyperoxia and SDF-1 alpha. J Clin Invest. 2007;117:1249–59. doi: 10.1172/JCI29710. [DOI] [PMC free article] [PubMed] [Google Scholar]
- 9.Gadau S, et al. Benfotiamine accelerates the healing of ischaemic diabetic limbs in mice through protein kinase B/Akt-mediated potentiation of angiogenesis and inhibition of apoptosis. Diabetologia. 2006;49:405–20. doi: 10.1007/s00125-005-0103-5. [DOI] [PubMed] [Google Scholar]
- 10.Emanueli C, et al. Nitropravastatin stimulates reparative neovascularisation and improves recovery from limb Ischaemia in type-1 diabetic mice. Br J Pharmacol. 2007;150:873–82. doi: 10.1038/sj.bjp.0707142. [DOI] [PMC free article] [PubMed] [Google Scholar]
- 11.Emanueli C, et al. Prophylactic gene therapy with human tissue kallikrein ameliorates limb ischemia recovery in type 1 diabetic mice. Diabetes. 2004;53:1096–103. doi: 10.2337/diabetes.53.4.1096. [DOI] [PubMed] [Google Scholar]
- 12.Emanueli C, et al. Type-2 diabetic Lepr(db/db) mice show a defective microvascular phenotype under basal conditions and an impaired response to angiogenesis gene therapy in the setting of limb ischemia. Front Biosci. 2007;12:2003–12. doi: 10.2741/2205. [DOI] [PubMed] [Google Scholar]
- 13.Brem H, Tomic-Canic M. Cellular and molecular basis of wound healing in diabetes. J Clin Invest. 2007;117:1219–22. doi: 10.1172/JCI32169. [DOI] [PMC free article] [PubMed] [Google Scholar]
- 14.Jeffcoate WJ, Harding KG. Diabetic foot ulcers. Lancet. 2003;361:1545–51. doi: 10.1016/S0140-6736(03)13169-8. [DOI] [PubMed] [Google Scholar]
- 15.Emanueli C, et al. Nerve growth factor promotes angiogenesis and arteriogenesis in ischemic hindlimbs. Circulation. 2002;106:2257–62. doi: 10.1161/01.cir.0000033971.56802.c5. [DOI] [PubMed] [Google Scholar]
- 16.Cantarella G, et al. Nerve growth factor-endothelial cell interaction leads to angiogenesis in vitro and in vivo. Faseb J. 2002;16:1307–9. doi: 10.1096/fj.01-1000fje. [DOI] [PubMed] [Google Scholar]
- 17.Kim H, Li Q, Hempstead BL, Madri JA. Paracrine and autocrine functions of brain-derived neurotrophic factor (BDNF) and nerve growth factor (NGF) in brain-derived endothelial cells. J Biol Chem. 2004;279:33538–46. doi: 10.1074/jbc.M404115200. [DOI] [PubMed] [Google Scholar]
- 18.Kermani P, et al. Neurotrophins promote revascularization by local recruitment of TrkB+ endothelial cells and systemic mobilization of hematopoietic progenitors. J Clin Invest. 2005;115:653–63. doi: 10.1172/JCI200522655. [DOI] [PMC free article] [PubMed] [Google Scholar]
- 19.Caporali A, et al. Identification of the prosurvival activity of nerve growth factor on cardiac myocytes. Cell Death Differ. 2007 doi: 10.1038/sj.cdd.4402263. [DOI] [PMC free article] [PubMed] [Google Scholar]
- 20.Lopez-Sanchez N, Frade JM. Control of the cell cycle by neurotrophins: lessons from the p75 neurotrophin receptor. Histol Histopathol. 2002;17:1227–37. doi: 10.14670/HH-17.1227. [DOI] [PubMed] [Google Scholar]
- 21.Ibanez CF. Jekyll-Hyde neurotrophins: the story of proNGF. Trends Neurosci. 2002;25:284–6. doi: 10.1016/s0166-2236(02)02169-0. [DOI] [PubMed] [Google Scholar]
- 22.Reichardt LF. Neurotrophin-regulated signalling pathways. Philos Trans R Soc Lond B Biol Sci. 2006;361:1545–64. doi: 10.1098/rstb.2006.1894. [DOI] [PMC free article] [PubMed] [Google Scholar]
- 23.Lee R, Kermani P, Teng KK, Hempstead BL. Regulation of cell survival by secreted proneurotrophins. Science. 2001;294:1945–8. doi: 10.1126/science.1065057. [DOI] [PubMed] [Google Scholar]
- 24.Nykjaer A, et al. Sortilin is essential for proNGF-induced neuronal cell death. Nature. 2004;427:843–8. doi: 10.1038/nature02319. [DOI] [PubMed] [Google Scholar]
- 25.Kenchappa RS, et al. Ligand-dependent cleavage of the P75 neurotrophin receptor is necessary for NRIF nuclear translocation and apoptosis in sympathetic neurons. Neuron. 2006;50:219–32. doi: 10.1016/j.neuron.2006.03.011. [DOI] [PubMed] [Google Scholar]
- 26.Emanueli C, et al. Akt/protein kinase B and endothelial nitric oxide synthase mediate muscular neovascularization induced by tissue kallikrein gene transfer. Circulation. 2004;110:1638–44. doi: 10.1161/01.CIR.0000142051.36244.83. [DOI] [PubMed] [Google Scholar]
- 27.Boulanger CM, Amabile N, Tedgui A. Circulating microparticles: a potential prognostic marker for atherosclerotic vascular disease. Hypertension. 2006;48:180–6. doi: 10.1161/01.HYP.0000231507.00962.b5. [DOI] [PubMed] [Google Scholar]
- 28.Koga H, et al. Elevated levels of VE-cadherin-positive endothelial microparticles in patients with type 2 diabetes mellitus and coronary artery disease. J Am Coll Cardiol. 2005;45:1622–30. doi: 10.1016/j.jacc.2005.02.047. [DOI] [PubMed] [Google Scholar]
- 29.Tushuizen ME, et al. Elevated endothelial microparticles following consecutive meals are associated with vascular endothelial dysfunction in type 2 diabetes. Diabetes Care. 2007;30:728–30. doi: 10.2337/dc06-1473. [DOI] [PubMed] [Google Scholar]
- 30.Knudsen ES, Wang JY. Differential regulation of retinoblastoma protein function by specific Cdk phosphorylation sites. J Biol Chem. 1996;271:8313–20. doi: 10.1074/jbc.271.14.8313. [DOI] [PubMed] [Google Scholar]
- 31.Urbich C, et al. Soluble factors released by endothelial progenitor cells promote migration of endothelial cells and cardiac resident progenitor cells. J Mol Cell Cardiol. 2005;39:733–42. doi: 10.1016/j.yjmcc.2005.07.003. [DOI] [PubMed] [Google Scholar]
- 32.Deshane J, et al. Stromal cell-derived factor 1 promotes angiogenesis via a heme oxygenase 1-dependent mechanism. J Exp Med. 2007;204:605–18. doi: 10.1084/jem.20061609. [DOI] [PMC free article] [PubMed] [Google Scholar]
- 33.Papapetropoulos A, Garcia-Cardena G, Madri JA, Sessa WC. Nitric oxide production contributes to the angiogenic properties of vascular endothelial growth factor in human endothelial cells. J Clin Invest. 1997;100:3131–9. doi: 10.1172/JCI119868. [DOI] [PMC free article] [PubMed] [Google Scholar]
- 34.Angelucci A, Bologna M. Targeting vascular cell migration as a strategy for blocking angiogenesis: the central role of focal adhesion protein tyrosine kinase family. Curr Pharm Des. 2007;13:2129–45. doi: 10.2174/138161207781039643. [DOI] [PubMed] [Google Scholar]
- 35.Papapetropoulos A, et al. Angiopoietin-1 inhibits endothelial cell apoptosis via the Akt/survivin pathway. J Biol Chem. 2000;275:9102–5. doi: 10.1074/jbc.275.13.9102. [DOI] [PubMed] [Google Scholar]
- 36.Thompson AD, 3rd, Kakar SS. Insulin and IGF-1 regulate the expression of the pituitary tumor transforming gene (PTTG) in breast tumor cells. FEBS Lett. 2005;579:3195–200. doi: 10.1016/j.febslet.2005.05.008. [DOI] [PubMed] [Google Scholar]
- 37.Graiani G, et al. Nerve growth factor promotes reparative angiogenesis and inhibits endothelial apoptosis in cutaneous wounds of Type 1 diabetic mice. Diabetologia. 2004;47:1047–54. doi: 10.1007/s00125-004-1414-7. [DOI] [PubMed] [Google Scholar]
- 38.Hochberg Y, Benjamini Y. More powerful procedures for multiple significance testing. Stat Med. 1990;9:811–8. doi: 10.1002/sim.4780090710. [DOI] [PubMed] [Google Scholar]
- 39.Chavakis E, et al. Role of beta2-integrins for homing and neovascularization capacity of endothelial progenitor cells. J Exp Med. 2005;201:63–72. doi: 10.1084/jem.20041402. [DOI] [PMC free article] [PubMed] [Google Scholar]
- 40.Sbaa E, et al. Caveolin plays a central role in endothelial progenitor cell mobilization and homing in SDF-1-driven postischemic vasculogenesis. Circ Res. 2006;98:1219–27. doi: 10.1161/01.RES.0000220648.80170.8b. [DOI] [PubMed] [Google Scholar]
- 41.Invernici G, et al. Human fetal aorta contains vascular progenitor cells capable of inducing vasculogenesis, angiogenesis, and myogenesis in vitro and in a murine model of peripheral ischemia. Am J Pathol. 2007;170:1879–92. doi: 10.2353/ajpath.2007.060646. [DOI] [PMC free article] [PubMed] [Google Scholar]
- 42.Graiani G, et al. Genetic deletion of the p66Shc adaptor protein protects from angiotensin II-induced myocardial damage. Hypertension. 2005;46:433–40. doi: 10.1161/01.HYP.0000174986.73346.ba. [DOI] [PubMed] [Google Scholar]
- 43.Ackah E, et al. Akt1/protein kinase Balpha is critical for ischemic and VEGF-mediated angiogenesis. J Clin Invest. 2005;115:2119–27. doi: 10.1172/JCI24726. [DOI] [PMC free article] [PubMed] [Google Scholar]
- 44.O'Connor DS, et al. Control of apoptosis during angiogenesis by survivin expression in endothelial cells. Am J Pathol. 2000;156:393–8. doi: 10.1016/S0002-9440(10)64742-6. [DOI] [PMC free article] [PubMed] [Google Scholar]
- 45.Zwerts F, et al. Lack of endothelial cell survivin causes embryonic defects in angiogenesis, cardiogenesis, and neural tube closure. Blood. 2007;109:4742–52. doi: 10.1182/blood-2006-06-028068. [DOI] [PMC free article] [PubMed] [Google Scholar]
- 46.Suzuki A, et al. Survivin initiates cell cycle entry by the competitive interaction with Cdk4/p16(INK4a) and Cdk2/cyclin E complex activation. Oncogene. 2000;19:3225–34. doi: 10.1038/sj.onc.1203665. [DOI] [PubMed] [Google Scholar]
- 47.Heaney AP, Horwitz GA, Wang Z, Singson R, Melmed S. Early involvement of estrogen-induced pituitary tumor transforming gene and fibroblast growth factor expression in prolactinoma pathogenesis. Nat Med. 1999;5:1317–21. doi: 10.1038/15275. [DOI] [PubMed] [Google Scholar]
- 48.Boodhwani M, et al. Functional, cellular, and molecular characterization of the angiogenic response to chronic myocardial ischemia in diabetes. Circulation. 2007;116:I31–7. doi: 10.1161/CIRCULATIONAHA.106.680157. [DOI] [PMC free article] [PubMed] [Google Scholar]
- 49.Kivela R, et al. Effects of experimental type 1 diabetes and exercise training on angiogenic gene expression and capillarization in skeletal muscle. Faseb J. 2006;20:1570–2. doi: 10.1096/fj.05-4780fje. [DOI] [PubMed] [Google Scholar]
- 50.Lee TH, et al. Integrin regulation by vascular endothelial growth factor in human brain microvascular endothelial cells: role of alpha6beta1 integrin in angiogenesis. J Biol Chem. 2006;281:40450–60. doi: 10.1074/jbc.M607525200. [DOI] [PubMed] [Google Scholar]
- 51.Vlahakis NE, et al. Integrin alpha9beta1 directly binds to vascular endothelial growth factor (VEGF)-A and contributes to VEGF-A-induced angiogenesis. J Biol Chem. 2007;282:15187–96. doi: 10.1074/jbc.M609323200. [DOI] [PubMed] [Google Scholar]
- 52.Xiong JW, Leahy A, Lee HH, Stuhlmann H. Vezf1: A Zn finger transcription factor restricted to endothelial cells and their precursors. Dev Biol. 1999;206:123–41. doi: 10.1006/dbio.1998.9144. [DOI] [PubMed] [Google Scholar]
- 53.Kuhnert F, et al. Dosage-dependent requirement for mouse Vezf1 in vascular system development. Dev Biol. 2005;283:140–56. doi: 10.1016/j.ydbio.2005.04.003. [DOI] [PMC free article] [PubMed] [Google Scholar]
- 54.Miyashita H, Kanemura M, Yamazaki T, Abe M, Sato Y. Vascular endothelial zinc finger 1 is involved in the regulation of angiogenesis: possible contribution of stathmin/OP18 as a downstream target gene. Arterioscler Thromb Vasc Biol. 2004;24:878–84. doi: 10.1161/01.ATV.0000126373.52450.32. [DOI] [PubMed] [Google Scholar]
- 55.Greenberg DA, Jin K. From angiogenesis to neuropathology. Nature. 2005;438:954–9. doi: 10.1038/nature04481. [DOI] [PubMed] [Google Scholar]
- 56.Dechant G, Barde YA. The neurotrophin receptor p75(NTR): novel functions and implications for diseases of the nervous system. Nat Neurosci. 2002;5:1131–6. doi: 10.1038/nn1102-1131. [DOI] [PubMed] [Google Scholar]
- 57.Sala-Newby GB, Freeman NV, Curto MA, Newby AC. Metabolic and functional consequences of cytosolic 5′-nucleotidase-IA overexpression in neonatal rat cardiomyocytes. Am J Physiol Heart Circ Physiol. 2003;285:H991–8. doi: 10.1152/ajpheart.00053.2003. [DOI] [PubMed] [Google Scholar]
- 58.He TC, et al. A simplified system for generating recombinant adenoviruses. Proc Natl Acad Sci U S A. 1998;95:2509–14. doi: 10.1073/pnas.95.5.2509. [DOI] [PMC free article] [PubMed] [Google Scholar]
- 59.Leroyer AS, et al. Cellular origins and thrombogenic activity of microparticles isolated from human atherosclerotic plaques. J Am Coll Cardiol. 2007;49:772–7. doi: 10.1016/j.jacc.2006.10.053. [DOI] [PubMed] [Google Scholar]
- 60.Baldi P, Long AD. A Bayesian framework for the analysis of microarray expression data: regularized t -test and statistical inferences of gene changes. Bioinformatics. 2001;17:509–19. doi: 10.1093/bioinformatics/17.6.509. [DOI] [PubMed] [Google Scholar]
- 61.Thomas PD, et al. Applications for protein sequence-function evolution data: mRNA/protein expression analysis and coding SNP scoring tools. Nucleic Acids Res. 2006;34:W645–50. doi: 10.1093/nar/gkl229. [DOI] [PMC free article] [PubMed] [Google Scholar]
- 62.Benjamini Y, H Y. Controlling the false discovery rate: a practical and powerful approach to multiple testing. Journal of the Royal Statistical Society. 1995;57:289–300. [Google Scholar]
- 63.Emanueli C, et al. Prevention of diabetes-induced microangiopathy by human tissue kallikrein gene transfer. Circulation. 2002;106:993–9. doi: 10.1161/01.cir.0000027104.33206.c8. [DOI] [PubMed] [Google Scholar]
- 64.Madeddu P, et al. Phosphoinositide 3-Kinase {gamma} Gene Knockout Impairs Postischemic Neovascularization and Endothelial Progenitor Cell Functions. Arterioscler Thromb Vasc Biol. 2007 doi: 10.1161/ATVBAHA.107.145573. [DOI] [PMC free article] [PubMed] [Google Scholar]
Associated Data
This section collects any data citations, data availability statements, or supplementary materials included in this article.