Abstract
Riboswitches regulate genes through structural changes in ligand-binding RNA aptamers. Using an optical-trapping assay based on in situ transcription by a molecule of RNA polymerase, single nascent RNAs containing pbuE adenine riboswitch aptamers were unfolded and refolded. Multiple folding states were characterized using both force-extension curves and folding trajectories under constant force by measuring the molecular contour length, kinetics, and energetics with and without adenine. Distinct folding steps correlated with the formation of key secondary or tertiary structures and with ligand binding. Adenine-induced stabilization of the weakest helix in the aptamer, the mechanical switch underlying regulatory action, was observed directly. These results provide an integrated view of hierarchical folding in an aptamer, demonstrating how complex folding can be resolved into constituent parts, and supply further insights into tertiary structure formation.
Riboswitches are elements of mRNA that regulate gene expression through ligand-induced changes in mRNA secondary or tertiary structure (1, 2). This regulation is accomplished through the binding of a small metabolite to an aptamer in the 5′-untranslated region of the mRNA, which causes conformational changes altering the expression of downstream genes. Riboswitch-dependent regulatory processes depend crucially on the properties of aptamer folding; the kinetics and thermodynamics of folding are therefore of central importance for understanding function.
Among the simplest riboswitches are those regulating purine metabolism, which have aptamers with “tuning fork” structures (3, 4) that bind ligands at a specific residue in a pocket formed by a three-helix junction. The junction is thought to be pre-organized by numerous tertiary contacts, including interactions between two hairpin loops, but the binding pocket itself is likely stabilized only upon ligand binding (4–10). Ligand binding also stabilizes a nearby helix (3–5), sequestering residues that would otherwise participate in an alternate structure affecting gene expression (e.g. terminator or anti-terminator hairpins, ribosome binding sequences). Features such as ligand specificity (6, 11) and its structural basis (6, 7), the rates and energies for ligand binding and dissociation (12), the kinetics of loop-loop formation (10), and the interplay of structural pre-organization and induced fit (7–9) have recently been investigated. These studies, however, focused on isolated steps in folding, typically employing ligand analogs or investigating aptamers from different organisms. Here we obtain, from a single set of measurements, an integrated picture of secondary and tertiary structure formation, as well as ligand binding, in the aptamer of the pbuE adenine riboswitch from B. subtilis, by observing folding and unfolding trajectories of individual molecules subjected to controlled loads in a high-resolution, dual-trap optical tweezers apparatus (13).
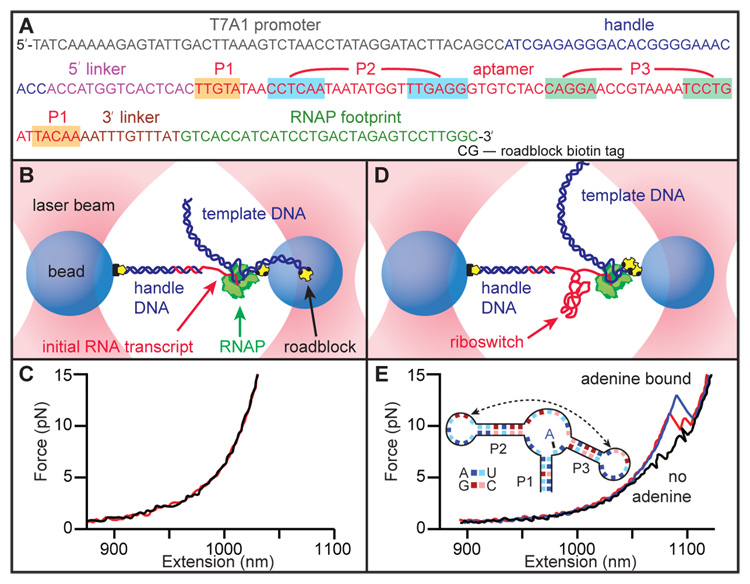
Single-molecule force spectroscopy, which measures the extension of a molecule as it unfolds and refolds under tension, furnishes a tool for probing structural transitions: extension changes can be related to the number of nucleotides involved in folding. Furthermore, the effects of force on reaction equilibria and kinetics allow the shapes of the folding landscapes to be determined in detail (14–16). The complete folding process, starting from a fully-unfolded state (not usually probed in conventional RNA folding studies), can also be observed. This initial configuration is especially relevant to riboswitches, because aptamers fold co-transcriptionally from an initially unstructured state. Because of the tight coupling between folding and transcription, the assay was designed to measure folding of mRNA transcribed in situ (17). A single E. coli RNA polymerase (RNAP) molecule, transcriptionally stalled downstream of the promoter region on a DNA template (Fig. 1A), was attached to a bead held in one optical trap (Fig. 1B). The 29-nucleotide (nt) initial RNA transcript emerging from the RNAP was hybridized to the complementary cohesive end of a 3-kb dsDNA “handle” attached to a bead held in the other trap, creating a “dumbbell” geometry allowing forces to be applied between the RNAP and the 5′ end of the RNA (18). Force-extension curves (FECs) showing the molecular extension measured as a function of force as the traps were moved apart at a constant rate, confirmed that this initial transcript was unstructured (Fig. 1C).
Fig. 1.
(A) DNA template used for RNA transcription, showing the sequence of the non-transcribed promoter, the 25-bp section hybridizing with the DNA handle, the pbuE riboswitch aptamer (base-paired helices highlighted) flanked by short linkers, and the footprint of RNAP when stalled by the terminal roadblock. (B) Schematic of the optical trapping assay showing experimental geometry, with stalled RNAP and initial RNA transcript hybridized to the dsDNA handle (not to scale). (C) Two FECs obtained prior to aptamer transcription show little or no structure in the initial transcript. (D) Template DNA is transcribed in situ, producing an aptamer transcript, after which RNAP is stalled by a streptavidin molecule bound to the biotin-based roadblock. (E) FECs obtained after transcription show unfolding transitions in the aptamer. Without adenine, two events are seen (black), corresponding to the unfolding of hairpins P2 and P3 (inset). With adenine bound to the aptamer, larger unfolding events are observed (blue), sometimes involving an intermediate state (red).
After constructing the dumbbells, transcription was restarted by introducing nucleoside triphosphates. The DNA template coded for the pbuE adenine riboswitch aptamer downstream of the initial transcript (Fig. 1A). Once the aptamer sequence was transcribed, RNAP was prevented from further elongation by a roadblock consisting of a streptavidin molecule bound to a 5′-terminal biotin label on the template (Fig. 1D). FECs measured immediately after aptamer transcription (Fig. 1E) revealed a characteristic series of sawtooth features that arise from contour length increases as specific structural elements unfold (19). In the absence of adenine, two small unfolding events were typically observed (Fig. 1E, black). These features are produced by the unfolding of the two stable hairpins in the secondary structure, P3 and P2 (inset, Fig. 1E). The interactions that underpin tertiary structure by holding these hairpin loops together and structuring the binding pocket in the triple-helix junction are present only transiently in the absence of adenine (5, 8, 10). The contour length changes associated with these features, 17 ± 2 nt (P3) and 22 ± 2 nt (P2), are consistent with the values expected for these hairpins (19 and 21 nt, respectively) (18). In the presence of adenine, some FECs were identical to those observed in its absence, indicating in these cases that adenine was not bound to the aptamer. More commonly however, larger unfolding distances at higher forces were observed, corresponding to adenine-induced stabilization of the folded structure. In the latter case, the aptamer usually unfolded cooperatively in a single event (Fig. 1E, blue), but sometimes through an intermediate state (Fig. 1E, red).
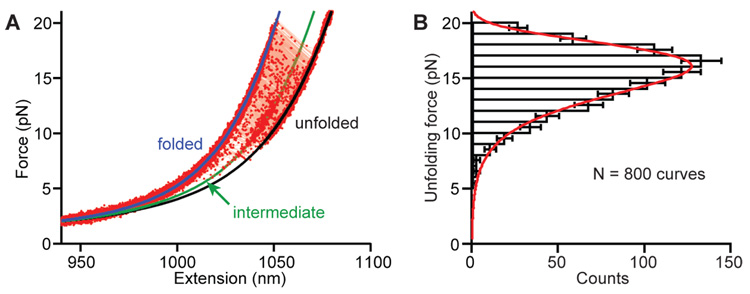
Unfolding from the fully-folded state was analyzed in more detail by collecting multiple FECs from the same molecule. Overlaying 800 FECs shows that the aptamer unfolds over a wide distribution of forces (Fig. 2A), as expected for a non-equilibrium measurement (20). Three states were clearly seen: the folded and unfolded states, and an intermediate state. We fit the FECs with two worm-like chains (WLCs) in series: one for the dsDNA handle (21) and the other for the ssRNA (22), assuming a contour length of 0.59 nm/nt for RNA (23). When the aptamer unfolded fully, 62 ± 1 nt were released (18), in agreement with the 63-nt aptamer length. The intermediate state is 23 ± 1 nt shorter than the unfolded state, suggesting that it corresponds to a folded 21-nt P2 helix. The equilibrium free energy of the aptamer, computed using the method of Jarzynski (24, 25) from the non-equilibrium work done to unfold it (fig. S2), is 18 ± 2 kcal/mol (18). For comparison, the free energy predicted for the secondary structure in Fig. 1E is only ~12 ± 1 kcal/mol (10), indicating that tertiary contacts and ligand binding stabilize the aptamer by an additional ~6 ± 2 kcal/mol, in reasonable agreement with earlier measurements of the binding energy of 2-aminopurine (2AP), an adenine analog (12).
Fig. 2.
(A) Non-equilibrium FECs for folded aptamer display a wide distribution of unfolding forces. WLC fit to the folded state (blue), and double WLC fits to the intermediate (green) and unfolded (black) states, indicate contour length changes of 39 ± 1 nt and 62 ± 1 nt for unfolding to the intermediate and unfolded states, respectively. (B) The unfolding force distribution is fit by a model returning the unfolding rate, along with the location and height of the energy barrier to unfolding.
The distribution of forces, p(F), for unfolding the fully-folded aptamer (Fig. 2B) is well fit by an expression derived by Dudko et al. (20) for unfolding at fixed loading rate, parameterized by koff, the unfolding rate at F = 0, Δx‡, the distance to the transition state from the folded state, and ΔG‡, the height of the energy barrier (18). Over 3,000 FECs measured for 8 molecules, at loading rates varying from ~10– 200 pN/s, yielded an unfolding rate koff ~ 0.04 s−1 (ln koff = − 3.5 ± 1), similar to the value of 0.15 s−1 measured previously by bulk kinetic methods (12). The activation energy, ΔG‡, was 17 ± 4 kcal/mol, in agreement with a previous result for the unbinding of 2AP (12). The distance to the transition state Δx‡ was 2.1 ± 0.2 nm. Given an extension of ~0.42 nm/nt at the most probable unfolding force of ~15 pN, this result indicates that the transition state involves the unzipping of ~2.5 base pairs (bp) in helix P1, suggesting that the G:C basepair in P1 (Fig. 1E, inset) represents a structural keystone: both the binding pocket and triple-helix junction unfold once it is disrupted. Interestingly, isolated G:C basepairs located 3–4 bp from the loop of P1 are found in the other purine riboswitches, suggesting that they may be an important structural feature of this class of aptamers.
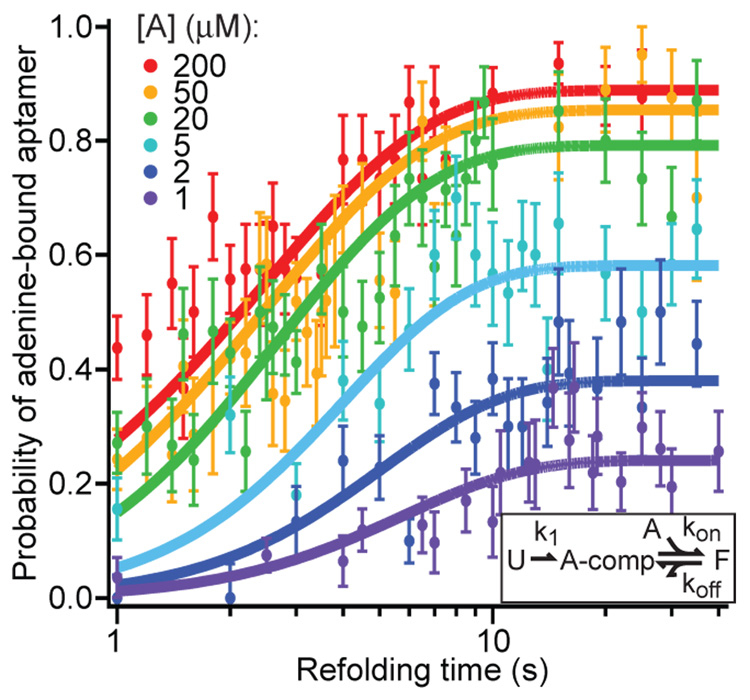
The kinetics of refolding and ligand binding were probed by observing the fraction of FECs showing the unfolding signature of the fully-folded, adenine-bound aptamer, as a function of adenine concentration and the variable time interval during which refolding could occur between successive measurements (Fig. 3). We fit these data to a minimal, two-step model (Fig. 3, inset): formation of an intermediate structure competent to bind adenine (taken to be effectively irreversible) followed by adenine binding. The complete folding process involves a hierarchy of several steps, including folding of the three helices, formation of the loop-loop contacts and the adenine binding pocket, and binding of adenine. At F = 0, however, helix formation should be fast compared to formation of the tertiary interactions creating the binding pocket, hence we model this process using just three distinct states. A global fit of data to the time-dependent folding probabilities returned k1 = 0.4 ± 0.05 s−1, koff = 0.2 ± 0.05 s−1, and kon = 8 ± 1 × 10⁴ M−1 s−1. The value of koff is similar to that obtained above, and kon is close to the value measured by bulk experiments (12). The slow folding rate implies that both aptamer folding and adenine binding occur on the same time scale as transcription itself, supporting the hypothesis that the function of this riboswitch is governed by folding and binding kinetics rather than equilibrium thermodynamics (10, 26).
Fig. 3.
Kinetics of aptamer refolding and binding. The fraction of FECs corresponding to the fully-folded, adenine-bound aptamer (identified by the appropriate unfolding signature) for various adenine concentrations as a function of the variable time delay for refolding between pulls. Solid curves display the global fit to a minimal 3-state kinetic scheme (inset): “U” = unfolded, “A-comp” = competent to bind adenine, “F” = folded; adenine-bound.
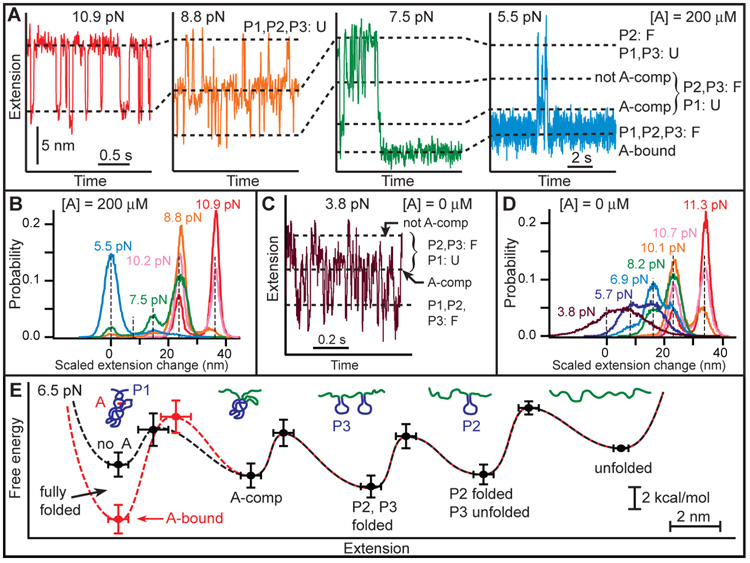
The multiple steps in the overall folding reaction were studied in greater detail by unfolding the aptamer completely and monitoring its extension under constant force using a passive force clamp (27) as the force was reduced stepwise every 1–2 min. Observing the transitions in the refolding process individually, based on their different energies and time scales, four distinct steps were seen (Fig. 4). The first folding event, at ~9–11 pN (Fig. 4A, red), involves length changes and force-dependent kinetics consistent with folding the 21-nt hairpin P2, as predicted by an energy landscape model for hairpin folding (16, 18). The second folding step, at ~7–8 pN (Fig. 4A, orange), matches the properties expected for folding the 19-nt hairpin P3. The identification of these steps with the folding of P2 and P3 was confirmed by blocking the folding of each hairpin separately using antisense oligomers (fig. S3). We speculate that P2, the first fully-transcribed element, is also the most stable in order to ensure that it can form in the presence of competing, alternative secondary structures in the upstream mRNA that might delay or prevent the formation of the proper aptamer structure.
Fig. 4.
Aptamer states and energetics determined by refolding at constant force. (A) As force is reduced, first P2 refolds (red), then P3 folds (orange). At lower forces, P2 and P3 interact to form a binding pocket and adenine binds, generating two additional states (green). The adenine-bound state is stable over many seconds, even at 5 pN load (blue). (B) Histograms of complete trajectories at different forces, with extension changes scaled by the force-dependent extension per nucleotide. Dashed lines indicate distinct states; the A-comp state is rarely populated. (C, D) Refolding trajectory and histograms in the absence of adenine. P2 and P3 folding occur as with adenine, but the A-comp state is now highly populated at low force, while the folded state is very unstable, even at low force (purple). (E) Quantitative energy landscapes for aptamer folding at 6.5 pN, reconstructed from the experimental data in the presence (red) and absence (black) of adenine. The five potential wells correspond to five observed folding states, illustrated by cartoons. Adenine binding only significantly affects the barrier and energy of the folded state.
In contrast to the adenine-independent events described above, the two folding transitions observed at lower forces were found to be adenine-dependent. For forces below ~7 pN at saturating adenine concentrations, the aptamer spent significant time in the shortest-extension state (Fig. 4A, green and blue), which we identify as the folded, adenine-bound state. That identification was confirmed by measuring a contour length change of 63.1 ± 0.8 nt when the 63-nt aptamer was completely unfolded from this state. The contour length change between this state and the one with only P2 and P3 folded, 21 ± 2 nt, is consistent with the 23 nt not involved in P2 and P3 folding. In addition, a transient intermediate was observed between these two states, 14 ± 1 nt from the folded state. Because there are 15 nucleotides in and adjacent to P1 (Fig. 1A), we identify this intermediate as a state where P2 and P3 are folded and the adenine binding pocket is pre-organized by tertiary contacts, sequestering the nucleotides between P2 and P3, but P1 remains unfolded. The extensions of all five states (fully unfolded, P2 folded, P2/P3 folded, P1 unfolded, and fully folded), scaled by the fractional extension per nucleotide at a given force, are evident in histograms of records (Fig. 4B).
Constant-force extension records in the absence of adenine (Figs. 4C, D) indicate very different behavior at low forces: the P1-unfolded state is strongly populated below ~6 pN, whereas the folded state is only significantly populated below ~4 pN. Even at such low forces, the folded state lifetime is short, with a rapid equilibrium between folded and P1-unfolded states. These differences can be understood if the P1-unfolded state is the adenine-competent state. At saturating adenine concentrations, the formation of this state leads rapidly to an adenine-bound, folded state that is long-lived even at ~7 pN (Fig. 4A), and the P1-unfolded state is thus rarely occupied. In contrast, absent adenine, the P1-unfolded state is frequently occupied even at low forces. Occasionally, the transient folding of P1 was observed even with adenine present (Fig. 4A, green), likely indicating that adenine was not bound at that instant. The single-molecule records thus directly reflect an adenine-induced stabilization of helix P1 that underpins the switching action of the riboswitch (28).
Each of the folding transitions can be analyzed individually as a two-state process, enabling a piecewise reconstruction of the energy landscape for folding, both with and without adenine (Fig. 4E). The relative free energies of the five observed states were determined from extension histograms, while the locations and heights of the energy barriers between states were determined from the force-dependence of the kinetics (15, 18). From these landscapes, we find that the tertiary contacts that form the adenine-competent state, which are primarily base-pair and base-quartet interactions between the hairpin loops (4, 9), stabilize the structure by an additional 2.7 ± 0.3 kcal/mol (18). The transition state for breaking these interactions lies ~1 nm from the adenine-competent state, indicative of their short range (29). We also find that adenine binding stabilizes the folded state by 4 ± 1 kcal/mol and raises the energy barrier for leaving the folded state, but does not significantly affect other properties of the landscape.
These energy landscapes dramatically illustrate the sequential folding of each structural element in the RNA. Folding proceeds through a distinct hierarchy of states, but the formation of tertiary and secondary structure is interleaved, because the energetic stabilities of these structures happen to be comparable, in contrast with the standard picture of hierarchical folding. In fact, the tertiary contacts that pre-organize the adenine-competent state are considerably more stable than the least-stable helix, P1, which is the essential component governing the switching behavior of the riboswitch. In vivo, without adenine binding to stabilize P1, this last component of the aptamer to fold would be highly susceptible to disruption by terminator hairpin invasion.
The techniques developed here point the way to a powerful method for monitoring co-transcriptional folding. In the case of the pbuE aptamer, the first FEC obtained after transcription did not exhibit an unfolding behavior substantially different from subsequent FECs, implying that the co-transcriptional aspect of folding may not be important for the formation of an isolated aptamer (18). This result is unsurprising, because structural elements of the aptamer fold in the same order as they are transcribed, hence force-induced refolding mimics co-transcriptional folding in this case. However, for the folding of the complete riboswitch, which includes a downstream terminator hairpin that competes with aptamer formation, we anticipate an important co-transcriptional dependence (10, 26).
Footnotes
Supporting Online Material
www.sciencemag.org/cgi/content/full/1151298/DC1
Materials and Methods
Figs. S1 to S3
Tables S1 and S2
References
References and Notes
- 1.Winkler WC, Breaker RR. Annu. Rev. Microbiol. 2005;59:487. doi: 10.1146/annurev.micro.59.030804.121336. [DOI] [PubMed] [Google Scholar]
- 2.Coppins RL, Hall KB, Groisman EA. Curr. Opin.Microbiol. 2007;10:176. doi: 10.1016/j.mib.2007.03.006. [DOI] [PMC free article] [PubMed] [Google Scholar]
- 3.Batey RT, Gilbert SD, Montange RK. Nature. 2004;432:411. doi: 10.1038/nature03037. [DOI] [PubMed] [Google Scholar]
- 4.Serganov A, et al. Chem. Biol. 2004;11:1729. doi: 10.1016/j.chembiol.2004.11.018. [DOI] [PMC free article] [PubMed] [Google Scholar]
- 5.Mandalb M, Boese B, Barrick JE, Winkler WC, Breaker RR. Cell. 2003;113:577. doi: 10.1016/s0092-8674(03)00391-x. [DOI] [PubMed] [Google Scholar]
- 6.Noeske J, et al. Proc. Natl. Acad. Sci. USA. 2005;102:1372. doi: 10.1073/pnas.0406347102. [DOI] [PMC free article] [PubMed] [Google Scholar]
- 7.Gilbert SD, Stoddard CD, Wise SJ, Batey RT. J. Mol. Biol. 2006;359:754. doi: 10.1016/j.jmb.2006.04.003. [DOI] [PubMed] [Google Scholar]
- 8.Noeske J, et al. Nucleic Acids Res. 2007;35:572. doi: 10.1093/nar/gkl1094. [DOI] [PMC free article] [PubMed] [Google Scholar]
- 9.Ottink OM, et al. RNA. 2007;13:2202. doi: 10.1261/rna.635307. [DOI] [PMC free article] [PubMed] [Google Scholar]
- 10.Lemay JF, Penedo JC, Tremblay R, Lilley DM, Lafontaine DA. Chem. Biol. 2006;13:857. doi: 10.1016/j.chembiol.2006.06.010. [DOI] [PubMed] [Google Scholar]
- 11.Mandal M, Breaker RR. Nat. Struct. Mol. Biol. 2004;11:29. doi: 10.1038/nsmb710. [DOI] [PubMed] [Google Scholar]
- 12.Wickiser JK, Cheah MT, Breaker RR, Crothers DM. Biochemistry. 2005;44:13404. doi: 10.1021/bi051008u. [DOI] [PubMed] [Google Scholar]
- 13.Abbondanzieri EA, Greenleaf WJ, Shaevitz JW, Landick R, Block SM. Nature. 2005;438:460. doi: 10.1038/nature04268. [DOI] [PMC free article] [PubMed] [Google Scholar]
- 14.Tinoco I, Jr, Bustamante C. Biophys. Chem. 2002;101-102:513. doi: 10.1016/s0301-4622(02)00177-1. [DOI] [PubMed] [Google Scholar]
- 15.Woodside MT, et al. Science. 2006;314:1001. doi: 10.1126/science.1133601. [DOI] [PMC free article] [PubMed] [Google Scholar]
- 16.Woodside MT, et al. Proc. Natl. Acad. Sci. USA. 2006;103:6190. doi: 10.1073/pnas.0511048103. [DOI] [PMC free article] [PubMed] [Google Scholar]
- 17.Dalal RV, et al. Mol. Cell. 2006;23:231. doi: 10.1016/j.molcel.2006.06.023. [DOI] [PMC free article] [PubMed] [Google Scholar]
- 18.Materials and methods are available as supporting material on Science Online
- 19.Onoa B, et al. Science. 2003;299:1892. doi: 10.1126/science.1081338. [DOI] [PMC free article] [PubMed] [Google Scholar]
- 20.Dudko OK, Hummer G, Szabo A. Phys. Rev. Lett. 2006;96:108101. doi: 10.1103/PhysRevLett.96.108101. [DOI] [PubMed] [Google Scholar]
- 21.Smith SB, Cui Y, Bustamante C. Science. 1996;271:795. doi: 10.1126/science.271.5250.795. [DOI] [PubMed] [Google Scholar]
- 22.Seol Y, Skinner GM, Visscher K. Phys. Rev. Lett. 2004;93:118102. doi: 10.1103/PhysRevLett.93.118102. [DOI] [PubMed] [Google Scholar]
- 23.Saenger W. Principles of Nucleic Acid Structure. New York: Springer; 1984. [Google Scholar]
- 24.Liphardt J, Dumont S, Smith SB, Tinoco I, Jr, Bustamante C. Science. 2002;296:1832. doi: 10.1126/science.1071152. [DOI] [PubMed] [Google Scholar]
- 25.Jarzynski C. Phys. Rev. Lett. 1997;78:2690. [Google Scholar]
- 26.Wickiser JK, Winkler WC, Breaker RR, Crothers DM. Mol. Cell. 2005;18:49. doi: 10.1016/j.molcel.2005.02.032. [DOI] [PubMed] [Google Scholar]
- 27.Greenleaf WJ, Woodside MT, Abbondanzieri EA, Block SM. Phys. Rev. Lett. 2005;95:208102. doi: 10.1103/PhysRevLett.95.208102. [DOI] [PMC free article] [PubMed] [Google Scholar]
- 28.Some molecular heterogeneity was present, but we did not observe order-of-magnitude variations in the kinetics from one RNA to the next, as reported in one single-molecule fluorescence study (10).
- 29.Li PTX, Bustamante C, Tinoco I., Jr Proc. Natl.Acad. Sci. USA. 2006;103:15847. doi: 10.1073/pnas.0607202103. [DOI] [PMC free article] [PubMed] [Google Scholar]
- 30.We thank Robert Landick for providing purified RNAP, Kristina Herbert for providing the plasmid used to make the transcription template, Matt Larson and Olga Dudko for helpful advice, and members of the Block lab and Program Project Grant GM066275 for useful discussions. Our research was supported by grants from the NIGMS (GM057035) and the National Institute for Nanotechnology.


