Abstract
The perinucleolar compartment (PNC) is a nuclear subdomain that is unique to tumor cells, and the percentage of cells in a population containing PNCs (PNC prevalence) indicates the level of malignancy of that population. Here, we utilize anti-cancer drugs and other exogenous stimuli to investigate the structure and function of the PNC. Screening of clinically used anti-cancer drugs revealed two types of drugs disassemble PNCs and do so through their specific molecular actions. Transcription inhibitors reduce PNC prevalence in parallel with RNA polymerase III transcription reduction, and a subset of DNA-damaging drugs and stimuli (UV radiation) disassemble the PNC. Inhibition of cellular DNA damage response demonstrated that the DNA damage itself, not the response or polymerase III inhibition, is responsible for PNC disassembly, suggesting that the maintenance of the PNC is dependent upon DNA integrity. Analyses of the types of DNA damage that cause PNC disassembly show that interstrand DNA base pairing, not strand continuity, is important for PNC integrity, indicating that the PNC components are directly interacting with the DNA. Complementary cell biology experiments demonstrated that the number of PNCs per cell increases with the rounds of endoreplication and that PNCs split into doublets during mid S phase, both of which are phenotypes that are typical of a replicating DNA loci. Together, these studies validate PNC disassembly as a screening marker to identify chemical probes and revealed that the PNC is directly nucleated on a DNA locus, suggesting a potential role for the PNC in gene expression regulation.
The perinucleolar compartment (PNC)2 is a non-membrane-bound nuclear subdomain that is associated with, but structurally distinct from, the nucleolus. The PNC is a generally heritable trait, in which the number of PNCs per cell in daughter cells often mimics that of their mother cells. The PNC is heterogeneous in shape and ranges from 0.5 to 4 μm in size (1), is stable through interphase, disassembles during mitosis, and reassembles in early G1 (1). The PNC is concentrated with newly synthesized RNA polymerase III RNAs (MRP RNase RNA, RNase P H1 RNA, hY RNAs (hY1, -2, and -5), AluRNA, and SRP (7SL) RNA) and RNA-binding proteins (nucleolin, PTB, CUG repeat-binding protein, KSRP, Raver1, Raver2, and Rod1) (2–9).3 Continuous transcription by pol III is necessary for the structure integrity of the PNC, implicating involvement of PNCs in pol III RNA metabolism (9). However, the complete molecular composition and function of the PNC remain to be elucidated.
Extensive in vitro studies showed that the PNC is unique to tumor cells and preferentially forms in tumor cells derived from solid tissues (1, 10). In vitro studies of cancer cell lines from various origins and malignant capacities have shown that PNC prevalence correlates with the malignancy of tumors and has the potential to be developed as a pan-cancer prognostic marker (10). In addition, in vivo investigations using human breast tissue samples demonstrated that PNC prevalence was 0% in normal breast epithelium, increases in parallel with the disease progression (as determined by staging), and reaches nearly 100% in distant metastases, demonstrating that PNC prevalence associates with the malignancy of breast cancer in vivo. Multivariate analysis further showed that a high PNC prevalence is associated with poor patient outcomes independent of current prognostic factors for stage I breast cancer patients (11). These studies demonstrate that the presence of the PNC reflects an advanced transformation state of cancer cells that are capable of metastasis.
Although a handful of components has been discovered, little is known regarding the structure and function of the PNC or its mechanistic link to cancer. Therefore, we report here the combinational use of chemical biology and cell biology approaches to gain a better understanding of the PNC. Because the PNC is so tightly associated with the malignant phenotype, known anti-cancer compounds were screened to identify those that can reduce PNC prevalence in cancer cell lines. We found that two types of drugs can significantly reduce PNC prevalence as follows: pol III transcription inhibitors and a subset of DNA-damaging agents. In depth analyses of the DNA-damaging agents indicated that the PNC is likely associated with a DNA locus. This idea is supported through cell biology approaches, leading to the conclusion that PNC is nucleating upon a mid S phase replicating DNA locus.
MATERIALS AND METHODS
Cell Culture and Drug Treatments—HeLa, HT2-19 (kind gift from Dr. Yossi Gruenbaum, Hebrew University, Jerusalem, Israel), and FEMX (including FVP1 and FVP3, kind gifts from Dr. Ira Pastan, National Institutes of Health) cell lines were maintained in Dulbecco's minimum essential media (Invitrogen), and PC-3M and DU145 (including RC1 and RC0.1, kind gifts from Dr. Yves Pommier, National Institutes of Health) were maintained in RPMI 1640 medium (Invitrogen). All media was supplemented with 10% fetal bovine serum (Atlanta Biologicals, Lawrenceville, GA) and 100 units/ml of penicillin and streptomycin (Invitrogen). All drugs and compounds were kept as 10 or 100 mm stocks (20 mm for folinic acid) in DMSO at –20 °C except for cis-platin and carbo-platin, which were dissolved to 10 mm in sterile PBS and kept at 4 °C (made fresh every 2 weeks). For drug treatments, cells were plated ∼24 h prior to treatment and treated for 20 h unless otherwise noted. UV treatment (100 mJ/m2) was performed on coverslips and removed from media, in a UV cross-linking chamber. All xenobiotics were obtained from Sigma, except for gemcitabine (kind gift from Dr. Steven Rosen, Northwestern Medical School) and the NCI mechanistic and diversity sets (from the Developmental Therapeutics Program of the NCI, National Institutes of Health). For screening this library, HeLa cells were plated at a density of ∼10,000 cells per well in a 96-well plate, treated overnight with the compounds at 10 μm (mechanistic set) or 100 μm (diversity set) to get a final solvent concentration of 1% DMSO, and stained with SH54 antibody to mark the PNC (see below for details). If this concentration killed all the cells, it was titrated down to a dose that allowed for PNC prevalence determination. All statistical analyses were performed using a two-tailed, two sample (unequal variance) Student's t test.
Immunofluorescent Staining to Mark the PNC—The media were removed from cells plated on 22 × 22-mm glass coverslips, and cells were fixed with 4% (w/v) paraformaldehyde in PBS for 12 min. The cells were then washed three times for 5 min each with PBS, solubilized for 5 min with 0.5% (v/v) Triton X-100 in PBS, and then washed three times for 5 min each with PBS. The coverslips were then incubated in a 1:200 dilution of SH54 (anti-PTB antibody (1)) in PBS for 1 h and then washed three times for 10 min each with PBS. The coverslips were then incubated in a 1:200 dilution of fluorescein isothiocyanate-conjugated anti-mouse secondary antibody (Jackson ImmunoResearch, West Grove, PA) and washed three times for 10 min each with PBS and then mounted on slides with anti-fade. Greater than 200 cells per coverslip were scored for PNC prevalence (n = 3). To be considered PNC-positive, a cell must have a distinct, punctate, perinucleolar labeling of PTB that is ∼1.5 times or greater the intensity of the nucleoplasmic PTB labeling. PNC scoring was performed by adjusting the focus plane through the entire depth of each cell scored using a ×60 objective on an epifluorescent microscope. A ×100 objective on an epifluorescent microscope was used for determining PNC number per cell. For screening the NCI library a ×20 objective on an inverted epifluorescent microscope was used.
Growth Inhibition Assay—HeLa cells were plated at a density of 5,000 cells per well in 96-well plates and allowed to attach overnight. The media were removed, and 198 μl of fresh media was added to each well. Each well was treated with 1 of 8 doses for each drug (105, 104.66, 104.33 nm,... 102.66 nm or 106 nm, 105.66, 10533 nm,... 103.66 nm) to give a final vehicle concentration of 1% DMSO and media volume of 200 μl. Cell proliferation was measured at t = 0 (time at start of treatment) and t = 72 h using 3-(4,5-dimethylthiazol-2-yl)-5-(3-carboxymethoxyphenyl)-2-(4-sulfophenyl)-2H-tetrazolium, inner salt, AQueous nonradioactive proliferation assay (Promega, Madison, WI). Briefly, the medium was removed and replaced with 120 μl of 1:5 v/v 3-(4,5-dimethylthiazol-2-yl)-5-(3-carboxymethoxyphenyl)-2-(4-sulfophenyl)-2H-tetrazolium, inner salt/media solution and allowed to incubate for 1 h at 37°C. The absorbance at 490 nm in each well was read with a Spectramax 250 plate reader (Molecular Devices, Sunnyvale, CA). The absorbance at t = 0 was subtracted from all absorbances at t = 72 h so that a 100% growth inhibitory concentration ([GI100%]) corresponds to when A0 h = A72 h; for HeLa cells the GImax is ∼110%. Each experiment was repeated four times, and the data for each concentration were averaged, and growth inhibition curves were constructed using XLfit4 software (IDBS, Guilford, UK).
RNase T1 Protection Assay—To determine the effect of various drugs on RNA polymerase III (7SK and Y1 promoters) transcription, 500 ng of pBS-7SK-3.6 and pBS-Y1-997 were each transiently transfected separately into 200,000 HeLa cells (in 35-mm dishes) with Lipofectamine (Invitrogen) according to the manufacturer's protocol. The pBS-7SK-3.6 and pBS-Y1-997 reporter plasmids contain 243 bp of the 7SK promoter region or 997 bp of the Y1 promoter region, respectively, upstream from an inverted β-globin gene insert followed by a sequence from the U1 gene containing the U1 3′ box as an RNA polymerase II termination signal and six Ts as an RNA polymerase III termination signal. The pBS-7SK-3.6 and pBS-Y1-997 reporter plasmids were used to make the complementary radiolabeled probes for each respective reporter using a T7 promoter located in an inverted orientation 28 bp downstream of the six Ts. Six hours after transfection, cells were treated with the drugs. After an additional 20 h, cells were lysed, and total RNA was collected using 1 ml of TRIzol. Total RNA was then quantified using a NanoDrop spectrometer, and the RNA concentrations for each sample were verified by measuring the rRNA from 1 μg of total RNA using 1.5% agarose gel electrophoresis and staining with ethidium bromide. Specific RNA transcripts from each reporter gene were analyzed using RNase T1 protection assays using ∼1 μg of total RNA and hybridizing to 300,000 cpm of radiolabeled probe specific to the appropriate reporter transcript. The signals from protected RNA species were quantified using a phosphorimaging scanner and Multi-Gauge software from Fujifilm.
siRNA and Immunoblotting—SMARTpool double-stranded RNAs against topoisomerase I were chemically synthesized and purified by Dharmacon Research Inc. The sequences of the pooled topo I oligonucleotides are as follows: 5′-GACUAGAGAAGCCAUUUUCUU-3′; 5′-AAUCAUUCAAUCGGAAAUCUU-3′; 5′-UGGGUGUAGAUUGAUGUGCUU-3′, and 5′-GACUCUACUACCUUCUUCGUU-3′.
The negative control siRNA was from Ambion, Inc. (Silencer® Negative Control 2 siRNA). PC-3M cells were plated at a density of ∼200,000 per 35-mm well and allowed to attach overnight. Transfection of siRNA into the cells was conducted utilizing Oligofectamine (Invitrogen) according to manufacturer's recommendations. Seventy two hours post-transfection cells were lysed in 150 μl of detergent buffer containing 1:100 v/v protease inhibitor mixture (Sigma). Lysates were run on denaturing 12% acrylamide gels and transferred to nitrocellulose membranes. The membranes were blocked in 5% (w/v) dried milk in TBST, incubated in anti-topoisomerase I antibody (Topogen, Port Orange, FL) at 1:2,000 v/v dilution in 5% milk in TBST overnight at 4 °C, washed, incubated in horseradish peroxidase-conjugated anti-rabbit secondary antibody (Jackson ImmunoResearch) at 1:5,000 v/v dilution in 5% milk for 1 h, and then developed. The membranes were then stripped with a reducing buffer, blocked in 5% milk, incubated in rabbit anti-actin antibody (Sigma) at 1:2,000 v/v dilution in 5% milk for 1 h at room temperature, washed, incubated in horseradish peroxidase-conjugated anti-rabbit secondary antibody (Jackson ImmunoResearch) at 1:5,000 v/v dilution in 5% milk for 1 h, and then developed. Membranes were developed with PicoWest developing solution (Pierce) and exposed to film. The band intensity was determined by scanning the developed films with a Kodak Image Station 440 CF and measuring the average pixel intensity of an area slightly larger than each band and subtracting the median background pixel intensity of the perimeter of the same area using Kodak MI software.
RESULTS
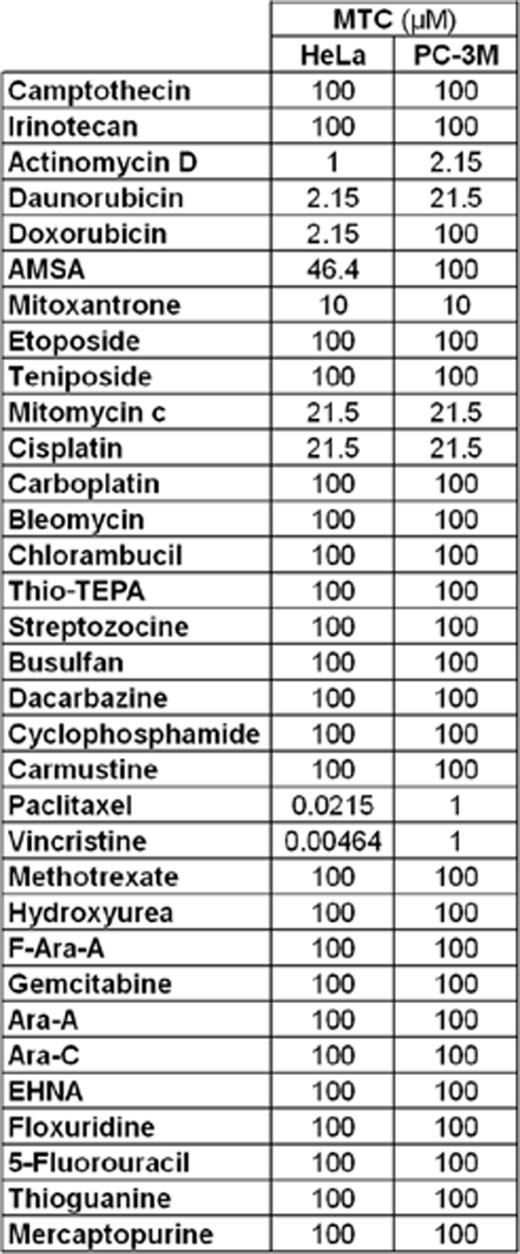
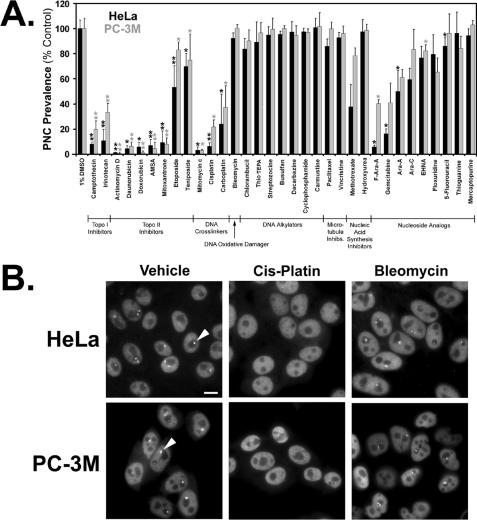
PNC Prevalence Reduction by Chemotherapeutic Drugs—Our previous studies have correlated PNC prevalence with the level of malignancy in solid tumors (10–11), and because the molecular mechanisms of clinically used anti-cancer drugs are well characterized, we screened these drugs for the ability to reduce PNC prevalence. HeLa and PC-3M cancer cell lines (PNC prevalence of ∼80–85%) were treated with 100 μm of each drug for 20 h, and if this concentration killed the vast majority of cells or arrested the cells in mitosis (PNCs disassemble during mitosis), the concentration was titrated down by 100.33 m until a concentration was achieved that allowed for PNC prevalence determination (maximum tolerated concentration, see Table 1). To allow for PNC prevalence determination, greater than 200 nonapoptotic interphase cells must remain on the coverslip after processing. PNCs were detected by immunofluorescent staining against the PTB, a component of the PNC (Fig. 1B). The results show that a subset of drugs, including topoisomerase I (topo I) and topoisomerase II (topo II) inhibitors, DNA cross-linkers, a subset of nucleoside analogs, and methotrexate were able to reduce PNC prevalence well below the vehicle-treated controls in both cell lines at the maximum tolerated concentration, whereas DNA alkylators, microtubule disrupting drugs (including 100 μm, 3-h treatments; data not shown), hydroxyurea (including 2 mm, 20-h treatments; data not shown), and some nucleoside analogs had no effect (Fig. 1A). The phenotypic effect on the PNC of drugs that disassemble the structure and those that do not is exemplified in Fig. 1B.
TABLE 1.
Maximum tolerated concentrations (MTC) of anti-cancer chemotherapeutics in HeLa and PC-3M cells MTC is the highest dose up to 100 μm that allowed for PNC prevalence determination after 20 h of treatment.
FIGURE 1.
PNC prevalence reduction by clinically used chemotherapeutic anti-cancer drugs after 20 h of treatment at their respective maximum tolerated concentrations. A, one asterisk represents drugs that consistently shrank the remaining PNCs when compared with control, and two asterisks represent drugs that shrank the remaining PNCs to even smaller and nearly undetectable pinpoints (n = 3, error bars = +S.D.). B, cells treated with vehicle, a PNC disassembling drug (cis-platin) or a cytotoxic non-PNC disassembling drug (bleomycin), and then immunofluorescently stained for the polypyrimidine tract-binding protein (PTB), a component of the PNC. Exemplary PNCs are marked with arrowheads. Scale bar = 10 μm. F-Ara-A, 9-β-d-arabinosyl-2-fluoradenine; Ara-A, adenine arabinoside.
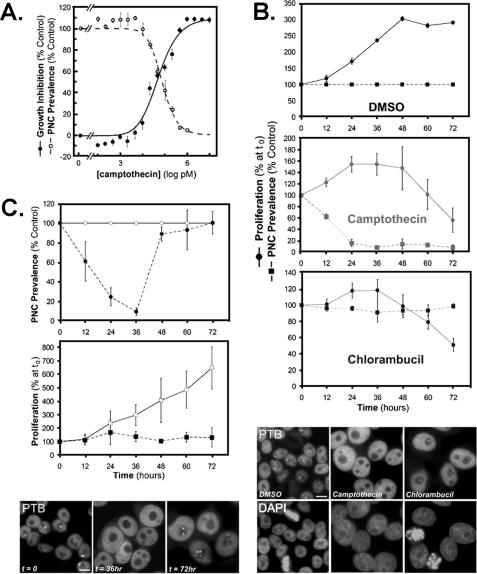
Reduction of PNC Prevalence Can Be Uncoupled from Drug-induced Cytotoxicity and Cell Cycle Block—Cancer drugs are usually cytotoxic or cytostatic to proliferating cancer cells. PNC prevalence reduction parallels the growth inhibition by some of these drugs as exemplified by camptothecin (Fig. 2A), suggesting that PNC prevalence reduction is either due to inhibition of the molecular targets of the drugs or a result of growth inhibition. To distinguish between these possibilities, we compared the PNC prevalence reduction to the growth inhibition by camptothecin (PNC reducing topo I inhibitor) and chlorambucil (non-PNC reducing DNA alkylator). Seventy two hour growth inhibition (GI) curves were created for HeLa cells treated with these drugs, and the [GI99%] was determined from the curves. HeLa cells were then treated for 72 h with this concentration, and PNC prevalence was compared with the proliferation rate at 12-h time points. In both treatments there was a separation of PNC prevalence from growth inhibition. The majority of chlorambucil-treated cells began undergoing apoptosis by the end of 72 h, but the PNC prevalence remained near control levels in the remaining live cells and in some pre-apoptotic cells (Fig. 2B). In comparison, the PNC prevalence in camptothecin-treated cells dropped to nearly 10% of the control while the cells were still proliferating (Fig. 2B). To further validate that PNC prevalence reduction is because of specific molecular actions of compounds, HeLa cells were treated with camptothecin, which is a reversible inhibitor of topo I, at the [GI99%] for 36 h and then allowed to recover for 36 h in the absence of drug. PNC prevalence returns to near control levels within 12 h and fully returns to control levels 36 h after removal of the drug (Fig. 2C). The PNC prevalence recovery is not because of selective proliferation of PNC-positive cells after drug removal but is because of reformation of PNCs because camptothecin induces cell cycle block in late S or G2 phases (12), as demonstrated by the stable cell number after drug removal (Fig. 2C). Other cell cycle blockers such as hydroxyurea (G1/S blocker, Fig. 1A) and various cell cycle blocking kinase inhibitors have no effect on PNC prevalence (data not shown). This result also indicates that the PNC loss in treated cells is not because of interphase cell cycle block.
FIGURE 2.
PNC prevalence reduction by drugs is not due to cytotoxicity and is reversible. A, camptothecin-induced growth inhibition (•) and PNC prevalence reduction (○) at 72 h. PNC prevalence above 1 μm could not be counted because not enough cells remained on the coverslips for staining. Data were fit with one-site dose-response curves. B, top panel, PNC prevalence (▪) and proliferation (•) for vehicle-(1% DMSO), [GI99%] camptothecin-(294 nm), and [GI99%] chlorambucil (297 μm)-treated HeLa cells. Bottom panel, immunofluorescent staining against PTB to mark PNCs in HeLa cells at 72 h of treatment time. DMSO section shows absence of PTB staining in mitotic cells, and chlorambucil section shows the absence of PTB staining in apoptotic cells. C, top panel, PNC prevalence in HeLa cells treated with vehicle (○) and 294 nm camptothecin (•) for 36 h and then replaced with fresh media plus vehicle for 36 h. Middle panel, proliferation of HeLa cells treated with vehicle (□) and 294 nm camptothecin (▪) for 36 h and then replaced with fresh media for 36 h. Bottom panel, HeLa cells treated with camptothecin immunofluorescently stained for PTB at t = 0, 36, and 72 h to mark PNCs. Scale bars = 10 μm, and error bars = ±S.D. (n = 3). Proliferation was determined with the 3-(4,5-dimethylthiazol-2-yl)-5-(3-carboxymethoxyphenyl)-2-(4-sulfophenyl)-2H-tetrazolium, inner salt, assay described under “Materials and Methods.”
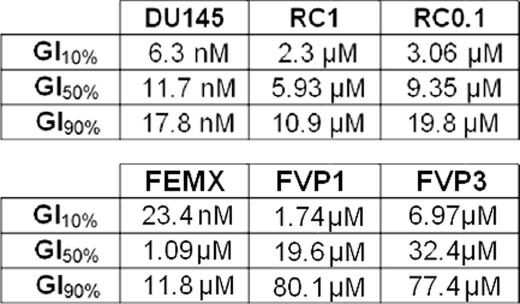
The reversibility of PNC prevalence reduction by camptothecin suggests that PNC reduction induced by this drug is likely due to its on-target inhibition of topo I, because the inhibitory effect of the drug on this enzyme is reversible. In addition, as demonstrated in Fig. 2A, PNC prevalence reduction correlates with the growth inhibition in camptothecin-treated cells, suggesting that the cytotoxic mechanism of the drug (topo I inhibition) is the same as the PNC disassembling mechanism. To test this possibility, camptothecin-resistant cells (RC1 and RC0.1) that contain a mutation in the topo I enzyme (13) and their camptothecin-sensitive parental cells, DU145 (human prostate cancer), were used. The mutant cell lines are 500–1000 times more resistant to camptothecin (Table 2) in accordance with previously published data (13). Therefore, if PNC prevalence reduction by camptothecin is due to off-target effects rather than to topo I inhibition, PNC prevalence should be close to 0% in the mutant cell lines at their respective low growth inhibitory concentrations (i.e. [GI10%]) because these higher concentrations would reduce PNC prevalence to near 0% in the parental line. However, the PNC prevalence reduction in the mutant cells was similar to, or less than, the parental cell line at the same GI concentrations of camptothecin, demonstrating that PNC prevalence reduction by camptothecin is indeed due to the inhibition of topo I (Fig. 3A). A similar approach was used to show that PNC reduction by etoposide is due to inhibition of the topo II enzyme. Etoposide-resistant cell lines (FVP1 and FVP3), which have mutations in the topo II enzyme, and the parental FEMX melanoma cell line were treated with etoposide, and in accordance with previously published data (14), the mutant cell lines are severalfold more resistant to etoposide (Table 2). The PNC prevalence reduction in the mutant cells was similar to, or less than, the parental cell line at the same GI concentrations of etoposide, demonstrating that PNC prevalence reduction by etoposide is due to the inhibition of topo II (Fig. 3B). In addition, methotrexate, which inhibits pyrimidine synthesis through antagonism, is able to reduce PNC prevalence. When folinic acid, which allows cells to overcome inhibition of dihydrofolate reductase by methotrexate, is added to the media along with the methotrexate, it prevents PNC prevalence reduction (Fig. 3C). Thus far, these findings indicate that PNC prevalence reduction by xenobiotics is a result of inhibiting the molecular targets of the compound, rather than nonspecific cytotoxic effects. Therefore, PNC prevalence reduction is a screening marker that will be useful for identifying compounds to investigate the structure and function of the PNC.
TABLE 2.
Growth inhibition (GI) 10, 50, and 90% concentrations of camptothecin/etoposide for the DU145 cell line and its camptothecin-resistant sublines (RC1 and RC0.1) as well as for the FEMX cell line and its etoposide-resistant sublines (FVP1 and FVP3) as determined by the MTS proliferation assay
FIGURE 3.
PNC prevalence reduction by topo I and topo II inhibitors and methotrexate is due to on-target effects. A, 72-h growth inhibition curves were created for camptothecin in the parental DU145 cell line and two clonal DU145 sublines (RC1 and RC0.1), both of which are resistant to camptothecin because of a mutation in the topo I enzyme. The cell lines were treated with camptothecin at the three doses in Table 2 for 72 h, and the PNC prevalence was determined. B, similarly, 72-h growth inhibition curves were created for etoposide in the parental FEMX cell line and two clonal FEMX sublines (FVP1 and FVP3), both of which are resistant to etoposide because of a mutation in the topo II enzyme. The cell lines were treated with etoposide at the three doses in Table 2 for 72 h, and the PNC prevalence was determined. C, 20 μm methotrexate reduces PNC prevalence in HeLa cells, but addition of 100 μm folinic acid in conjunction with methotrexate prevents PNC prevalence reduction. For all experiments error bars =±S.D. (n = 3), and vehicle is 1% DMSO.
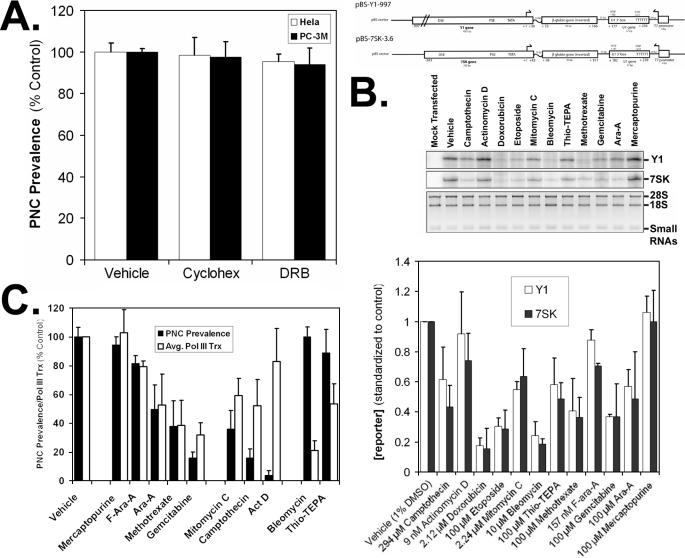
RNA Polymerase III Inhibition Versus PNC Prevalence Reduction by Chemotherapeutic Drugs—Methotrexate inhibits DNA and RNA synthesis, whereas hydroxyurea only inhibits DNA synthesis. Because methotrexate is able to disassemble the PNC and hydroxyurea cannot (Fig. 1), along with the data from Fig. 3C, these data demonstrate that RNA synthesis but not DNA replication is crucial for PNC maintenance. This is consistent with our previous studies in which the integrity of the PNC is dependent upon pol III transcription, but not immediately dependent upon pol I or pol II transcription. Previous observations in cells treated with polymerase inhibitors were made after only 3–5-h treatments (2), and because we treated cells with drugs for 20 h in the present studies, it is not clear whether a prolonged pol I or pol II inhibition can disassemble the PNC. To examine this possibility, HeLa cells were treated with cycloheximide, which indirectly inhibits pol I activity through protein synthesis inhibition, and 5,6-dichloro-1-d-ribofuranosylbenzimidazole, which directly inhibits pol II transcription, for 20 h at the same concentrations used for prior short term treatments (2). Inhibition of pol I (by way of inhibition of protein synthesis) and pol II for 20 h does not affect the PNC prevalence (Fig. 4A), indicating that PNC prevalence reduction by methotrexate is most likely due to pol III inhibition. To further determine the relationship between RNA polymerase III transcription and PNC prevalence, we utilized an RNase protection assay to quantify pol III transcription in drug-treated cells. In this system, HeLa cells are transfected with an untranslatable reporter driven by either the Y1 or 7SK pol III promoters (Fig. 4B) and treated with drugs, and after 20 h the total RNA is isolated for probing in the RNase protection assay. pol III inhibition correlates well (p > 0.05) with the PNC prevalence reduction when cells were treated with the nucleoside analogs and methotrexate (Fig. 4C). Because DNA synthesis inhibition and pol I/II inhibition does not disassemble the PNC, the data demonstrate that PNC reduction by these nucleic acid analogs and anti-metabolites is a result of pol III transcription inhibition.
FIGURE 4.
Association of PNC prevalence reduction with RNA polymerase transcription. A, 20-h inhibition of pol I by cycloheximide (cyclohex) and pol II by 5,6-dichloro-1-d-ribofuranosylbenzimidazole (DRB) does not decrease PNC prevalence in HeLa or PC-3M cells. B, pol III RNase protection assay to quantify the transcription of two separate pol III reporter constructs (nontranslatable β-globin transcript driven by either 7SK or Y1 promoters, top panel = vector maps) in drug-treated HeLa cells. Middle panel, Y1-specific transcript, 7SK-specific transcript, total RNA (28 S/18 S rRNA and small RNAs). The concentration used was either the maximum dose that would allow for enough RNA to be collected for the assay or the [GI99%]. Bottom panel, quantitation of band intensities standardized to an IC value and total RNA for all drugs tested in this assay. C, average band intensities of the 7SK and Y1 reporters compared with the PNC prevalence reduction at the same doses in HeLa cells. For all experiments error bars =±S.D. (n = 3), and the vehicle is 1% DMSO.
Interestingly, not all drugs that reduce PNC prevalence inhibit pol III transcription in parallel. For example, actinomycin D reduces PNC prevalence to near 0% of the control at 9 nm, but only decreases pol III transcription by 18% (p < 0.01), suggesting that it, as well as camptothecin and mitomycin C (p < 0.05), is reducing PNC prevalence, at least in part, through mechanisms other than pol III transcriptional inhibition. In addition, decreased pol III transcription alone does not always correlate with decreased PNC prevalence as demonstrated by the pol III inhibition caused by bleomycin and N,N′,N′-triethylenethiophosphoramide (p < 0.05), neither of which affect PNC prevalence, suggesting that other effects of these drugs are inhibiting the disassembly of the PNC because tagetin, a very specific and direct inhibitor of pol III, has been shown to disassemble the PNC (2).
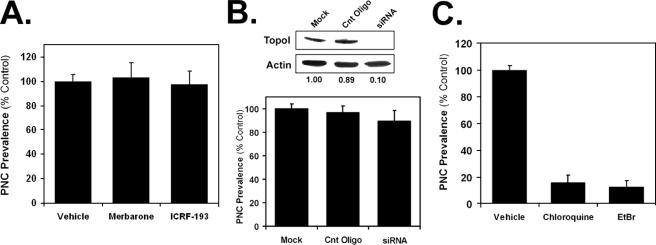
DNA Damage Disassembles the PNC—Topoisomerase inhibiting, DNA cross-linking, DNA-alkylating, and DNA-oxidizing drugs all ultimately cause extensive DNA damage. Therefore, we determined if the DNA damage induced by the PNC-affecting drugs was responsible for PNC disassembly. The topo II-inhibiting drugs, such as etoposide, cause DNA damage as a result of inhibiting topo II in its enzymatic cycle so as to prevent cut DNA from being religated. To determine whether the loss of function of the enzyme or the DNA damage is the cause of PNC disassembly by topo II inhibitors, HeLa cells were treated with merbarone and ICRF-193, which inhibit topo II catalytic activity without inducing DNA damage (15, 16). The results show that neither of these compounds is able to decrease PNC prevalence at their maximum tolerated concentrations (Fig. 5A), demonstrating that the DNA damage rather than the loss of topo II function is responsible for disassembly of the PNC. Topo I inhibitors also induce extensive DNA damage because of the formation of topo I-DNA cleavable complexes. Because there are no known catalytic inhibitors of topo I, the expression of this enzyme was knocked down in PC-3M cells with siRNA. Seventy two hours after siRNA treatment, the level of topo I was reduced to ∼10% (p < 0.01) of the mock transfected cells, but the PNC prevalence was not significantly (p > 0.3) decreased (Fig. 5B), suggesting that the inhibition of topo I does not directly disassemble the PNC, rather the resulting DNA damage or altered DNA structure is responsible.
FIGURE 5.
DNA damage contributes to PNC disassembly. HeLa cells were treated with the maximum tolerated concentrations of two catalytic topo II inhibitors, merbarone (464 μm) and ICRF-193 (100 μm) (A), and with the maximum tolerated concentrations of DNA intercalators, chloroquine (100 μm) and ethidium bromide (EtBr, 10 μm) for 20 h (B). PNC prevalence was then determined (n = 3, error bars =±S.D.). C, siRNA was utilized to knock down the expression of topo I in PC-3M cells (band intensities listed below the immunoblot represent the average from three independent experiments), and after 3 days the PNC prevalence was determined for mock-transfected cells, cells transfected with a negative control oligonucleotide (Cnt oligo), and cells transfected with topo I siRNA (n = 3, error bars =±S.D.).
The clinically used topo II inhibitors can be split into two classes as follows: DNA-intercalative (mitoxantrone, anthracyclines, N-[4-(acridin-9-ylamino)-3-methoxyphenyl]methanesulfonamide, and actinomycin D) and non-DNA-intercalative (epipodophylotoxins) drugs. All of the intercalative inhibitors reduce PNC prevalence to near 0%, whereas the nonintercalative epipodophylotoxins (etoposide and teniposide) modestly reduce PNC prevalence. This suggests that DNA intercalation contributes to the ability of these compounds to disassemble the PNC. To examine this possibility, HeLa cells were treated with chloroquine and ethidium bromide, which intercalate DNA, but are not known to directly inhibit topo II. Both of these compounds significantly (p < 0.001) reduce PNC prevalence, demonstrating that DNA intercalation can disassemble the PNC (Fig. 5C). Molecules can also noncovalently interact with DNA without intercalating the base pairs. Examples of such molecules are the minor groove and major groove binders, distamycin A (17–18) and methyl green (19), respectively. HeLa cells were treated with the maximum tolerated concentrations of these groove binders, and it was found that PNC prevalence is not altered by these agents (data not shown), demonstrating that interference with DNA structure simply by binding the grooves is not sufficient to disassemble the PNC.
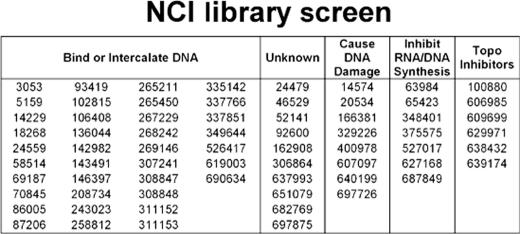
A screen of diversity and mechanistic sets of clinical and experimental anti-cancer drugs for PNC prevalence reduction in HeLa cells by NCI (National Institutes of Health) produced 68 hits from the ∼2,800 compound library, and the described mechanisms of cytotoxic action of these drugs are represented in Table 3. The majority of the hits are topoisomerase inhibitors, DNA intercalators, DNA damagers, and DNA-binding molecules (these groups are not necessarily mutually exclusive). As observed in our initial screen of clinically used drugs (Fig. 1), DNA alkylators and oxidative DNA-damaging compounds do not disassemble the PNC. In addition, low to moderate doses of UV radiation (Fig. 6A), but not high dose γ-irradiation (data not shown), disassemble the PNC. Together, these data demonstrate that PNC disassembly is due to specific forms of DNA damage or base pair intercalation.
TABLE 3.
List of hits (by NSC number) from the screening of mechanistic and diversity sets of NCI of clinically used and experimental anti-cancer compounds and cytotoxic mechanisms of action of the hits as determined by literature and patent searches
FIGURE 6.
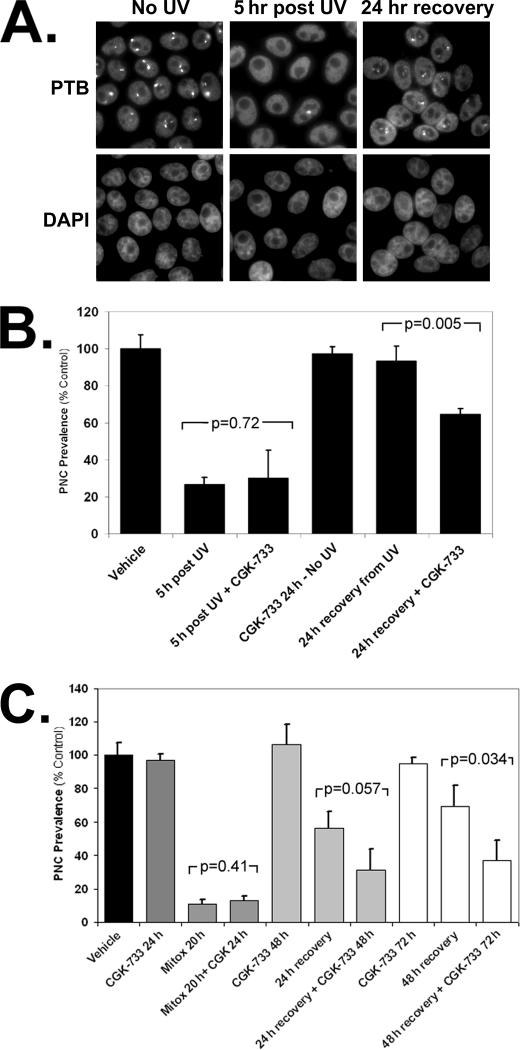
DNA damage itself, not DNA damage repair pathways, is responsible for PNC disassembly. A, immunofluorescent staining to PTB to show PNCs in HeLa cells prior to UV treatment, 5 h post-100 mJ/m2 UV light, and 24 h post 100 mJ/m2 UV light. B, ATM/ATR activity was inhibited in HeLa cells with the small molecule inhibitor CGK-733. Cells were pretreated with 2 μm CGK-733 or vehicle for 4 h, then dosed with 100 mJ/m2 UV light, and returned to CGK-733 or vehicle, and then PNC prevalence was determined 5 and 24 h after UV light treatment. C, HeLa cells were pretreated with 2 μm CGK-733 or vehicle for 4 h, then treated with the [GI99%] (2.01 μm) of mitoxantrone in the presence of 2 μm CGK-733 or vehicle, and then PNC prevalence was determined 20 h after mitoxantrone treatment. Mitoxantrone was then removed, and cells were grown in the presence of 2 μm CGK-733 or vehicle for 24 or 48 h to allow PNC reformation, and the PNC was prevalence was determined (n = 3, error bars =±S.D.).
PNC Prevalence Reduction Is Not Due to DNA Damage Response—To determine whether the activation of the DNA damage-response pathways could be responsible for the disassembly of PNCs, HeLa cells were treated with several DNA damage repair inhibitors, including those against ATM/ATR-CGK-733 (20) (Fig. 6, B and C), DNA protein kinase (PK)-EMD DNA PK inhibitor 1, p53-pififthrin, and base excision repair (BER) pathway inhibitors EMD BER inhibitor (data not shown) 4 h prior to and during 20 h of treatment with PNC-reducing drugs and UV radiation. None of these inhibitors were able to prevent PNC disassembly, suggesting that the known DNA damage-response and -repair pathways are not responsible for the disruption of the PNC by these stimuli. However, inhibition of ATM/ATR, which are upstream DNA damage repair initiating proteins activated by several DNA-damaging stimuli, with CGK-733 prevents the reformation of PNC after DNA damage stimulated by UV radiation (Fig. 6B) or mitoxantrone (Fig. 6C). These results demonstrate that the inhibition of DNA damage repair does not prevent disassembly but does prevent PNC reformation, thereby further demonstrating that the actual DNA damage itself is responsible for PNC disassembly and thus indicating the integrity of the DNA is critical for the maintenance of the PNC.
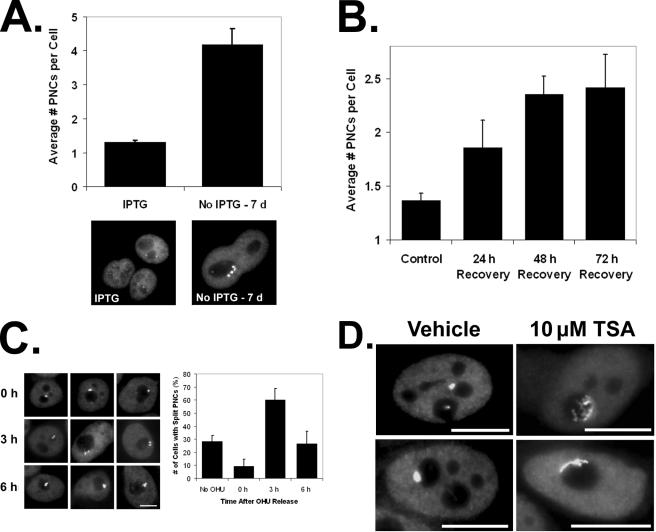
PNC Is Associated with a DNA Locus—The importance of the DNA integrity in the maintenance of the PNC suggests that the PNC is physically associated with DNA and that DNA serves as a nucleation center for the PNC. Consistent with this idea is the heritability of the PNC, in which PNCs in newly divided cells are usually of the same multiplicity and often are spatially mirror images in the daughter cells (1).3 To determine whether the PNC is associated with DNA, we have evaluated the PNC multiplicity in endoreplicating cells. If the PNC is associated with DNA, the number of PNCs should increase in parallel with the number of replication cycles. HT2-19 cells are blocked in G2, by way of a cdk1 conditional mutant, but continue to endoreplicate DNA when under the nonpermissive condition (21). Upon switching to the nonpermissive condition for cdk1 function, cells were allowed to grow for 7 days, and the average number of PNCs per cell more than triples after 7 days of endoreplication (Fig. 7A). When cells are treated with camptothecin, DNA synthesis is prevented and cells stop proliferating (Fig. 2C); however, upon removal of the drug, the cells resume DNA replication once the DNA damage is repaired but are blocked in late S/G2 phase (12). The average number of PNCs per HeLa cell was determined 24, 48, and 72 h after removal of camptothecin and compared with untreated cells. The number of PNCs per cell nearly doubles after 72 h (Fig. 7B), which further indicates the PNC is associated with a DNA locus because the nuclear DNA content is doubled in these cells as well. To further determine whether the PNC is bound to DNA and to initially characterize the locus, we examined whether PNCs have the typical DNA locus behavior during S phase. A given DNA locus often splits into two dots during DNA replication and fuses back into one in G2 because of sister chromatid fusion. We synchronized HeLa cells at the G1/S boundary using hydroxyurea and evaluated whether PNCs would also split into two distinct structures in S phase. Cells at 0 h (G1/S boundary), 3 h (S phase), and 6 h (S/G2 boundary) after release from the hydroxyurea block were immunolabeled with an anti-PTB antibody. The results show that the majority of PNCs split into two distinct, but spatially close, doublet structures 3 h into S phase and begin to reform into a single structure 6 h after release when cells have progressed well into G2 (Fig. 7C). These findings further demonstrate that the PNC nucleates upon a DNA locus, indicate that the association of the RNA-protein complexes in the PNC with the locus is not significantly disrupted during DNA replication, and indicate that the locus replicates at mid S phase. Because the previous results showed that the PNC is nucleated on a DNA locus, we treated cells with a histone deacetylase inhibitor, TSA, to determine whether the PNC structural integrity is sensitive to changes in the epigenetic state of DNA. We found that the PNC is not disassembled by TSA (data not shown), but we did observe that TSA induces a dramatic change in PNC. Normally, the PNC is a semi-round to ovoid structure that appears to “sit” on the nucleolar surface. In PC-3M cells treated with TSA (22), the PNC changes to a flattened nucleolar cap with extended fibrils (Fig. 7D), indicating the extensiveness of the locus and responsiveness of the locus to changes in the epigenetic state of the DNA. Altogether, these findings leave little doubt that PNCs are directly associated with DNA.
FIGURE 7.
PNC is associated with a DNA locus. A, HT2-19 cells (conditional cdk1 knock-out) were grown in the absence of isopropyl β-d-1-thiogalactopyranoside (IPTG) to cause endoreplication of the nuclear DNA for 7 days, and the number of PNCs per cell were scored and compared with non-endoreplicating cells (maintained in isopropyl β-d-1-thiogalactopyranoside). Pictures are of HT2-19 cells stained with PTB antibodies and are both on the same scale. B, HeLa cells were treated with 294 nm camptothecin or vehicle for 24 h and then allowed to recover for varying times in the absence of the drug. The cells were stained with PTB antibodies, and the number of PNCs per cell was determined. See the bottom panel of Fig. 2C for pictures of cells with multiple PNCs after camptothecin recovery. C, HeLa cells were blocked at the S phase with 2 mm hydroxyurea for 24 h and then released from the block. The number of PNCs that consisted of two separate dots and the PNCs that consisted of a single dot were scored at 0, 3, and 6 h after hydroxyurea (OHU) release. A–C, >50 cells scored per trial, and error bars = ±S.D. (n = 3). D, PTB staining to show PNC morphology in PC-3M cells treated with 10 μm TSA (histone deacetylase inhibitor) or vehicle for 20 h. All scale bars = 10 μm, and error bars = ±S.D.
DISCUSSION
The PNC marks the most malignant cells in solid tumors and has the potential to be developed into a novel prognostic marker for several tumor types (10–11). Thus understanding of the PNC biology will not only aid in the understanding of high order nuclear structure and molecular interactions, but it also can lead to novel findings in the field of cancer cell biology and perhaps lead to new pan-cancer therapeutic targets. The PNC is known to be enriched in pol III transcripts and several RNA-binding/processing proteins, suggesting the structure is involved in RNA metabolism (9). However, little is known about the actual structure and function of the PNC. Therefore, here we report the validation of a compound screening approach to analyze the structure and function of the PNC. Using this approach we have discovered novel findings regarding the structure of the PNC, which imply possible functions of the structure. Many anti-cancer drugs effectively disassemble the PNC and do so through their specific molecular actions (Figs. 3, 4, 5) and not through growth inhibition or cytotoxicity (Fig. 2). These findings validate PNC prevalence reduction as screening strategy to identify compounds to be used as chemical tools to complement cell and molecular biology techniques for studying PNC function. This validation will allow for the screening of larger libraries of compounds with diverse biological function, which will likely lead to more novel findings regarding the function of the PNC and its contribution to the malignant phenotype of cancer cells. In future screens, compounds that can disassemble the PNC at nongrowth inhibitory concentrations will be utilized to examine the functional contribution of PNCs in malignancy.
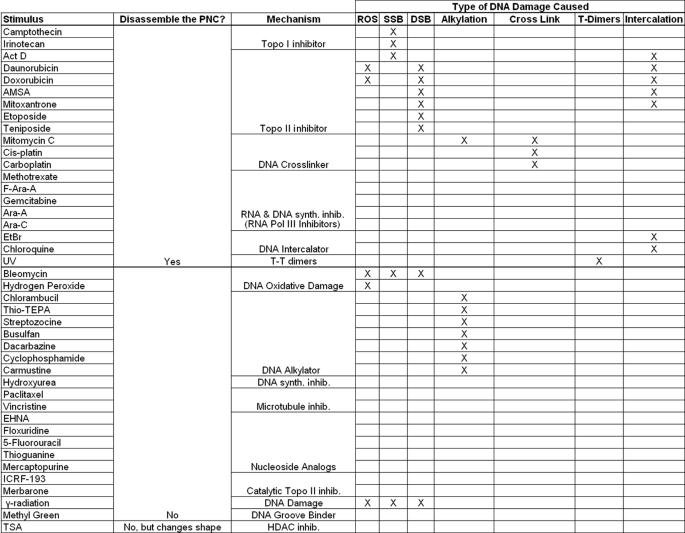
Further analyses of anti-cancer drugs that disassemble the PNC revealed that at least two distinct mechanisms of the drugs disrupt the PNCs as follows: pol III transcription inhibition and DNA damage. We have previously observed that continuous pol III transcription is required for the integrity of the PNC, as PNCs are enriched in newly synthesized pol III RNA (2, 4). In this study, we have demonstrated that the reduction of PNC prevalence is closely associated with the level of pol III transcription inhibition in cells treated with nucleoside analogs and methotrexate with the use of RNase protection assay (Fig. 4). Interestingly, PNC disassembly does not always associate with pol III transcription inhibition, indicating the involvement of other mechanisms important for maintenance of the PNC. For example, actinomycin D significantly reduces PNC prevalence without greatly impacting pol III transcription. Actinomycin D is known to intercalate DNA and cause DNA damage, suggesting DNA integrity is crucial for PNC maintenance. In addition, neither catalytic inhibitors of topo II, which do not cause DNA damage, nor topo I knockdown affect the PNC structure (Fig. 5). This further supports that DNA integrity is crucial to PNC maintenance. To systematically analyze the role of DNA damage in PNC structural integrity, we have examined different classes of DNA-damaging stimuli on the PNC structure and found that a large number of DNA-damaging compounds and UV light cause PNC disassembly (Fig. 6). To evaluate whether the loss of PNC is the result of DNA damage response (DDR), inhibitors of various DDR pathways, such as ATM, were utilized in drug-treated or UV-radiated cells. The results showed that inhibition of DDR does not prevent PNC disassembly, but rather it blocks the recovery of PNCs upon removal of the DNA-damaging stimulus, demonstrating that the structural maintenance of the PNC is dependent upon the integrity of the DNA itself. Furthering this observation is that some DNA-damaging drugs can greatly reduce PNC prevalence without impacting pol III transcription to a proportional extent. All together, these findings reveal the direct association of PNCs with DNA. However, not all types of DNA-damaging/altering stimuli are able to disassemble the PNC (Table 4). Single and double strand breaks, reactive oxygen species, DNA alkylation, and DNA groove binding do not seem to be important for PNC integrity, whereas cross-linking, T-T dimers, intercalation, and the formation topoisomerase-DNA cleavable complexes all disassemble the PNC (Table 4). This suggests that base pairing between the DNA strands and/or the capacity for strand separation, but not the continuity of the DNA strands, are crucial for maintenance of PNC upon its DNA locus. In addition, the finding that histone deacetylase inhibitor TSA, which allows chromatin to be in an accessible or open configuration, changes the PNC into extended and fibril-like structures further supports this idea because the DNA that the PNC is nucleated upon is more accessible to DNA-binding proteins.
TABLE 4.
The effect of drugs and other stimuli on the PNC, their cytotoxic mechanism of action, and the type of DNA damage caused
To evaluate the conclusion that the PNC is associated with a DNA locus, complementary cell biology approaches were utilized. Endoreplication induced by a conditional cdk1 mutant shows a corresponding increase in the number of PNCs per cell (Fig. 7A). After camptothecin removal from HeLa cells, DNA is replicated but the cells remain in late S/G2 phase, and we observed a corresponding doubling in the average number of PNCs per cells (Fig. 7B). Furthermore, the PNC displays a typical DNA locus replication phenotype at mid S phase in HeLa cells (Fig. 7C).3 These findings further confirm that the PNC is nucleated upon a DNA locus that replicates at mid S phase, and the nucleation is not perturbed during replication. Mid S phase replicating DNA loci are generally not the highly expressive euchromatic type. Interestingly, the PNC becomes an extended and fibril-shaped structure in conjunction with the opening of chromatin in cells treated with a histone deacetylase inhibitor (Fig. 7D). The spatial extensiveness of the fibrils suggests that the DNA locus associated with the PNC components could be a large one and can be regulated by histone acetylations. Studies are currently underway to determine the specific locus, the identification of which will most certainly help unravel the function of the PNC.
Based on the current understanding of the PNC, including its enrichment of newly synthesized pol III transcripts, RNA-binding proteins and novel interactions among them (9),3 its heritable nature through cell cycles (1), and our findings in this study, we hypothesize a working model; protein-RNA complexes in the PNC are associated with a DNA locus through two possible mechanisms. First, these complexes may directly interact with the DNA locus and potentially regulate the expression of the locus. Second, the RNA-protein complexes may be associated with the nascent transcripts being synthesized from the locus and regulate these RNAs post-transcriptionally. DNA continuity is not crucial for PNC maintenance, although the interstrand base pairing is, suggesting that the components of the PNC are directly interacting with the DNA. In addition, because DNA strand breakages would likely inhibit the production of nascent transcripts from such a locus and because pol II transcription is not directly important to PNC maintenance, this further supports the idea that the components of the PNC are directly associated with the DNA. Future studies will explore and test this model.
Acknowledgments
We are very thankful for the generosity of our colleagues Dr. Yossi Gruenbaum of the Hebrew University (Jerusalem, Israel) and Dr. Ira Pastan and Dr. Yves Pommier of the National Institutes of Health (Bethesda) for the contribution of reagents used in this work
This work was supported, in whole or in part, by National Institutes of Health Grants GM078555-01A1 (to S. H.), T32CA09560 and T32AG000260 (training grants to J. N.), and 1-RO1-GM79098. This work was also supported by The Robert H. Lurie Comprehensive Cancer Center and from Michigan State University Gene Expression in Development and Disease Initiative (to R. H.). The costs of publication of this article were defrayed in part by the payment of page charges. This article must therefore be hereby marked “advertisement” in accordance with 18 U.S.C. Section 1734 solely to indicate this fact.
Footnotes
The abbreviations used are: PNC, perinucleolar compartment; pol, RNA polymerases; GI, growth inhibition; PTB, polypyrimidine-binding tract protein; TSA, trichostatin A; siRNA, short interfering RNA; PBS, phosphate-buffered saline; topo, topoisomerase; DDR, DNA damage response.
S. Huang, J. T. Norton, and C. Wang, unpublished data.
References
- 1.Huang, S., Deerinck, T. J., Ellisman, M. H., and Spector, D. L. (1997) J. Cell Biol. 137 965–974 [DOI] [PMC free article] [PubMed] [Google Scholar]
- 2.Huang, S., Deerinck, T. J., Ellisman, M. H., and Spector, D. L. (1998) J. Cell Biol. 143 35–47 [DOI] [PMC free article] [PubMed] [Google Scholar]
- 3.Matera, A. G., Frey, M. R., Margelot, K., and Wolin, S. L. (1995) J. Cell Biol. 129 1181–1193 [DOI] [PMC free article] [PubMed] [Google Scholar]
- 4.Wang, C., Politz, J. C., Pederson, T., and Huang, S. (2003) Mol. Biol. Cell 14 2425–2435 [DOI] [PMC free article] [PubMed] [Google Scholar]
- 5.Timchenko, L. T., Miller, J. W., Timchenko, N. A., DeVore, D. R., Datar, K. V., Lin, L., Roberts, R., Caskey, C. T., and Swanson, M. S. (1996) Nucleic Acids Res. 24 4407–4414 [DOI] [PMC free article] [PubMed] [Google Scholar]
- 6.Hall, M. P., Huang, S., and Black, D. L. (2004) Mol. Biol. Cell 15 774–786 [DOI] [PMC free article] [PubMed] [Google Scholar]
- 7.Hüttelmaier, S., Illenberger, S., Grosheva, I., Rüdiger, M., Singer, R. H., and Jockusch, B. M. (2001) J. Cell Biol. 155 775–786 [DOI] [PMC free article] [PubMed] [Google Scholar]
- 8.Kleinhenz, M., Fabienke, S., Swiniarski, N., Wittenmayer, J., Kirsch, B., Jockusch, H., Arnold, H. H., and Illenberger, S. (2005) FEBS Lett. 579 4254–4258 [DOI] [PubMed] [Google Scholar]
- 9.Kopp, K., and Huang, S. (2005) J. Cell Biochem. 95 217–225 [DOI] [PubMed] [Google Scholar]
- 10.Norton, J. T., Pollock, C. B., Wang, C., Schink, J. C., Kim, J. J., and Huang, S. (2008) Cancer 113 861–869 [DOI] [PMC free article] [PubMed] [Google Scholar]
- 11.Kamath, R. V., Thor, A. D., Wang, C., Edgerton, S. M., Slusarczyk, A., Leary, D. J., Wang, J., Wiley, E. L., Jovanovic, B., Wu, Q., Nayar, R., Kovarik, P., Shi, F., and Huang, S. (2005) Cancer Res. 65 246–253 [PubMed] [Google Scholar]
- 12.Li, L. H., Fraser, T. J., Olin, E. J., and Bhuyan, B. K. (1972) Cancer Res. 32 2643–2650 [PubMed] [Google Scholar]
- 13.Urasaki, Y., Laco, G. S., Pourquier, P., Takebayashi, Y., Kohlhagen, G., and Gioffre, C. (2001) Cancer Res. 61 1964–1969 [PubMed] [Google Scholar]
- 14.Campain, J. A., Padmanabhan, R., Hwang, J., Gottesman, M. M., and Pastan, I. (1993) J. Cell. Physiol. 155 414–425 [DOI] [PubMed] [Google Scholar]
- 15.Fortune, J. M., and Osheroff, N. J. (1998) Biol. Chem. 273 17643–17650 [DOI] [PubMed] [Google Scholar]
- 16.Ishida, R., Miki, T., Narita, T., Yui, R., Sato, M., Utsumi, K. R., Tanabe, K., and Andoh, T. (1991) Cancer Res. 51 4909–4916 [PubMed] [Google Scholar]
- 17.Kopka, M., Yoon, C., Goodsell, D., Pjura, P., and Dickerson, R. (1985) Proc. Natl. Acad. Sci. U. S. A. 82 1376–1380 [DOI] [PMC free article] [PubMed] [Google Scholar]
- 18.Portugal, J., and Waring, M. (1987) Eur. J. Biochem. 167 281–289 [DOI] [PubMed] [Google Scholar]
- 19.Kim, S. K., and Nordén, B. (1993) FEBS Lett. 315 61–64 [DOI] [PubMed] [Google Scholar]
- 20.Won, J., Kim, M., Kim, N., Ahn, J. H., Lee, W. G., Kim, S. S., Chang, K. Y., and Yi, Y. W. (2006) Nat. Chem. Biol. 2 369–374 [DOI] [PubMed] [Google Scholar]
- 21.Laronne, A., Rotkopf, S., Hellman, A., Gruenbaum, Y., Porter, A. C., and Brandeis, M. (2003) Mol. Biol. Cell 14 3730–3740 [DOI] [PMC free article] [PubMed] [Google Scholar]
- 22.Yoshida, M., Kijima, M., Akita, M., and Beppu, T. (1990) J. Biol. Chem. 265 17174–17179 [PubMed] [Google Scholar]


