

Abstract
A progressive decline in muscle performance in the rapidly expanding aging population is causing a dramatic increase in disability and health care costs. A decrease in muscle endurance capacity due to mitochondrial decay likely contributes to this decline in muscle performance. We developed a novel stable isotope technique to measure in vivo rates of mitochondrial protein synthesis in human skeletal muscle using needle biopsy samples and applied this technique to elucidate a potential mechanism for the age-related decline in the mitochondrial content and function of skeletal muscle. The fractional rate of muscle mitochondrial protein synthesis in young humans (24 ± 1 year) was 0.081 ± 0.004%·h−1, and this rate declined to 0.047 ± 0.005%·h−1 by middle age (54 ± 1 year; P < 0.01). No further decline in the rate of mitochondrial protein synthesis (0.051 ± 0.004%·h−1) occurred with advancing age (73 ± 2 years). The mitochondrial synthesis rate was about 95% higher than that of mixed protein in the young, whereas it was approximately 35% higher in the middle-aged and elderly subjects. In addition, decreasing activities of mitochondrial enzymes were observed in muscle homogenates (cytochrome c oxidase and citrate synthase) and in isolated mitochondria (citrate synthase) with increasing age, indicating declines in muscle oxidative capacity and mitochondrial function, respectively. The decrease in the rates of mitochondrial protein synthesis is likely to be responsible for this decline in muscle oxidative capacity and mitochondrial function. These changes in muscle mitochondrial protein metabolism may contribute to the age-related decline in aerobic capacity and muscle performance.
Aging is associated with a progressive decline in muscle mass and muscle performance (sarcopenia), characterized by decreased muscle strength and increased muscle fatiguability (1–3). The functional and metabolic consequences of sarcopenia, including reduced endurance capacity, increased risks for falls (and thereby bone fractures), declining mobility, and other disabilities, consume a substantial share of the nation’s health care expenses (4, 5). The mechanisms for the age-related decline in skeletal muscle mass and function remain to be fully defined.
Mitochondrial decay has been observed with aging in different tissues, including skeletal muscle, in both animals and humans (6). This mitochondrial decay includes decreased mitochondrial content, decreased oxidative capacity, decreased enzyme activities, and increased mitochondrial DNA (mtDNA) mutations, proposed to result from oxidative damage (6–8). The decline in mitochondrial content and function impairs muscle oxidative and endurance capacity (9) and is, therefore, likely to contribute to the increase in muscle fatiguability that occurs with aging.
All body proteins, including mitochondrial proteins, are subject to a continuous remodeling process involving synthesis and breakdown (turnover). This process ensures continuous repair and maintenance of the quality of proteins, in addition to production of essential proteins. Decreased protein synthesis rates could either lead to a reduction in the amount of protein if accompanied by unchanged or increased protein breakdown or lead to a reduced quality of the protein if the overall turnover is decreased. Approximately 10% of all mitochondrial proteins are encoded by mtDNA. An age-related increase in mtDNA mutations may, therefore, lead to an overall decreased synthesis of mitochondrial protein or result in synthesis of abnormal proteins, causing impairment of enzyme activities and mitochondrial functions. In vitro experiments in mitochondria isolated from different animal tissues have shown that a decreased protein synthesis rate occurs with aging (10, 11). In vivo measurements of the rate of muscle mitochondrial protein synthesis have not been performed in humans.
The delay in the in vivo measurement of mitochondrial protein synthesis rates is, in large part, due to limitations imposed by the need of sufficiently large muscle samples to perform isotope measurements. To overcome this limitation, we applied a novel MS technology (GC/combustion/isotope ratio mass spectrometry), which requires only a nanomolar amount of amino acids to measure stable isotope enrichment (12). The in vivo rates of mitochondrial protein synthesis could, therefore, be measured in human subjects using needle muscle biopsy samples. In the present study, we validated this new technique using pig muscle and subsequently applied it to determine the effect of aging on mitochondrial protein synthesis in human skeletal muscle. Using the same muscle samples, the activities of two mitochondrial enzymes (citrate synthase and cytochrome c oxidase) were measured in both tissue homogenate and isolated mitochondria to assess muscle oxidative capacity and mitochondrial function. Citrate synthase and cytochrome c oxidase were chosen because of their importance as flux-generating reactions in, respectively, the tricarboxylic acid cycle and the electron transfer chain (13). In addition, citrate synthase is encoded by the nuclear DNA, whereas cytochrome c oxidase is encoded mainly (3 largest subunits out of 13) by mtDNA.
METHODS
Subjects.
Forty-two healthy volunteers (20–92 years old) were studied. They were part of a larger study protocol assessing the mechanism of sarcopenia in aging. Only healthy subjects with normal results from a physical examination and a blood biochemistry analysis to assess kidney and liver functions were included in the study. Postmenopausal women on estrogen replacement, subjects taking β-adrenergic blockers or steroids, and subjects exercising more than two times per week for 20 min or more were also excluded from the study. Detailed subject data is given in Table 1. The subjects were divided into three groups; young (24 ± 1 year), middle age (54 ± 1 year), and old (73 ± 2 years).
Table 1.
Characteristics of subjects in the aging study
| Subjects | Age, years | Weight, kg | Height, cm | BMI, kg·m−2 | Body fat, % | Body muscle mass, % | VO2max, ml·kg−1·min−1 |
|---|---|---|---|---|---|---|---|
| Young | |||||||
| Male (n = 6) | 24 ± 1 | 71.4 ± 4.8 | 173 ± 4 | 23.6 ± 0.7 | 17.7 ± 1.3 | 49.2 ± 0.6 | 51.8 ± 1.8 |
| Female (n = 6) | 24 ± 1 | 57.1 ± 2.7 | 160 ± 2 | 22.2 ± 0.7 | 28.4 ± 2.0 | 39.9 ± 1.2 | 41.1 ± 2.1 |
| Middle-aged | |||||||
| Male (n = 7) | 52 ± 2 | 82.4 ± 5.0 | 177 ± 3 | 26.3 ± 1.3 | 27.0 ± 2.0 | 41.6 ± 1.5 | 30.3 ± 2.0 |
| Female (n = 7) | 55 ± 1 | 68.3 ± 4.4 | 167 ± 2 | 24.4 ± 1.3 | 38.7 ± 3.3 | 34.1 ± 1.2 | 25.5 ± 2.2 |
| Old | |||||||
| Male (n = 7) | 76 ± 3 | 73.4 ± 4.6 | 176 ± 3 | 23.5 ± 0.9 | 25.8 ± 1.9 | 42.6 ± 1.4 | 26.2 ± 2.3 |
| Female (n = 9) | 70 ± 2 | 71.3 ± 3.8 | 163 ± 1 | 26.7 ± 1.4 | 40.7 ± 2.4 | 31.6 ± 1.5 | 20.4 ± 1.3 |
| Age effect P | 0.0001 | 0.0532 | 0.1690 | 0.0530 | 0.0001 | 0.0001 | 0.0001 |
| Gender effect P | 0.5314 | 0.0074 | 0.0001 | 0.9204 | 0.0001 | 0.0001 | 0.0001 |
BMI, body mass index (weight/height2); VO2max, maximal rate of oxygen consumption.
Study Protocol.
Subjects ate a weight-maintaining diet (protein/fat/carbohydrate = 15:35:50) provided by the general clinical research center for 5 days. Maximal rates of oxygen consumption (VO2max) were determined on a treadmill using a modified Balke protocol (14) and were used as an indication of aerobic performance capacity. Body composition was measured using dual x-ray absorptiometry (Lunar model DPX-L, Madison, WI) (15). Whole body muscle mass was calculated from the fat and bone free mass of the four extremities, assuming that 75% of the whole body muscle mass is in the four extremities (16).
All subjects received a standard meal by 10:00 p.m. on the day before the study. A primed continuous infusion of l-[1-13C]leucine (7.5 μmol·kg−1·h−1) was started at 1:00 a.m. and was continued for 10 h (17). Plasma samples were obtained before the infusion and hourly from 5 h (6:00 a.m.) to 10 h (11:00 a.m.) after the infusion was started. Muscle biopsies were taken from the vastus lateralis at 5 and 10 h from different legs as described (17). Muscle samples were immediately frozen in liquid nitrogen and stored at −80°C until analyses.
Isolation of Subsarcolemmal Mitochondria.
Subsarcolemmal mitochondria were isolated from muscle samples based on a previously described procedure (18, 19). A 5% homogenate using 100–150 mg of muscle was prepared in an ice-cold buffer containing 0.25 M sucrose, 2 mM EDTA, and 10 mM Tris·HCl (pH 7.4) using a Potter–Elvehjem homogenizer (Wheaton, Millville, NJ). Samples for analyses of tissue enzyme activities were taken from this homogenate. The mitochondria were isolated by spinning the homogenate at 600 × g (4°C) followed by a 7000 × g (4°C) spin of the obtained supernatant. The pellet, containing the mitochondria, was washed twice using an ice-cold buffer containing 100 mM KCl, 5 mM EGTA, 5 mM MgSO4, 1 mM ATP, and 50 mM Tris·HCl (pH 7.4) and spinning at 7000 × g (4°C). The final mitochondrial pellet was suspended in the sucrose/EDTA/Tris·HCl buffer for further analyses.
Skeletal muscle contains two mitochondrial subpopulations, intermyofibrillar and subsarcolemmal mitochondria (20, 21). The intermyofibrillar mitochondria can only be obtained by using a proteolytic enzyme to release them from the myofibrils. Because the incubation with a proteolytic enzyme interferes with measurements of the rate of synthesis of myofibrillar proteins, we confined our measurements to subsarcolemmal mitochondria. In addition, the subsarcolemmal mitochondria appear to be more sensitive to changes such as in contractile activity (22).
Analyses. Enzyme activities.
Maximal enzyme activities of citrate synthase and cytochrome c oxidase were measured in the tissue homogenate and in the mitochondrial pellet by use of photospectrometric analyses as described (23). Protein concentrations in the tissue homogenate and the mitochondrial pellet were measured using a commercial kit (Detergent Compatible Protein Assay, Bio-Rad). Enzyme activities for each individual were calculated as the mean activity from the two biopsies taken from different legs.
Isotopic enrichments.
Mixed protein was obtained from muscle biopsies as described (24). Both mixed and the mitochondrial protein were hydrolyzed using 6 M HCl (110°C for 18 h). The amino acids in the hydrolyzates were derivatized as their N-heptafluorobutyryl methyl ester (25), and a sample containing approximately 25 ng of leucine was analyzed on a GC/combustion/isotope ratio mass spectrometer (Finigan-MAT, Bremen, Germany) as described (12, 26).
Plasma [13C]ketoisocaproic acid (KIC) enrichment and tissue fluid [13C]leucine enrichment were measured and used as precursor pool enrichment to calculate fractional synthesis rates. Tissue fluid consists of approximately 85% intracellular fluid and 15% extracellular fluid (27). Plasma KIC was extracted from plasma and measured as its quinoxalinol-trimethylsilyl derivative under chemical ionization (25). Tissue fluid amino acids were extracted from muscle tissue using perchloric acid as described (24) and analyzed as their t-butyldimethylsilyl ester derivative (28).
Calculations.
Fractional synthesis rates of mixed and mitochondrial protein were calculated from the increment in [13C]leucine enrichment in the two serial muscle biopsies (E10h − E5h) using the average enrichment of either plasma [13C]KIC or tissue fluid [13C]leucine as the precursor pool enrichment (Ep):
 |
 |
Validation of Methods.
Coefficients of variation of replicate measurements of the enzyme activities and the mitochondrial protein synthesis rates were determined using six muscle samples (100–150 mg) from a pig infused with l-[1-13C]leucine for 4 h (24). Analyses were performed as described above for the human muscle samples. Tissue fluid [13C]leucine enrichment was used as the precursor pool enrichment to calculate fractional rates of mitochondrial protein synthesis. The purity of the mitochondrial pellet was assessed as described (22). Mitochondrial ATPase activity can be specifically inhibited with oligomycin. The percentage of oligomycin-insensitive ATPase activity of the total activity is, therefore, a measure of contamination with nonmitochondrial membrane structures. To assess the purity of the mitochondria, total and oligomycin-inhibited ATPase activities were measured in the mitochondrial pellet of muscle samples from six pigs. Because oligomycin inhibits most of the ATPase activity, large muscle samples are needed to obtain enough total ATPase activity to reliably measure the oligomycin inhibited activity. The needle biopsy samples used in the human subjects were too small to perform this measurement; therefore, two larger human skeletal muscle samples obtained during surgery were analyzed.
Statistics.
All data are presented as mean ± SEM. The groups were compared using two-factor analysis of variance for gender and age. Fractional synthesis rates were compared using one-factor analysis of variance for age because no gender difference was observed. Tukey–Kramer post hoc tests were used to detect significant interactions. Significance was set at P < 0.05.
RESULTS
Subject Data.
The mean age of both men and women was not significantly different in each age group, and no effect of aging on weight and height was observed (Table 1). Both weight and height were lower in female than in male subjects (respectively, P < 0.0074 and P < 0.0001). No differences in body mass index were observed. Women had a higher percentage body fat (P < 0.0001) and a lower percentage of body muscle mass (P < 0.0001) than men in each age group. A increase in body fat (P < 0.0001) and a decrease in muscle mass (P < 0.0001) were observed with aging. VO2max was lower in women than in men when expressed per kilogram of body weight (P < 0.0001) and decreased with age (P < 0.0001). However, no gender differences were observed when VO2max was expressed per kilogram of muscle, whereas the decline (P < 0.0001) with age persisted (Fig. 1).
Figure 1.
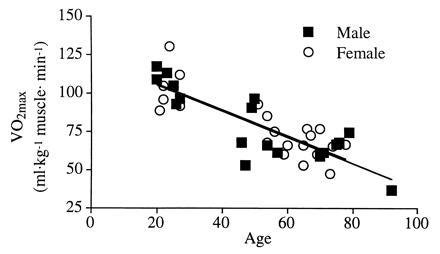
Relationship between VO2max expressed per kilogram of muscle mass and age. In both male (y = −0.85 + 122.3; r2 = 0.72) and female (y = −0.85 + 123.1; r2 = 0.68) subjects, VO2max per kilogram of muscle decreased significantly with age (P < 0.0001).
Validation of Methods.
Coefficients of variation for the measurements performed in pig skeletal muscle are shown in Table 2. All measurements in the pig muscle were in a range similar to those in humans. Oligomycin inhibited total muscle ATPase activity by 92.5 ± 0.8% in the mitochondria isolated from pig muscle, indicating only a minor contamination of the mitochondrial pellet with nonmitochondrial fractions. Mitochondria isolated from the two human muscle samples obtained during surgery showed a similar level of contamination (6.1% and 7.6%). This level of contamination is comparable to other studies (20, 22).
Table 2.
Coefficients of variation (CV) for enzyme analysis, enrichment measurements, and mitochondrial protein synthesis in pig muscle (n = 6)
| Analysis | Mean ± SD | CV, % |
|---|---|---|
| Enzymes | ||
| Tissue activity cytochrome c oxidase, μmol·min−1·g−1 protein | 107 ± 24 | 22 |
| Mitochondrial activity cytochrome c oxidase, μmol·min−1·mg−1 protein | 1.59 ± 0.18 | 11 |
| Tissue activity citrate synthase, μmol·min−1·g−1 protein | 147 ± 26 | 18 |
| Mitochondrial activity citrate synthase, μmol·min−1·mg−1 protein | 0.51 ± 0.04 | 8 |
| Mitochondrial protein | ||
| Protein-bound [13C]leucine enrichment, atom % | 1.09313 ± 0.00016 | 0.015 |
| Protein-bound [13C]leucine enrichment increment, atom % excess | 0.0321 ± 0.0017 | 5 |
| Fractional synthesis rates, %·h−1 | 0.108 ± 0.006 | 6 |
Enzyme Activities.
Cytochrome c oxidase and citrate synthase activity in muscle homogenate (tissue) decreased with age (respectively, P < 0.0044 and P < 0.0109), indicating a decline in skeletal muscle oxidative capacity (Table 3). In addition, cytochrome c oxidase activity was lower in women than in men (P < 0.0176). When tissue activity of cytochrome c oxidase and citrate synthase of both men and women were grouped, age-related decreases (respectively, P < 0.0017 and P < 0.0033) were observed (Fig. 2).
Table 3.
Maximal activities of cytochrome c oxidase and citrate synthase measured in whole muscle homogenate (tissue) and in the isolated mitochondria
| Subjects | Tissue,
μmol·min−1·g−1
protein
|
Mitochondria,
μmol·min−1·mg−1 protein
|
||
|---|---|---|---|---|
| Cytochrome c oxidase | Citrate synthase | Cytochrome c oxidase | Citrate synthase | |
| Young | ||||
| Male (n = 6) | 146 ± 18 | 217 ± 21 | 1.21 ± 0.10 | 0.46 ± 0.05 |
| Female (n = 6) | 107 ± 8 | 211 ± 16 | 1.06 ± 0.14 | 0.44 ± 0.06 |
| Middle-aged | ||||
| Male (n = 7) | 106 ± 10 | 181 ± 20 | 1.08 ± 0.16 | 0.40 ± 0.08 |
| Female (n = 7) | 104 ± 8 | 158 ± 11 | 0.79 ± 0.09 | 0.35 ± 0.05 |
| Old | ||||
| Male (n = 7) | 101 ± 12 | 178 ± 22 | 1.09 ± 0.17 | 0.36 ± 0.02 |
| Female (n = 9) | 80 ± 3 | 153 ± 6 | 0.58 ± 0.04 | 0.27 ± 0.02 |
| Age effect P | 0.0044 | 0.0109 | 0.0657 | 0.0346 |
| Gender effect P | 0.0176 | 0.1911 | 0.0032 | 0.1994 |
Values are expressed per protein content measured in the same samples. Individual numbers are the mean of two muscle biopsies taken from different legs.
Figure 2.
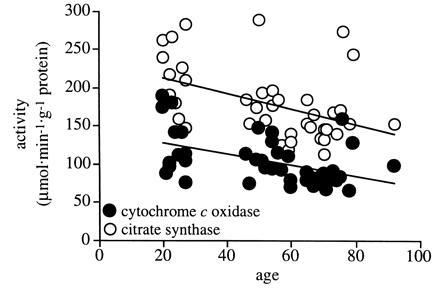
Relationship between tissue (muscle homogenate) activities of cytochrome c oxidase and citrate synthase and age. Male and female subjects are presented as one group for each enzyme. Both activities of cytochrome c oxidase (y = −0.72x + 142.8; r2 = 0.22) and citrate synthase (y = −1.01x + 232.6; r2 = 0.20) decreased significantly with increasing age (respectively, P < 0.0017 and P < 0.0033).
Mitochondrial activity of citrate synthase was also decreased with age (P < 0.0346), indicating a decline in mitochondrial function. Mitochondrial cytochrome c activity was lower in women than in men (P < 0.0032), but the change with age did not reach statistical significance (P < 0.0657).
Mitochondrial Protein Synthesis.
Plasma [13C]KIC, tissue fluid [13C]leucine, and mitochondrial protein-bound [13C]leucine enrichments are given in Table 4. Plasma [13C]KIC and tissue fluid [13C]leucine enrichment remained stable between 5 and 10 h of the isotope infusion (data not shown).
Table 4.
Enrichments of plasma [13C]KIC, tissue fluid [13C]leucine, and mitochondrial protein-bound [13C]leucine measured in the aging study
| Subjects | Plasma [13C]KIC, molar % excess | Tissue fluid [13C]leucine, molar % excess | Protein-bound [13C]leucine, atom % excess |
|---|---|---|---|
| Young | |||
| Male (n = 6) | 5.76 ± 0.19 | 3.72 ± 0.24 | 0.020 ± 0.001 |
| Female (n = 6) | 6.22 ± 0.23 | 5.39 ± 0.11 | 0.028 ± 0.002 |
| Middle-aged | |||
| Male (n = 7) | 6.87 ± 0.25 | 4.21 ± 0.16 | 0.017 ± 0.002 |
| Female (n = 7) | 8.11 ± 0.36 | 5.88 ± 0.52 | 0.016 ± 0.003 |
| Old | |||
| Male (n = 7) | 7.40 ± 0.20 | 5.79 ± 0.16 | 0.018 ± 0.003 |
| Female (n = 9) | 8.20 ± 0.29 | 6.20 ± 0.46 | 0.022 ± 0.002 |
| Age effect P | 0.0001 | 0.0003 | 0.0792 |
| Gender effect P | 0.0007 | 0.0001 | 0.0116 |
Rates of muscle mitochondrial protein synthesis did not differ in men and women in any age groups and were, therefore, treated as one group to demonstrate an age effect (Fig. 3). Fractional rates of muscle mitochondrial protein synthesis were on average 40% lower (P < 0.01) in middle-aged than in young subjects (Table 5 and Fig. 3). No further decrease was observed in the elderly subjects. Directional changes in fractional synthesis rates were similar when either plasma [13C]KIC or tissue fluid [13C]leucine was used as the precursor pool enrichment (Fig. 3). Fractional synthesis rates were higher in all age groups when tissue fluid [13C]leucine was used as the precursor pool instead of plasma [13C]KIC.
Figure 3.
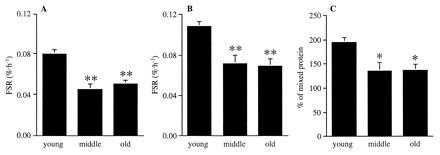
Fractional synthesis rates (FSR) of skeletal muscle mitochondrial protein using plasma [13C]KIC (A) and tissue fluid [13C]leucine (B) as precursor pool enrichment, and as a percentage of mixed protein synthesis rates (C) in young, middle-aged, and old human subjects. Because no gender differences were observed, the male and female subjects are presented as one group. ∗, P < 0.05; ∗∗, P < 0.01 versus young.
Table 5.
Individual fractional rates (%·h−1) of skeletal muscle mitochondrial protein synthesis using plasma [13C]KIC as precursor pool enrichment in young, middle-aged, and old human subjects
| Young | Middle- aged | Old | |
|---|---|---|---|
| 0.080 | 0.057 | 0.060 | |
| 0.062 | 0.019 | 0.030 | |
| 0.081 | 0.058 | 0.059 | |
| 0.078 | 0.055 | 0.072 | |
| 0.064 | 0.078 | 0.042 | |
| 0.078 | 0.037 | 0.035 | |
| 0.086 | 0.049 | 0.066 | |
| 0.106 | 0.019 | 0.031 | |
| 0.083 | 0.036 | 0.053 | |
| 0.078 | 0.050 | 0.050 | |
| 0.093 | 0.070 | 0.035 | |
| 0.022 | 0.047 | ||
| 0.056 | 0.060 | ||
| 0.075 | |||
| 0.057 | |||
| Mean | 0.081 | 0.046 | 0.051 |
| SEM | 0.004 | 0.005 | 0.004 |
Fractional synthesis rates of mixed protein showed the same trend as reported before (29) and were decreased by 12% in the middle aged and old subjects in comparison with the young subjects (young, 0.043 ± 0.002%·h−1; middle-aged, 0.038 ± 0.003%·h−1; old, 0.038 ± 0.003%·h−1). Mitochondrial protein synthesis rates, expressed as a percentage of mixed protein synthesis rates, were also lower (P < 0.05) in both the middle- aged and old subjects in comparison with the young subjects (Fig. 3).
DISCUSSION
The current study demonstrated a substantial decline in the rate of mitochondrial protein synthesis in skeletal muscle with aging. From young to middle age, there was a decrease in mitochondrial synthesis of on average 40%, whereas no further decrease was observed in individuals at the older age. This decrease in the mitochondrial protein synthesis rate is associated with a decline in skeletal muscle oxidative capacity and mitochondrial function.
This study represents the first (to our knowledge) in vivo measurement of mitochondrial protein synthesis in human skeletal muscle. This measurement has been made possible by the application of a novel on-line GC/combustion/isotope ratio mass spectrometer (12, 26), allowing measurement of low isotopic enrichments in small quantities of protein obtained from human needle muscle biopsy samples with a high degree of precision. In vivo fractional rates of mitochondrial protein synthesis were found to be almost twice (1.95 ± 0.09) as high as those of mixed protein in human skeletal muscle. Mitochondrial protein consists, in large part, of enzymes involved in the oxidative energy production (β-oxidation, tricarboxylic acid cycle, electron transfer chain, oxidative phosphorylation). It is, therefore, likely that the high rate of mitochondrial protein synthesis is the result of high turnover rates of these enzymes.
The decreased tissue activities of cytochrome c oxidase and citrate synthase strongly suggests an age-related decrease in oxidative capacity of skeletal muscle (Fig. 2). As both of these enzymes are considered flux-generating enzymes in, respectively, the electron transfer chain and the tricarboxylic acid cycle, decreased activities of these enzymes are more likely to influence the maximal oxidative capacity of skeletal muscle than other enzymes (13). The decreased activity of citrate synthase in the mitochondria indicated that the age-related decline in skeletal muscle oxidative capacity is, most likely, the result of a decline in both mitochondrial content and function. Many other studies have shown an age-related decline in muscle mitochondrial content (8, 30) and function (6, 31–33). The age-related decline in mitochondrial content and function in skeletal muscle is likely to be the result of the decreased rate of mitochondrial protein synthesis.
Calculations of fractional synthesis rates in this study were carried out using both plasma [13C]KIC and tissue fluid [13C]leucine enrichments as precursor pool, because these surrogate measures have been shown to most reliably represent the enrichment of leucyl-tRNA in both pig and human skeletal muscle (24, 34). Both approaches demonstrated decreased mitochondrial protein synthesis rates in human skeletal muscle with aging. A decline in mitochondrial protein synthesis without any change in mitochondrial protein breakdown could explain a decline in mitochondrial enzyme activities. However, concomitant changes in mitochondrial protein degradation may also have occurred and influenced the net mitochondrial protein content. It is intriguing that the mitochondrial enzyme activities continue to decline after middle age, whereas mitochondrial protein synthesis did not decline any further. This may be due to an increased mitochondrial breakdown or an increased damage to mitochondrial protein, leading to decreased enzyme activities at an older age. The decline in synthesis rate clearly demonstrates the inability to regenerate mitochondria and to maintain its functional integrity with aging.
Synthesis rates of mixed muscle protein (representing the average of all muscle proteins) were found to be lower in individuals of 60 years and older in comparison with subjects of less than 30 years (29, 35). This study demonstrates a pronounced decline in the rate of mitochondrial muscle protein synthesis in the middle-aged subjects. However, the percentage of mitochondrial to mixed muscle protein synthesis rate was also decreased with aging, indicating a more pronounced fall in mitochondrial synthesis than the average decline in synthesis rate of all muscle proteins. Decreased protein synthesis rates of mitochondria with aging have been reported in lower organisms (Drosophila) and in liver and kidney of small mammals (10, 11). In contrast, mitochondrial protein synthesis was not decreased in rat liver, testes, heart, brain, intestinal mucosa, lung, and kidney with aging (36). No skeletal muscle mitochondrial protein synthesis rates were measured in any of these studies. Moreover, all these in vitro animal experiments were performed using isolated mitochondria unlike the current in vivo human study. Consequently, these studies do not represent synthesis of all mitochondrial proteins, which together form a functional mitochondrion.
Several studies have reported increased damage of mtDNA in different tissues with aging (6), including human skeletal muscle mitochondria (7, 37). Oxidative damage has been suggested as a potential cause for this age-related increase in mtDNA damage (6, 38). It is conceivable that the increased mtDNA damage is the proximate cause of the decreased synthesis of mitochondrial protein and the consequent decline in muscle mitochondrial content and function with aging. Other possible mechanisms for decreased mitochondrial protein synthesis rates include hormonal changes occurring with aging (e.g., a decrease in growth hormone and insulin-like growth factor I) or a direct effect of decreased physical activity. Exercise training only partially counteracts many aspects of the physical and physiological decline with aging (2), suggesting that both decreased physical activity and biological aging may be involved.
Aging is associated with a progressive decline in VO2 max (14, 39), indicating an age-related decline in aerobic performance capacity. Most of the oxygen consumption takes place in skeletal muscle during heavy exercise. The age-related decline in skeletal muscle mass, however, does not entirely explain the decline in VO2max because this decline persisted even after VO2max was normalized for muscle mass (Fig. 1 and ref. 39). Aerobic performance capacity is most likely determined by functional integrity in respiration, circulation, and muscle metabolism. Part of the age-related decline in aerobic performance capacity may, therefore, result from a decline in the quality of skeletal muscle as reflected in the decreased oxidative capacity. Such an explanation is supported by significant correlations of VO2max per kilogram of muscle with tissue activity of cytochrome c oxidase and citrate synthase (Fig. 4).
Figure 4.
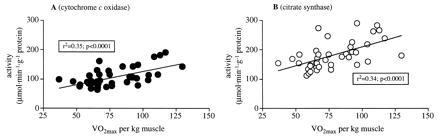
Relationship between VO2max expressed per kilogram of muscle mass and tissue activities of cytochrome c oxidase (A) and citrate synthase (B).
In conclusion, a technique to measure in vivo rates of mitochondrial protein synthesis in human skeletal muscle is described. Applying this technique, an age-related decline in the rate of mitochondrial protein synthesis in human skeletal muscle is demonstrated. This decline of an integral step of the tissue remodeling process is likely to decrease the quality and quantity of mitochondrial proteins. Since a decline in both mitochondrial content and function will impair muscle oxidative or endurance capacity (9), the decreased mitochondrial protein synthesis rates indicate a potential mechanism for the age-related decline in aerobic performance capacity and muscle performance.
Acknowledgments
We gratefully acknowledge the skilled technical assistance of Dawn Morse, Carole Berg, Mai Persson, and Charles Ford and the study coordination by Jody Utton and Maureen Bigelow and helpful suggestions by Drs. Robert Rizza, David Proctor, and Michael Charlton. The study was supported by Public Health Service Grants NIH RO1 AG09531 and RO1 AR41964, and General Clinical Research Centre Grants RR00585 and RR109.
Footnotes
Abbreviations: KIC, ketoisocaproic acid; mtDNA, mitochondrial DNA; VO2max, maximal rate of oxygen consumption.
References
- 1.Davies C T M, Thomas D O, White M J. Acta Med Scand Suppl. 1986;711:219–226. doi: 10.1111/j.0954-6820.1986.tb08954.x. [DOI] [PubMed] [Google Scholar]
- 2.Evans W J. J Gerontol. 1995;50:5–8. doi: 10.1093/gerona/50a.special_issue.5. [DOI] [PubMed] [Google Scholar]
- 3.Hurley B F. J Gerontol. 1995;50:41–44. doi: 10.1093/gerona/50a.special_issue.41. [DOI] [PubMed] [Google Scholar]
- 4.Dutta C, Hadley E C. J Gerontol. 1995;50:1–4. doi: 10.1093/gerona/50a.special_issue.1. [DOI] [PubMed] [Google Scholar]
- 5.Schneider E L, Guralnik J M. J Am Med Assoc. 1990;263:2335–2340. [PubMed] [Google Scholar]
- 6.Shigenaga M K, Hagen T M, Ames B N. Proc Natl Acad Sci USA. 1994;91:10771–10778. doi: 10.1073/pnas.91.23.10771. [DOI] [PMC free article] [PubMed] [Google Scholar]
- 7.Melov S, Shoffner J M, Kaufman A, Wallace D C. Nucleic Acids Res. 1995;23:4122–4126. doi: 10.1093/nar/23.20.4122. [DOI] [PMC free article] [PubMed] [Google Scholar]
- 8.Poggi P, Marchetti C, Scelsi R. Anat Rec. 1987;217:30–34. doi: 10.1002/ar.1092170106. [DOI] [PubMed] [Google Scholar]
- 9.Holloszy J O, Coyle E F. J Appl Physiol. 1984;56:831–838. doi: 10.1152/jappl.1984.56.4.831. [DOI] [PubMed] [Google Scholar]
- 10.Bailey P J, Webster G C. Mech Ageing Dev. 1984;24:233–241. doi: 10.1016/0047-6374(84)90074-5. [DOI] [PubMed] [Google Scholar]
- 11.Marcus D L, Ibrahim N G, Freedman M L. Exp Gerontol. 1982;17:333–341. doi: 10.1016/0531-5565(82)90033-x. [DOI] [PubMed] [Google Scholar]
- 12.Balagopal P, Ford G C, Ebenstein D B, Nadeau D A, Nair K S. Anal Biochem. 1996;239:77–85. doi: 10.1006/abio.1996.0293. [DOI] [PubMed] [Google Scholar]
- 13.Newsholme E A, Start C. Regulation in Metabolism. New York: Wiley; 1973. [Google Scholar]
- 14.Kohrt W M, Malley M T, Coggan A R, Spina R J, Ogawa T, Ehsani A A, Bourey R E, Martin W H, III, Holloszy J O. J Appl Physiol. 1991;71:2004–2011. doi: 10.1152/jappl.1991.71.5.2004. [DOI] [PubMed] [Google Scholar]
- 15.Jensen M D, Kanaley J A, Roust L R, O’Brien P C, Braun J S, Dunn W L, Wahner H W. Mayo Clin Proc. 1993;68:867–873. doi: 10.1016/s0025-6196(12)60695-8. [DOI] [PubMed] [Google Scholar]
- 16.Heymsfield S B, Smith R, Aulet M, Bensen B, Lichtman S, Wang J, Pierson R N., Jr Am J Clin Nutr. 1990;52:214–218. doi: 10.1093/ajcn/52.2.214. [DOI] [PubMed] [Google Scholar]
- 17.Nair K S, Halliday D, Griggs R C. Am J Physiol. 1988;254:E208–E213. doi: 10.1152/ajpendo.1988.254.2.E208. [DOI] [PubMed] [Google Scholar]
- 18.Glatz J F C, Veerkamp J H. Biochim Biophys Acta. 1982;711:327–335. doi: 10.1016/0005-2760(82)90042-x. [DOI] [PubMed] [Google Scholar]
- 19.Van Hinsbergh V W M, Veerkamp J H, Van Moerkerk H T B. Arch Biochem Biophys. 1978;190:762–771. doi: 10.1016/0003-9861(78)90337-5. [DOI] [PubMed] [Google Scholar]
- 20.Cogswell A M, Stevens R J, Hood D A. Am J Physiol. 1993;264:C383–C389. doi: 10.1152/ajpcell.1993.264.2.C383. [DOI] [PubMed] [Google Scholar]
- 21.Fischer J C, Ruitenbeek W, Stadhouders A M, Trijbels J M F, Sengers R C A, Janssen A J M, Veerkamp J H. Clin Chim Acta. 1985;145:89–100. doi: 10.1016/0009-8981(85)90022-1. [DOI] [PubMed] [Google Scholar]
- 22.Krieger D A, Tate C A, McMillin-Wood J, Booth F W. J Appl Physiol. 1980;48:23–28. doi: 10.1152/jappl.1980.48.1.23. [DOI] [PubMed] [Google Scholar]
- 23.Rooyackers O E, Senden J M G, Soeters P B, Saris W H M, Wagenmakers A J M. Eur J Clin Invest. 1995;25:548–552. doi: 10.1111/j.1365-2362.1995.tb01744.x. [DOI] [PubMed] [Google Scholar]
- 24.Baumann P Q, Stirewalt W S, O’Rourke B D, Howard D, Nair K S. Am J Physiol. 1994;267:E203–E209. doi: 10.1152/ajpendo.1994.267.2.E203. [DOI] [PubMed] [Google Scholar]
- 25.Ford G C, Cheng K N, Halliday D. Biomed Mass Spectrom. 1985;12:432–436. doi: 10.1002/bms.1200120814. [DOI] [PubMed] [Google Scholar]
- 26.Yarasheski K E, Smith K, Rennie M J, Bier D M. Biol Mass Spectrom. 1992;21:486–490. doi: 10.1002/bms.1200211004. [DOI] [PMC free article] [PubMed] [Google Scholar]
- 27.Bergström J, Fürst P, Norée L O, Vinnars E. J Appl Physiol. 1974;36:693–697. doi: 10.1152/jappl.1974.36.6.693. [DOI] [PubMed] [Google Scholar]
- 28.Schwenk W F, Berg P J, Beaufrere B, Miles J M, Haymond M W. Anal Biochem. 1984;141:101–109. doi: 10.1016/0003-2697(84)90431-7. [DOI] [PubMed] [Google Scholar]
- 29.Yarasheski K E, Zachwieja J J, Bier D M. Am J Physiol. 1993;265:E210–E214. doi: 10.1152/ajpendo.1993.265.2.E210. [DOI] [PubMed] [Google Scholar]
- 30.Kiessling K H, Pilström L, Karlsson J, Piehl K. Clin Sci (London) 1973;44:547–554. doi: 10.1042/cs0440547. [DOI] [PubMed] [Google Scholar]
- 31.Trounce I, Byrne E, Marzuki S. Lancet. 1989;i:637–639. doi: 10.1016/s0140-6736(89)92143-0. [DOI] [PubMed] [Google Scholar]
- 32.Hansford R G. Biochim Biophys Acta. 1983;726:41–80. doi: 10.1016/0304-4173(83)90010-1. [DOI] [PubMed] [Google Scholar]
- 33.Boffoli D, Scacco S C, Vergari R, Persio M T, Solarino G, Laforgia R, Papa S. Biochim Biophys Acta. 1996;1315:66–72. doi: 10.1016/0925-4439(95)00107-7. [DOI] [PubMed] [Google Scholar]
- 34.Watt P W, Lindsay Y, Scrimgeour C M, Chien P A F, Gibson J N A, Taylor D J, Rennie M J. Proc Natl Acad Sci USA. 1991;88:5892–5896. doi: 10.1073/pnas.88.13.5892. [DOI] [PMC free article] [PubMed] [Google Scholar]
- 35.Welle S, Thornton C, Jozefowicz R, Statt M. Am J Physiol. 1993;264:E693–E698. doi: 10.1152/ajpendo.1993.264.5.E693. [DOI] [PubMed] [Google Scholar]
- 36.Menzies R A, Gold P H. J Biol Chem. 1971;246:2425–2429. [PubMed] [Google Scholar]
- 37.Cooper J M, Mann V M, Schapira A H V. J Neurol Sci. 1992;113:91–98. doi: 10.1016/0022-510x(92)90270-u. [DOI] [PubMed] [Google Scholar]
- 38.Harman D. J Am Geriatr Soc. 1972;20:145–147. doi: 10.1111/j.1532-5415.1972.tb00787.x. [DOI] [PubMed] [Google Scholar]
- 39.Fleg J L, Lakatta E G. J Appl Physiol. 1988;65:1147–1151. doi: 10.1152/jappl.1988.65.3.1147. [DOI] [PubMed] [Google Scholar]