

Abstract
Protein binding sites undergo ligand specific conformational changes upon ligand binding. However, most docking protocols rely on a fixed conformation of the receptor, or on the prior knowledge of multiple conformations representing the variation of the pocket, or on a known bounding box for the ligand. Here we described a general induced fit docking protocol that requires only one initial pocket conformation and identifies most of the correct ligand positions as the lowest score. We expanded a previously used diverse “cross-docking” benchmark to thirty ligand-protein pairs extracted from different crystal structures. The algorithm systematically scans pairs of neighbouring side chains, replaces them by alanines, and docks the ligand to each ‘gapped’ version of the pocket. All docked positions are scored, refined with original side chains and flexible backbone and re-scored. In the optimal version of the protocol pairs of residues were replaced by alanines and only one best scoring conformation was selected from each ‘gapped’ pocket for refinement. The optimal SCARE (SCan Alanines and REfine) protocol identifies a near native conformation (under 2Å RMSD) as the lowest rank for 80% of pairs if the docking bounding box is defined by the predicted pocket envelope, and for as many as 90% of the pairs if the bounding box is derived from the known answer with ~5 Å margin as used in most previous publications. The presented fully automated algorithm takes about two hours per pose of a single processor time, requires only one pocket structure and no prior knowledge about the binding site location. Furthermore, the results for conformationally conserved pockets do not deteriorate due to substantial increase of the pocket variability.
Keywords: Scanning Docking, Cross Docking, ICM, Internal Coordinate Mechanics, Induced Fit, Receptor Flexibility, Drug Binding, Structure Based Drug Design
Introduction
Ligand docking is a well established computational technique that has been successfully employed in medicinal chemistry to assist drug discovery and lead optimization efforts [1]. The aim of ligand docking is to find the binding pose of a small organic molecule in a receptor pocket, and, if multiple ligands are compared, an estimate of the ligand binding affinity, referred to as the docking score. Several conformational search algorithms and scoring functions have been proposed and their performances have been compared and reviewed [2; 3]. However, most of the comparisons have been performed for the pocket conformations from the complexes with cognate ligands, so called self-docking, thus avoiding the critical problem of overcoming the obstacle of specific ligand-induced conformational changes, a.k.a. the induced fit [4]. Unfortunately, when such a change occurs, neither the ligand pose nor the meaningful binding score can be calculated if the ligand in question induces a pocket rearrangement that is incompatible with the initial pocket geometry.
Figure 1 illustrates the difference between a completely artificial and frequently misleading self-docking and a realistic cross-docking test. Since the soft docking algorithm of Jiang and Kim [5], several attempts have been made to include the induced fit effect in a highly automated and general-purpose protocol [6; 7; 8]. If the diversity of possible conformations is well covered by multiple experimental structures, the multiple receptor conformers docking (MRC) is a natural extension to a single rigid receptor docking. Multiple receptor conformations can be retrieved from NMR [9] or X-ray diffraction studies [10]. Several crystals can be employed to calculate average potential grids to be later employed in ligand docking [11]. Other approaches combinatorially merge flexible parts of different protein structures to generate new conformations [12]. Huang and Zou have proposed an ensemble docking procedure that, after an optimization step, automatically selects the structure where the ligand best fits [13]. When several experimental structures are not available, multiple conformations can be generated by means of computational methods like molecular dynamics simulations [14; 15; 16], relevant normal modes analysis [17], and stochastic pseudo-Brownian and internal coordinate (ICM) sampling [18]. Later the receptor flexibility was introduced into docking and virtual screening with a more complex protocol based on the ICM stochastic optimizer [19]. Their protocol was tested on 33 members of four different protein kinase families and its efficacy was assessed both in terms of docking accuracy and of enrichment factors. Zhao and Sanner encoded the receptor conformational space as a variable for genetic algorithm [20]. Their test set mainly consisted of Hiv protease – inhibitor co-crystals. Sherman et al. developed a procedure where rigid receptor docking and protein modelling are combined to independently sample ligand and receptor degrees of freedom [21]. After a first soft potential docking simulation, the receptor structure is optimized around the tentative ligand poses. The protein conformations from the best scoring complexes are employed in a second docking run. This time a hard potential function is used. Twenty one complexes, encompassing 20 ligands co-crystallized at the binding site of 11 different proteins, were included in the validation benchmark. A ligand pose with RMSD below 2 Å from the crystal provided the best ranking solution in 18 out of 21 examples. Meiler and Baker extended to ligand docking the previously reported ROSETTADOCK [22] protein – protein docking algorithm [23]. The ligand flexibility was represented by a set of discrete conformations while the side chains are explicitly sampled during a Monte Carlo optimization. A backbone-dependent rotamer library was used in the calculations. Twenty cross docking runs were carried out on 18 structures of 8 different proteins. The best scoring solution had an RMSD lower than 2 Å in 14 examples. However, the reported RMSD values are artificially lower and incompatible with other publications since they included not only the ligand atoms but also the binding pocket side chains atoms.
Figure 1. Cartoon representation of a cross docking experiment.

(a) different co-crystals of the same protein display the so called induced fit effect; (b) limitations of a rigid receptor cross docking protocol; (c) real life expectations from a flexible receptor cross docking protocol.
Almost all those docking protocols were tested on small and hand-picked cross-docking benchmarks. The difficulty of those benchmarks was not carefully quantified. Secondly, any enhanced docking protocol introducing new variables, such as receptor variations, or water molecule positions, while solving some difficult cases, may result in a worse overall performance in cases where such variation is not an issue. That effect needs to be monitored. Finally, the influence of the “known answer” in the form of (i) the bounding box defined by the correct ligand pose or (ii) the knowledge of which parts of the proteins are flexible deduced from multiple receptor structures including those close or identical to the correctly induced ones, were not fully eliminated.
In this paper we presented a new induced fit docking algorithm, nicknamed SCARE, which docks a ligand to receptor structure or a model by homology represented by a single conformer. The algorithm used no prior information about the ligand binding geometry, pocket location, preferred bounding box, ligand covalent geometry, locations or extent of the flexible receptor regions. Only the best rank prediction was considered. The performance of the SCARE algorithm was evaluated on a diverse set of 30 cross docking ligand-receptor pairs, and was compared with a single static receptor ICM docking procedure.
Results and Discussion
The outline of the algorithm
The SCARE algorithm is built on top of well established and optimized ICM docking and scoring algorithm to a single static receptor [24; 25; 26]. The SCARE algorithm is based on the following general scheme:
produce multiple variants of the receptor pocket (e,g, gapped versions of a single pocket conformer);
dock a flexible ligand to each of the variants of the receptor pocket and record one or several (up to 5) best scored poses; geometrically cluster them and select best scoring position from each cluster;
restrain the ligand for each of the unique ligand poses and globally optimize the receptor pocket around its pose (geometrically redundant poses are eliminated before refinement);
re-score all optimized ligand-receptor pairs and select the top scoring pose.
In this general form the algorithm can be applied to both multiple known receptor conformations or to a single receptor conformation combined with a receptor variant generation algorithm. That may include combinations of both experimental and generated variants.
The key additional features of the SCARE algorithm are the following.
1) The unbiased determination of the bounding box and pocket residues
Not all binding pockets are fully enclosed cavities with a fixed volume. Most frequently the site is relatively open and extended in several directions. Furthermore, we did not want to rely on any knowledge about the binding site of other ligands since in some cases no single binder is known, in the other, the binding locations of different ligands may differ substantially. Therefore, determining the extent of the binding pocket and, consequently, the extent of the bounding box for the grid potential becomes a critical determinant of the docking success. If the box is too small or shifted the failure is guaranteed, if it is too large, the chances of success diminish with the size. Here we used our previously published Lennard-Jones-convolution method [27; 28] to determine the bonding box and the residues under consideration. All the residues with at least one side chain non-hydrogen atom in the range of 3.0 Å from the generated mesh were considered part of the pocket.
2) The Alanine Scanning
To alter each experimental starting conformation, instead of producing different conformers for side-chains or backbone as in [21], we generated a variety of “gapped” receptor pocket models in which parts of the pockets were systematically omitted. The expectation was that in at least one of the models the main obstacle for the correct positioning of the ligand was removed, while the remaining “ungapped” part of the pocket was still able to position it correctly.
In a general form of the algorithm the gaps may include single side-chains, multiple side-chains, loops, and parts of the backbone; in this paper, we tested three scenarios: single, dual, and triple residues alanine scanning. To eliminate combinatorial explosion of the number of combinations for dual and triple alanines we noticed that it is sufficient to mutate only one group of proximal side-chains at a time. Rather than randomly scattered couples or triplets, mutations concentrated in a very specific sub-region were more likely to redefine the binding pocket steric profile significantly enough to affect the outcome of the docking simulations.
In Figure 2, the effect of a double mutation on the steric profile of a binding site is described. In the receptor structure extracted from the PPARγ – Rosiglitazone co-crystal (PDBid: 2PRG), the pocket was too small to properly accommodate the agonist G1262570; the residues Phe310 and Phe391 blocked a small lipophilic region that was available in the reference structure (PDBid: 1FM9). A single rigid receptor cross docking simulation could not possibly reproduce the experimental binding mode (Figure 2a). When the hampering residues were mutated into alanine, the pocket shape was modified enough for the extra region to become available and a near native conformation of the bigger agonist could be sampled (Figure 2b).
Figure 2. Effect of alanine scanning during posing.
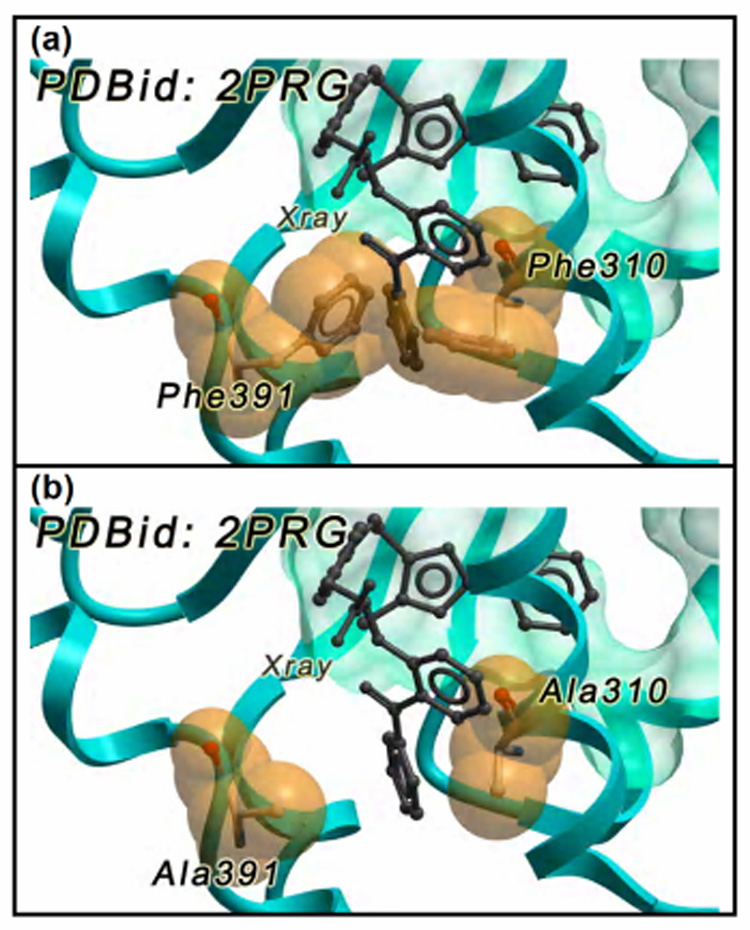
(a) the experimental binding mode of the inhibitor G1262570 (grey) cannot be reproduced because of the conformation adopted by Phe310 and Phe391; (b) the dual mutation into alanine removes the steric hindrance and thus the ligand can be accommodated.
3) The Full Pocket Refinement
The unique top-scoring ligand poses were restrained in a full side-chain pocket model and underwent a refinement procedure. The refinement was mainly focused on the receptor flexibility. While the ligand was strongly tethered during the whole procedure, the pocket residues were actively optimized for both side-chain and the backbone. After the refinement, a re-scoring was performed. Re-scoring was based on a version of the standard ICM scoring function modified as to include the receptor contributions at the free energy of binding [19; 29; 30].
Figure 3 schematically summarizes the SCARE stepwise process.
Figure 3. A schematic outline of the SCARE docking algorithm.

Analysis of the benchmark
The presented benchmark is, to best of our knowledge, the only cross docking test set to include structures from as many as 16 different proteins. The complete list of structures is reported in Table 1.
Table 1.
List of the crystallographic structures included in the cross docking benchmark.
| Protein | UniProt | PDB | Res. (Å) | Ligand Name | Ligand Function |
|---|---|---|---|---|---|
| Aldose Reductase | Q5U031 | 2ACR | 1.7 | Apo Structure | |
| 2FZB | 1.5 | Tolrestat | Inhibitor | ||
| Anti-Steroid Fab’ | A0A5D7 | 1DBA | 2.8 | Apo Structure | |
| 1DBB | 2.7 | Progesterone | Antigen | ||
| CDK2 | P24941 | 1AQ1 | 2.0 | Staurosporine | Inhibitor |
| 1DM2 | 2.1 | Hymenialdisine | Inhibitor | ||
| COX-2 | Q05769 | 1CX2 | 3.0 | SC-588 | Inhibitor |
| 3PGH | 2.5 | Flurbiprofen | Inhibitor | ||
| Estrogen Receptor | P03372 | 1ERR | 2.6 | Raloxifene | SERM |
| 3ERT | 1.9 | 4-Hydroxytamoxifene | SERM | ||
| Factor Xa | P00742 | 1KSN | 2.1 | FXV673 | Inhibitor |
| 1XKA | 2.3 | FX2212-A | Inhibitor | ||
| GSK-3 β | P49841 | 1Q4L | 2.7 | I–5 | Inhibitor |
| 1UV5 | 2.8 | 6-Bromoindirubin-3’-Oxime | Inhibitor | ||
| Hiv1 RT | P04585 | 1C1C | 2.5 | TNK-6123 | Inhibitor |
| 1RTH | 2.2 | 1051U91 | Inhibitor | ||
| JNK3 | P53779 | 1PMN | 2.2 | Compound 1 | Inhibitor |
| 1PMV | 2.5 | Compound 4 | Inhibitor | ||
| LXR β LBD | P55055 | 1P8D | 2.8 | 24(S),25-Epoxycholesterol | Agonist |
| 1PQ6 | 2.4 | GW3965 | Agonist | ||
| Neuroaminidase | P27907 | 1A4Q | 1.9 | Dihydropyran-phenethyl-propyl-carboxamide 5d | Inhibitor |
| 1NSC | 1.7 | O-Sialic Acid | Inhibitor | ||
| P38 Kinase | Q16539 | 1BMK | 2.4 | SB218655 | Inhibitor |
| 1DI9 | 2.6 | 4-anilinoquinazoline 3 | Inhibitor | ||
| PKA | P00517 | 1STC | 2.3 | Staurosporine | Inhibitor |
| 1YDS | 2.2 | H8 | Inhibitor | ||
| PPARγ | P19793 | 1FM9 | 2.1 | G1262570 | Agonist |
| 2PRG | 2.3 | Rosiglitazone | Agonist | ||
| TK | P06479 | 1KI4 | 2.3 | 5-Bromothienydeoxyuridine | Inhibitor Endogenous |
| 1KIM | 2.1 | Deoxythymidine | Substrate | ||
| Trypsin | P00760 | 1PPC | 1.8 | NAPAP | Inhibitor |
| 1PPH | 1.9 | 3-TAPAP | Inhibitor | ||
A detailed comparative analysis of the cross-docking pairs in our benchmark was performed and the actual challenge posed by each pair could be directly measured by the dissimilarity of the binding sites. For each cross-docking pair, the ligand-binding site was identified as the set of all residues with at least one non hydrogen atom within 3 Å from the mesh of the ligand experimental pose. The size of the binding site was ranging from 13 to 29 residues, with the mean value of 19 residues.
To evaluate the magnitude of the induced fit, the rigid cores of the binding sites in the receptor and the reference structures were superimposed. This was done by means of a procedure that iteratively down-weighted the contributions from the more flexible regions. After superimposition, the average RMSD between the binding regions of the receptor and reference structures was found to be 0.56 Å for backbone atoms and 1.32 Å for all non-hydrogen atoms. The number of residues that displayed above-average displacement for the given pair was always comparatively low, never more than four amino acids.
In Table 2, the RMSD values are reported for each pair of structures. The residues whose RMSD was over 1 Å higher than the pocket average and the residues that in the receptor adopted a conformation that would lead to a clash with the ligand native conformation, are listed explicitly. A clash is originated when one or more non hydrogen atoms of a residue lie within 1 Å from the ligand. A close inspection of this data suggested that the differences between the selected structures were mainly due to a few specific side chains displacements and very limited backbone movements rather than extended loop transitions and domain motions. Furthermore, the clashing residues were not scattered around the pocket but they rather tended to cluster, spatially reshaping a very specific sub-region.
Table 2.
Description and comparison of the benchmark binding sites; residues with at least one side chain heavy atom in the range of 3.0 Å from the ligand are listed
| Protein | Receptor PDB.Chain | Reference PDB.Chain | N. of Residues | Pocket RMSD (Å) a | Highly Displaced Residues b | Clashing Residues c |
|---|---|---|---|---|---|---|
| AR | 2ACR.a | 2FZB.a | 16 | 1.4 (0.6) | F123, L301 | F123, L301 |
| Anti-Steroid Fab’ | 1DBA.l,h | 1DBB.l,h | 17 | 1.5 (0.4) | W100 | W100 |
| CDK2 | 1AQ1.a | 1DM2.a | 17 | 1.3 (0.5) | H84 | |
| 1DM2.a | 1AQ1.a | 22 | 1.7 (0.8) | H84, Q131, L148 | I10 | |
| COX-2 | 1CX2.a | 3PGH.a | 17 | 0.9 (0.4) | R106 | |
| 3PGH.a | 1CX2.a | 22 | 1.1 (0.5) | F504 | ||
| ER | 1ERR.a | 3ERT.a | 23 | 1.4 (1.1) | E419, G420, M421, L525 | |
| 3ERT.a | 1ERR.a | 24 | 1.3 (0.5) | M421, L525, L539 | ||
| Factor Xa | 1KSN.a | 1XKA.c | 20 | 0.9 (0.3) | Y319 | |
| 1XKA.c | 1KSN.a | 22 | 0.8 (0.3) | Q416 | ||
| GSK-3 β | 1Q4L.a | 1UV5.a | 18 | 1.1 (0.4) | R141 | |
| 1UV5.a | 1Q4L.a | 20 | 1.7 (1.2) | G65, S66, R141, Q185 | ||
| Hiv1 RT | 1C1C.a,b | 1RTH.a,b | 17 | 1.7 (0.9) | W816, P823 | K688 |
| 1RTH.a,b | 1C1C.a,b | 18 | 1.6 (0.8) | K689, W816, P823 | ||
| JNK3 | 1PMN.a | 1PMV.a | 15 | 1.5 (0.6) | I124, M146 | |
| 1PMV.a | 1PMN.a | 24 | 1.5 (0.8) | I124, M146 | M146 | |
| LXR β LBD | 1P8D.a | 1PQ6.b | 30 | 1.5 (0.7) | L330, I353 | F340 |
| 1PQ6.b | 1P8D.a | 26 | 1.4 (0.6) | I353 | R319 | |
| Neuroaminidase | 1A4Q.a | 1NSC.a | 18 | 0.6 (0.3) | E274 | |
| 1NSC.a | 1A4Q.a | 20 | 0.6 (0.3) | E274 | E274 | |
| P38 Kinase | 1BMK.a | 1DI9.a | 16 | 1.8 (0.7) | M109 | |
| 1DI9.a | 1BMK.a | 19 | 2.0 (0.7) | I84, M109 | ||
| PKA | 1STC.e | 1YDS.e | 16 | 1.5 (0.8) | T184, F328 | |
| 1YDS.e | 1STC.e | 22 | 1.9 (0.9) | F55, F328 | F328 | |
| PPARγ | 1FM9.d | 2PRG.a | 21 | 1.5 (0.5) | F310, F391 | |
| 2PRG.a | 1FM9.d | 30 | 1.5 (0.6) | E287, F310, Q314, F391, L481 | F310, Q314, F391 | |
| TK | 1KI4.a | 1KIM.a | 15 | 1.1 (0.2) | Y101, Y132, Y172 | |
| 1KIM.a | 1KI4.a | 17 | 0.9 (0.2) | Y101, Y132 | Y132 | |
| Trypsin | 1PPC.e | 1PPH.e | 16 | 1.1 (0.1) | Q194 | |
| 1PPH.e | 1PPC.e | 19 | 1.1 (0.1) | Q194, Y226 |
RMSD from the reference structure of all the binding pocket heavy atoms; RMSD for the backbone atoms is shown in parenthesis.
Residues with RMSD over 1 Å higher than the pocket average.
residues that in the receptor adopted a conformation that would lead to a clash with the ligand (one or more non hydrogen atoms of the residue lie within 1 Å from the ligand).
Cross docking to a single receptor conformer
There were two objectives of this exercise. First, we needed to establish the ability and extent of a single receptor conformation docking procedure to tolerate the induced fit distortions and optimize the parameters of the single pocket ICM protocol for better performance; the resulting performance also reflected the difficulty of the benchmark. Second, we needed to establish a baseline performance to make sure that the introduction of dozens of pocket variations does not lead to the drop in the performance for those simpler cases.
We used the grid docking protocol implemented in ICM [24; 25; 26], in which the ligand binding site at the receptor is represented by pre-calculated potential grid maps, and the van der Waals potential is modified to reduce the repulsive part of the standard 6–12 Lennard-Jones equation. The binding region location was assumed to be known, defined by all the residues with at least one side chain non-hydrogen atom in the range of ~5.0 Å from the ligand experimental conformation. The protocol was tested with two different cut-off values for the repulsive part of van der Waals energy: 4 Kcal/mol and 1 Kcal/mol.
When a 4 Kcal/mol truncated potential was considered, a near-native pose was found at rank one in 12 out 30 cases (40% success rate). In 11 more cases a near-native pose was found among top 20 solutions but was not ranked first, while in the 7 remaining cases, no pose close to the crystallographic binding mode was selected.
When the van der Waals potential was capped at a more permissive level of 1 Kcal/mol, the results improved. A near native pose could be sampled and assigned the most favorable score in 15 of 30 cases (50% success rate – see for example Figure 4a). In 10 of the remaining 15 cases, a near native structure could be sampled but it was not assigned the best score (Figure 4b). In 5 cases, the crystallographic ligand pose could never be found (even with very high scores) in a cross-docking run. This was due to the side chain conformation of at least one residue being significantly different from the reference structure (Figure 4c). Table 3 summarizes the cross-docking performance of the single rigid receptor docking protocol.
Figure 4. Three possible outcomes in a single cross grid docking experiment.
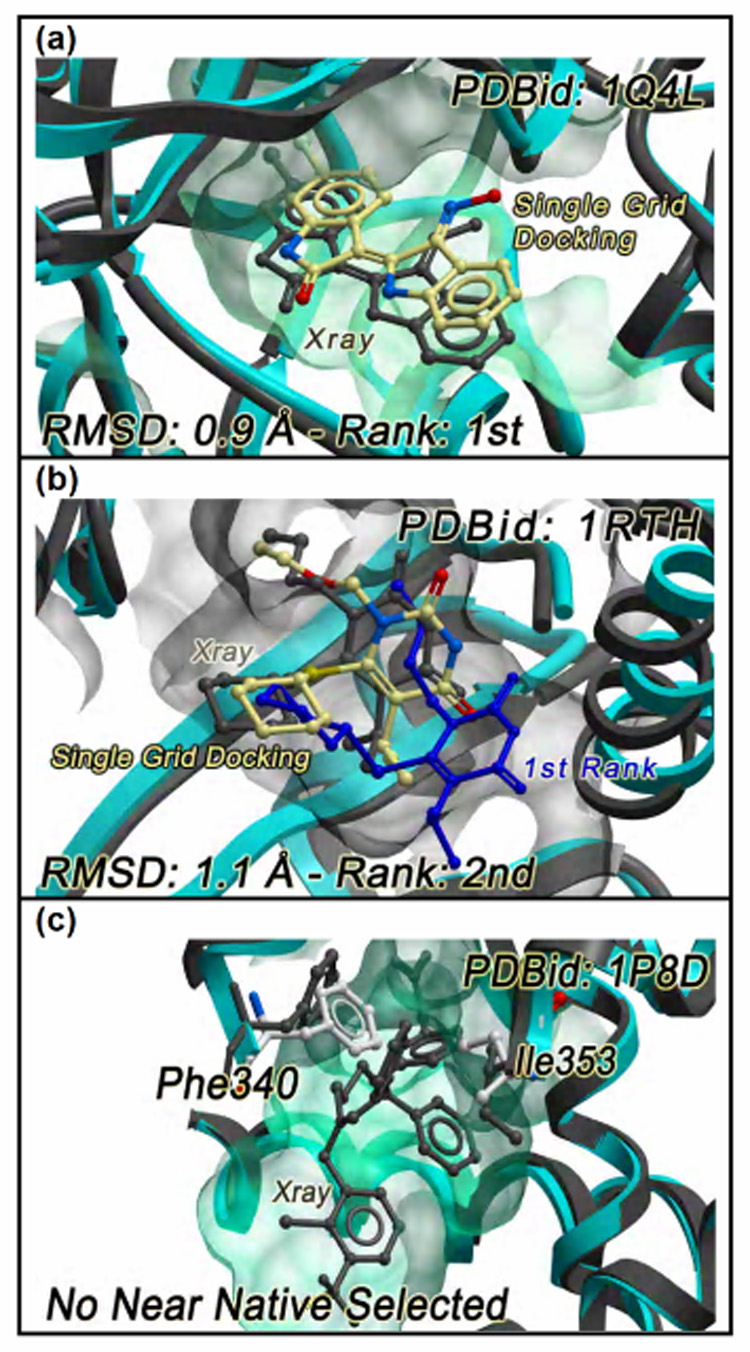
(a) the experimental pose of the 6-Bromoindirubin-3’-Oxime inhibitor at the binding site of GSK-3β can be correctly reproduced and ranked first according to the energy scoring; (b) the experimental pose of the inhibitor TNK-6123 at the binding site of Hiv1 RT can be correctly reproduced but it is not assigned the top scoring position; (c) the displacement of the Phe340 side chain prevents the selection of any near native pose of the inhibitor GW3965 at the binding site of LXRβ ligand binding domain. The ligand experimental poses are reported in grey, those predicted by single cross grid docking are coloured by atom types.
Table 3.
The ICM cross docking results with a single pocket conformer (the pocket boundaries are defined by all the residues within ~5 Å from the ligand experimental pose).
| VDWMAX4.0 | VDWMAX1.0 | |||||
|---|---|---|---|---|---|---|
| Protein | Receptor PDB | Ligand PDB | First Near Native RMSD (Å) a | First Near Native Rank | First Near Native RMSD (Å) a | First Near Native Rank |
| AR | 2ACR | 2FZB | NNNS | 34 | NNNS | 45 |
| Anti-Steroid Fab’ | 1DBA | 1DBB | NNNS | 18 | NNNS | 19 |
| CDK2 | 1AQ1 | 1DM2 | 0.6 | 2/15 | 0.6 | 2/18 |
| 1DM2 | 1AQ1 | 1.5 | 2/19 | 1.4 | 1/27 | |
| COX-2 | 1CX2 | 3PGH | 0.9 | 1/15 | 1.6 | 1/14 |
| 3PGH | 1CX2 | 1.0 | 1/11 | 1.0 | 1/19 | |
| ER | 1ERR | 3ERT | 1.4 | 1/8 | 1.8 | 1/7 |
| 3ERT | 1ERR | 1.3 | 5/10 | 1.3 | 5/11 | |
| Factor Xa | 1KSN | 1XKA | 1.3 | 2/34 | 1.3 | 1/66 |
| 1XKA | 1KSN | 1.1 | 8/41 | 2.0 | 19/25 | |
| GSK-3 β | 1Q4L | 1UV5 | 1.0 | 1/15 | 0.9 | 1/18 |
| 1UV5 | 1Q4L | 2.0 | 5/49 | 1.5 | 3/54 | |
| Hiv1 RT | 1C1C | 1RTH | 1.0 | 1/19 | 1.2 | 9/15 |
| 1RTH | 1C1C | 1.0 | 2/25 | 1.1 | 2/21 | |
| JNK3 | 1PMN | 1PMV | 0.5 | 1/10 | 0.4 | 1/11 |
| 1PMV | 1PMN | NNNS | 40 | NNNS | 53 | |
| LXR β LBD | 1P8D | 1PQ6 | NNNS | 21 | NNNS | 30 |
| 1PQ6 | 1P8D | 0.6 | 2/11 | 0.8 | 1/14 | |
| Neuroaminidase | 1A4Q | 1NSC | 1.1 | 1/79 | 0.6 | 1/87 |
| 1NSC | 1A4Q | 1.0 | 2/25 | 1.4 | 2/31 | |
| P38 Kinase | 1BMK | 1DI9 | 1.3 | 1/29 | 1.3 | 1/35 |
| 1DI9 | 1BMK | 1.6 | 1/23 | 1.6 | 1/25 | |
| PKA | 1STC | 1YDS | 1.2 | 2/30 | 1.6 | 2/40 |
| 1YDS | 1STC | NNNS | 28 | 0.6 | 12/26 | |
| PPARγ | 1FM9 | 2PRG | NNNS | 32 | 1.7 | 1/24 |
| 2PRG | 1FM9 | NNNS | 29 | NNNS | 33 | |
| TK | 1KI4 | 1KIM | 0.8 | 1/26 | 0.7 | 1/32 |
| 1KIM | 1KI4 | 1.7 | 2/37 | 0.6 | 2/39 | |
| Trypsin | 1PPC | 1PPH | 0.6 | 1/48 | 0.7 | 1/54 |
| 1PPH | 1PPC | 0.8 | 1/58 | 1.7 | 1/77 | |
RMSD value and rank of top scoring near native conformations are reported in bold; NNNS stands for No Near Native Structure among all high scoring ligand poses retained by the ICM grid docking procedure.
Therefore, for one half of the cross-docking runs the near native pose was not the best scoring one, and for one third of those cases it was never even found the already “softened” single grid docking protocol. To overcome this limitation the variations of that initial receptor pocket needed to be considered.
Scanning alanines through the pocket residues
In order to overcome the limitations imposed by the rigid structure approach, a protocol based on multiple generated receptor variants was developed. The key idea of this step of the procedure stems from the GAP approach used in [31]. It established that having no atoms (hence removing all side-chain atoms except Cb) for a part of the environment of the currently optimized element (e.g. side chain or a ligand) may be preferred over trying out different conformers for that part of the environment. Here we propose to generate multiple pockets variants by systematically removing clusters of side chain atoms. The cluster may be represented by a single side chain (code ‘S’ for single), two neighboring side chains (code ‘D’ for dual), three neighboring side chains (code ‘T’ for triple) and the combinations of ‘S’,’D’ and ‘T’ (code ‘A’ all) (see Table 4 for details). Table 5 shows the small numbers of scans for each pocket. Cross-docking the ligand to all pocket variants dramatically improved the results with most of the hit collection protocols. We tested each protocol to find the optimal combination of the scanning method and the number of retained top hits from each docking run.
Table 4.
Codes for the compared SCARE protocols defining the number of alanines in a scanned group and the number of top solutions selected from each grid docking for all atom refinement.
| Level 1 | |
|---|---|
| AA | Results from All Alanine mutation grid docking runs are considered for refinement |
| SA | Only results from Single Alanine mutation grid docking runs are considered for refinement |
| DA | Only results from Dual Alanine mutation grid docking runs are considered for refinement |
| TA | Only Results from Triple Alanine mutation grid docking runs are considered for refinement |
| Level 2 | |
| 1 | Only one best ranking solution from each pocket variant is selected for refinement |
| 3 | Three best ranking solutions from each pocket variant are selected for refinement |
| 5 | Five best ranking solutions from each pocket variant are selected for refinement |
| Example: | When the SA3 protocol is employed, the best three ranking solutions from each Single Alanine grid docking run are collected for refinement. |
Table 5.
The performance of the DA1 protocol: total number of poses to refine and fraction of near native poses among them.
| Protein | Receptor PDB | Ligand PDB | Total Grid Docking Runs | Number of Poses to Refine | Number of Near Native Poses | % of Near Native Poses |
|---|---|---|---|---|---|---|
| AR | 2ACR | 2FZB | 32 | 20 | 1 | 5.0 |
| Anti-Steroid Fab’ | 1DBA | 1DBB | 6 | 5 | 2 | 40.0 |
| CDK2 | 1AQ1 | 1DM2 | 7 | 2 | 1 | 50.0 |
| 1DM2 | 1AQ1 | 13 | 7 | 2 | 28.6 | |
| COX-2 | 1CX2 | 3PGH | 21 | 7 | 6 | 85.7 |
| 3PGH | 1CX2 | 27 | 8 | 5 | 62.5 | |
| ER | 1ERR | 3ERT | 26 | 23 | 15 | 65.2 |
| 3ERT | 1ERR | 28 | 10 | 2 | 20.0 | |
| Factor Xa | 1KSN | 1XKA | 5 | 5 | 2 | 40.0 |
| 1XKA | 1KSN | 14 | 8 | 3 | 37.5 | |
| GSK-3 β | 1Q4L | 1UV5 | 13 | 1 | 1 | 100.0 |
| 1UV5 | 1Q4L | 18 | 7 | 2 | 28.6 | |
| Hiv1 RT | 1C1C | 1RTH | 13 | 8 | 1 | 12.5 |
| 1RTH | 1C1C | 13 | 8 | 2 | 25.0 | |
| JNK3 | 1PMN | 1PMV | 8 | 2 | 2 | 100.0 |
| 1PMV | 1PMN | 17 | 14 | 2 | 14.3 | |
| LXR β LBD | 1P8D | 1PQ6 | 60 | 60 | 5 | 8.3 |
| 1PQ6 | 1P8D | 42 | 30 | 5 | 16.7 | |
| Neuroaminidase | 1A4Q | 1NSC | 31 | 8 | 6 | 75.0 |
| 1NSC | 1A4Q | 34 | 26 | 6 | 23.1 | |
| P38 Kinase | 1BMK | 1DI9 | 7 | 4 | 1 | 25.0 |
| 1DI9 | 1BMK | 14 | 8 | 4 | 50.0 | |
| PKA | 1STC | 1YDS | 9 | 3 | 2 | 66.7 |
| 1YDS | 1STC | 21 | 15 | 1 | 6.7 | |
| PPARγ | 1FM9 | 2PRG | 25 | 17 | 8 | 47.1 |
| 2PRG | 1FM9 | 42 | 34 | 2 | 5.9 | |
| TK | 1KI4 | 1KIM | 25 | 9 | 3 | 33.3 |
| 1KIM | 1KI4 | 25 | 20 | 1 | 5.0 | |
| Trypsin | 1PPC | 1PPH | 11 | 4 | 2 | 50.0 |
| 1PPH | 1PPC | 11 | 10 | 5 | 50.0 | |
| AVERAGE VALUES | Total Grid Docking Runs | Number of Poses to Refine | Number of Near Native Poses | % of Near Native Poses | ||
| 20.6 | 13.7 | 3.3 | 39.2 | |||
Table 4 contains a brief definition of each assembling protocol. The individual performance of each assembling protocol was assessed considering the average results among the thirty complexes in the benchmark. The AA and the DA protocols, no matter how many top scoring conformations were retrieved, always provided at least one near native conformation for every complex in the benchmark (Figure 5a). Among those, DA1 and AA1 were the protocols that provided the higher fraction of near native conformations, 36.7 % and 35.5 % among the total poses to refine, respectively (Figure 5b). However, adopting DA1 as the assembling protocol, one might expect an average lower number of poses to refine, namely 12.2, rather than the 17.6 returned by AA1 (Figure 5c). The SA and TA protocols did not improve the quality of the final results when combined together with the dual alanine runs.
Figure 5. Comparison of different method to select the poses for refinement.

(a) success rate of each method at including at least one near native conformation for each receptor in the benchmark; (b) average fraction of near native conformations among all the poses to refine provided by the six 100% successful methods; (c) average number of poses to refine provided by the six 100% successful methods.
In light of the above results, the ensemble of ligand poses provided by DA1 (scanning pairs of interacting side chains and retaining only the top hit for clustering and refinement) was selected to undergo the refinement procedure. A clustering procedure was used to reduce the geometrical redundancy of the set. The heavy atom ligand pose RMSD cut-off distance was set equal to 1.0 Å. Table 5 demonstrates that the number of ligand poses needed to be refined is now relatively small (median of 13.7). As we expected, the near native ligand poses were now found for all 30 cross docking tasks.
Ligand poses after full receptor refinement
A near native conformation could always be selected among the ten best ranking positions if the bounding box for docking was derived from the residues surrounding the correct ligand position and expanded by 5 Å (a common practice, e.g. [3] ). In as many as 27 out of 30 cases, the correct binding mode was predicted by the best ranking pose. In the remaining three difficult cases, the first near native conformation achieved the third, fifth, and sixth rank, respectively. Seven cross docking pairs that could not be ranked first after the single receptor grid docking received rank 1 after refinement and rescoring. For example, in single receptor grid docking, the first near native structure of FXV673 at the binding site of the coagulation factor Xa (PDBid: 1XKA) was predicted with a poor binding score and placed at the nineteenth position of the final ranking (Figure 6a). The SCARE protocol both improved the geometrical accuracy and resulted in the top rank for the correct pose (Figure 6b). In five examples where the single receptor protocol could not identify the near native pose at all, the alanine mutation protocol generated near-native conformations. For example, the experimental structure of the inhibitor Compound 1 at the binding site of JNK3 (Figure 6c) could be accurately predicted and assigned the best binding score (Figure 6d) with the full SCARE protocol. Both single docking and SCARE protocols could correctly reproduce the binding mode of the inhibitor I-5 at the binding site of GSK3-B (PDBid: 1UV5) and that of the inhibitor 1051U91 at the binding site of the Hiv1 reverse transcriptase (PDBid: 1C1C). However, both protocols failed at assigning them the top binding score. Finally, while the single receptor docking protocol could correctly reproduce the binding mode of the 4-anilinoquinazoline at the binding site of P38 kinase (PDBid: 1BMK) and assign it the best score, the first near native conformation was ranked third by the SCARE protocol.
Figure 6. Improved results due to the SCARE protocol.

(a) docking the inhibitor FXV673 at the pocket of Factor Xa, the best result that can be achieved employing the single rigid receptor docking is a high energy pose with a RMSD of 2.0 Å; (b) optimizing the position of Gln416 side chain, the alanine mutation protocol provide a top scoring conformation of the inhibitor with RMSD as low as 0.6 Å; (c) the displacement of the Met146 side chain prevents the selection of any near native pose of the Compound 1 inhibitor at the binding site of JNK3; (d) optimizing the position of Met146 side chain, the alanine mutation protocol provide a top scoring conformation of the inhibitor with 1.1 Å RMSD. The ligand experimental poses are reported in grey, those predicted by the SCARE docking algorithm are coloured by atom types.
The results of the SCARE docking are summarized in Table 6. The proposed protocol clearly outperformed the single receptor docking for both simple and hard tasks: it was always able to provide at least a near native conformation among the top ten positions during the posing phase and the success rate in terms of top-ranked conformations rose from 50% to 90%.
Table 6.
The SCARE docking results (the pocket boundaries are defined by all the residues within ~5 Å from the ligand experimental pose).
| Protein | Receptor PDB | Ligand PDB | First Near Native RMSD (Å) a | First Near Native Rank |
|---|---|---|---|---|
| AR | 2ACR | 2FZB | 1.3 | 1 |
| Anti-Steroid Fab’ | 1DBA | 1DBB | 0.6 | 1 |
| CDK2 | 1AQ1 | 1DM2 | 0.6 | 1 |
| 1DM2 | 1AQ1 | 1.4 | 1 | |
| COX-2 | 1CX2 | 3PGH | 0.8 | 1 |
| 3PGH | 1CX2 | 0.9 | 1 | |
| ER | 1ERR | 3ERT | 2.0 | 1 |
| 3ERT | 1ERR | 1.5 | 1 | |
| Factor Xa | 1KSN | 1XKA | 1.2 | 1 |
| 1XKA | 1KSN | 0.6 | 1 | |
| GSK-3 β | 1Q4L | 1UV5 | 0.8 | 1 |
| 1UV5 | 1Q4L | 1.8 | 5 | |
| Hiv1 RT | 1C1C | 1RTH | 1.0 | 6 |
| 1RTH | 1C1C | 1.1 | 1 | |
| JNK3 | 1PMN | 1PMV | 0.9 | 1 |
| 1PMV | 1PMN | 1.1 | 1 | |
| LXR β LBD | 1P8D | 1PQ6 | 1.8 | 1 |
| 1PQ6 | 1P8D | 1.3 | 1 | |
| Neuroaminidase | 1A4Q | 1NSC | 1.4 | 1 |
| 1NSC | 1A4Q | 0.6 | 1 | |
| P38 Kinase | 1BMK | 1DI9 | 1.2 | 3 |
| 1DI9 | 1BMK | 1.6 | 1 | |
| PKA | 1STC | 1YDS | 1.2 | 1 |
| 1YDS | 1STC | 0.7 | 1 | |
| PPARγ | 1FM9 | 2PRG | 1.8 | 1 |
| 2PRG | 1FM9 | 1.3 | 1 | |
| TK | 1KI4 | 1KIM | 1.3 | 1 |
| 1KIM | 1KI4 | 0.6 | 1 | |
| Trypsin | 1PPC | 1PPH | 0.6 | 1 |
| 1PPH | 1PPH | 1.7 | 1 |
RMSD value and rank of top scoring near native conformations are reported in bold. A near native solution predicted as the top best rank in 90%, within six top ranks in 100%.
The effect of the bounding box on the SCARE algorithm performance
The size and location of the bounding box for the docking simulation may have a profound effect on the docking performance even with a generous margin of 5 Å, especially for relatively open binding sites. However, the usual practice in benchmark calculations was to use the correct ligand pose to deduce the bounding box. In an attempt to simulate a truly unbiased situation in which no assumptions are made about the binding pose for a particular ligand, we used the largest envelope predicted by the Pocketome Gaussian Convolution algorithm [27] applied to the initial receptor conformation to define the bounding box.
In most cases, the experimental pocket and the predicted pocket overlapped without significantly affecting the “correct” ligand volume (Figure 7a). In several structures, the two pockets overlapped almost completely except for a comparatively low number of amino acids that remained specific of one pocket or the other (Figure 7b). This situation was expected when the receptor and the reference structure differed only because of a bulky side chain that adopted a different conformation. However, when the ligand was bound at a very specific sub-region of a bigger cavity, the predicted pocket volume was much greater than the experimental pocket one (Figure 7c). Finally, only in the two Thymidine Kinase structures, the experimental pocket and the predicted pocket perfectly matched (Figure 7d).
Figure 7. Comparison between experimental pocket and predicted pocket.
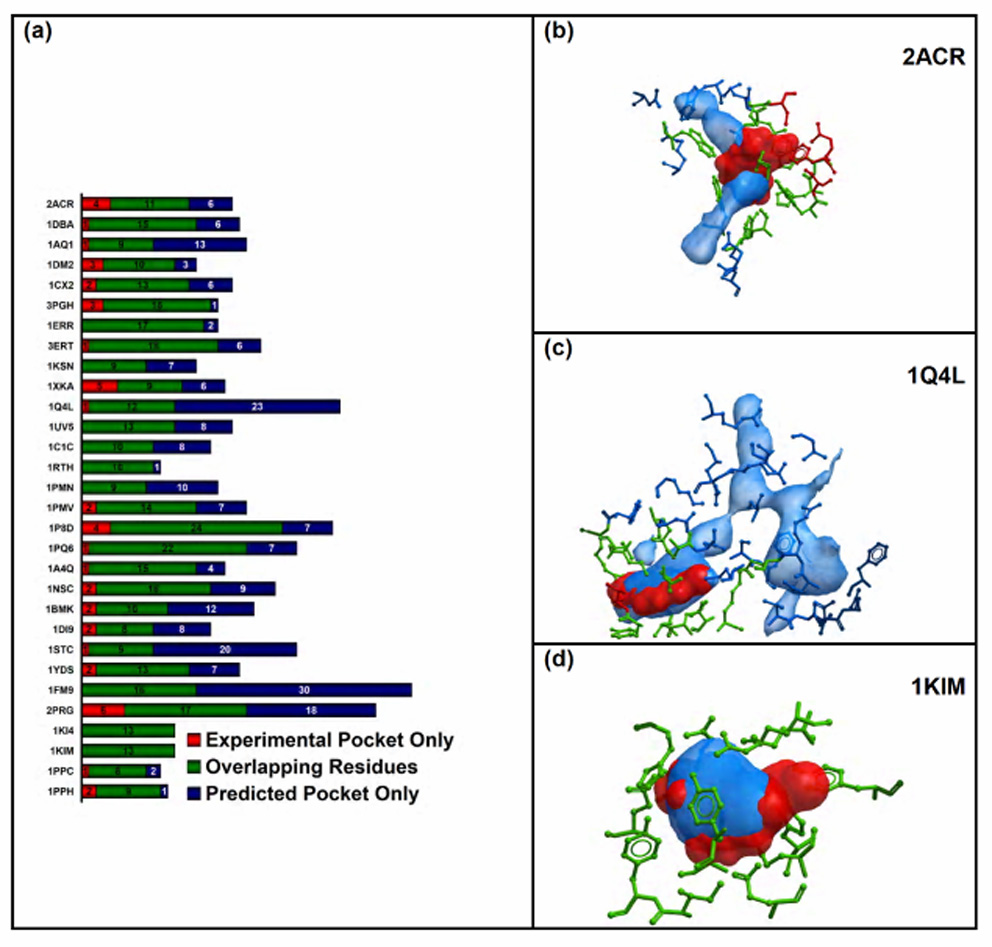
(a) relative number of amino acids that define the two pockets; the residues that define only the experimental pocket, the overlapping ones, and those that define only the predicted pocket, are represented by the red, the green, and the blue portion of the bar, respectively; (b) comparison of the experimental (red) and predicted (blue) binding pocket of Aldose Reductase; the residues that define only the experimental pocket, the overlapping ones, and those that define only the predicted pocket, are represented in red, green, and blue, respectively; (c) comparison of the experimental (red) and predicted (blue) binding pocket of GSK-3β ; the residues that define only the experimental pocket, the overlapping ones, and those that define only the predicted pocket, are represented in red, green, and blue, respectively; (d) comparison of the experimental (red) and predicted (blue) binding pocket of Thymidine Kinase; all the residues (green) overlap.
The single rigid receptor docking was not deeply influenced by the use of the predicted bounding box (see Table 7). The van der Waals potential truncated at 4.0 Kcal/mol runs provided 13 correct predictions, 11 cases a near native conformation was not ranked among the twenty best positions, and 6 cases where no near native conformation was found. The more permissive potential truncated at 1.0 Kcal/mol provided better results: 14 correct predictions and only 5 cases with no near-native ligand conformation. Again, in 11 cases a near native conformation was found but it was not ranked in the top position. The binding mode of the 4-anilinoquinazoline at the binding site of the p38 kinase (PDBid: 1BMK) was affected by the unbiased box definition. Similarly, the first near native conformation of the inhibitor 3-TAPAP at the Trypsin binding site (PDBid: 1PPC) was ranked second. Surprisingly, in case of the inhibitor H8 bound to PKA (PDBid: 1YDS) we observed a reversed picture.
Table 7.
The ICM cross docking results with a single pocket conformer using the predicted binding pocket and bounding box and different softness levels.
| VDWMAX4.0 | VDWMAX1.0 | |||||
|---|---|---|---|---|---|---|
| Protein | Receptor PDB | Ligand PDB | First Near Native RMSD (Å) a | First Near Native Rank | First Near Native RMSD (Å) a | First Near Native Rank |
| AR | 2ACR | 2FZB | NNNS | 46 | NNNS | 46 |
| Anti-Steroid Fab’ | 1DBA | 1DBB | NNNS | 18 | NNNS | 21 |
| CDK2 | 1AQ1 | 1DM2 | 0.8 | 2/14 | 0.8 | 2/13 |
| 1DM2 | 1AQ1 | 1.5 | 13/30 | 0.6 | 1/25 | |
| COX-2 | 1CX2 | 3PGH | 1.0 | 1/15 | 0.9 | 1/14 |
| 3PGH | 1CX2 | 0.9 | 1/15 | 0.7 | 1/14 | |
| ER | 1ERR | 3ERT | 1.8 | 1/5 | 1.6 | 1/5 |
| 3ERT | 1ERR | 1.4 | 4/10 | 1.5 | 6/10 | |
| Factor Xa | 1KSN | 1XKA | 1.3 | 1/50 | 1.2 | 1/48 |
| 1XKA | 1KSN | NNNS | 33 | 1.8 | 12/44 | |
| GSK-3 β | 1Q4L | 1UV5 | 1.3 | 1/16 | 1.2 | 1/18 |
| 1UV5 | 1Q4L | 1.6 | 2/50 | 0.9 | 14/55 | |
| Hiv1 RT | 1C1C | 1RTH | 1.0 | 1/28 | 1.2 | 9/16 |
| 1RTH | 1C1C | 1.0 | 3/26 | 0.9 | 2/23 | |
| JNK3 | 1PMN | 1PMV | 0.7 | 1/10 | 0.6 | 1/13 |
| 1PMV | 1PMN | NNNS | 40 | NNNS | 51 | |
| LXR β LBD | 1P8D | 1PQ6 | NNNS | 23 | NNNS | 39 |
| 1PQ6 | 1P8D | 0.5 | 1/17 | 0.7 | 1/26 | |
| Neuroaminidase | 1A4Q | 1NSC | 0.5 | 1/94 | 0.5 | 1/83 |
| 1NSC | 1A4Q | 0.9 | 3/20 | 1.5 | 6/28 | |
| P38 Kinase | 1BMK | 1DI9 | 1.4 | 3/36 | 1.5 | 3/38 |
| 1DI9 | 1BMK | 1.9 | 2/22 | 2.0 | 1/22 | |
| PKA | 1STC | 1YDS | 1.2 | 2/35 | 1.6 | 2/40 |
| 1YDS | 1STC | 1.3 | 1/50 | 1.3 | 1/45 | |
| PPARγ | 1FM9 | 2PRG | 1.5 | 1/36 | 1.8 | 1/50 |
| 2PRG | 1FM9 | NNNS | 50 | NNNS | 56 | |
| TK | 1KI4 | 1KIM | 0.8 | 1/26 | 0.8 | 1/33 |
| 1KIM | 1KI4 | 1.2 | 3/42 | 1.8 | 2/40 | |
| Trypsin | 1PPC | 1PPH | 1.1 | 2/55 | 1.1 | 2/55 |
| 1PPH | 1PPC | 1.5 | 1/84 | 1.3 | 1/77 | |
RMSD value and rank of top scoring near native conformations are reported in bold; NNNS stands for No Near Native Structure.
The unbiased definition of the binding region was next implemented in the SCARE protocol. In Table 8, the results are reported. A near native conformation was ranked first in 24 cases out of 30 (80% of cross-docks vs 46% with a single receptor). For five ligands, a near native conformation could be found among the top ten refined poses. In only one case, the procedure could not provide any near native structure (see Table 8).
Table 8.
The unbiased SCARE docking protocol results using a predicted binding pocket and the bounding box.
| Protein | Receptor PDB | Ligand PDB | First Near Native RMSD (Å) a | First Near Native Rank |
|---|---|---|---|---|
| AR | 2ACR | 2FZB | 1.1 | 1 |
| Anti-Steroid Fab’ | 1DBA | 1DBB | 0.7 | 1 |
| CDK2 | 1AQ1 | 1DM2 | 1.0 | 1 |
| 1DM2 | 1AQ1 | 0.6 | 5 | |
| COX-2 | 1CX2 | 3PGH | 0.9 | 1 |
| 3PGH | 1CX2 | 1.0 | 1 | |
| ER | 1ERR | 3ERT | 1.5 | 1 |
| 3ERT | 1ERR | 1.5 | 1 | |
| Factor Xa | 1KSN | 1XKA | 1.0 | 1 |
| 1XKA | 1KSN | 0.5 | 1 | |
| GSK-3 β | 1Q4L | 1UV5 | 1.2 | 1 |
| 1UV5 | 1Q4L | NNNS | ||
| Hiv1 RT | 1C1C | 1RTH | 1.2 | 6 |
| 1RTH | 1C1C | 0.7 | 1 | |
| JNK3 | 1PMN | 1PMV | 0.3 | 1 |
| 1PMV | 1PMN | 1.8 | 1 | |
| LXR β LBD | 1P8D | 1PQ6 | 1.7 | 1 |
| 1PQ6 | 1P8D | 1.0 | 1 | |
| Neuroaminidase | 1A4Q | 1NSC | 0.4 | 1 |
| 1NSC | 1A4Q | 0.8 | 1 | |
| P38 Kinase | 1BMK | 1DI9 | 2.0 | 4 |
| 1DI9 | 1BMK | 1.2 | 1 | |
| PKA | 1STC | 1YDS | 1.5 | 1 |
| 1YDS | 1STC | 1.2 | 1 | |
| PPARγ | 1FM9 | 2PRG | 1.7 | 3 |
| 2PRG | 1FM9 | 1.6 | 1 | |
| TK | 1KI4 | 1KIM | 1.3 | 1 |
| 1KIM | 1KI4 | 0.5 | 1 | |
| Trypsin | 1PPC | 1PPH | 1.0 | 3 |
| 1PPH | 1PPC | 1.7 | 1 | |
RMSD value and rank of top scoring near native conformations are reported in bold; NNNS stands for No Near Native Structure. A near native solution predicted as the top best rank in 80%, within six top ranks in 97%.
The predicted bounding box affected the near native score in case of CDK2 (PDBid: 1DM2). Likewise, small differences in the pocket definition compromised the final ranking of the inhibitor 3-TAPAP at the binding site of Trypsin (PDBid: 1PPC). When docking the inhibitor I–5 at the binding site of GSK-3β (PDBid: 1UV5), no good predictions could be achieved. The predicted pocket included eight amino acids that were not part of the experimental range: the ligand experimental binding region only occupies a fraction of what the prediction algorithm correctly recognized as a larger pocket. While the bigger pocket volume led to a larger amount of false positives, the maleimidic moiety responsible for the main interaction with the receptor and a bifurcated hydrogen bond with the hinge region of the kinase, matched the experimental binding mode almost perfectly (RMSD 0.6 Å) in the top scoring pose.
Conclusions and Outlook
Accurate prediction of the binding pose of a flexible ligand to partially flexible binding pocket remains one of the main challenges of computer aided drug discovery and virtual ligand screening. Here we presented a fully automated algorithm that would predict the binding mode of a single ligand to a single distorted pocket conformation taken from another ligand-receptor complex or from an apo-structure. The SCARE algorithm does not need any prior knowledge of the ligand binding location or information about the sites of potential variability of the receptor pocket. Yet it achieves a significant improvement of the number of correct predictions compared with highly optimized single pocket conformation docking procedures. Figure 8 summarizes the improvements for the two methods of determining the docking bounding box on a diverse benchmark of 30 cross docking ligand-protein pairs.
Figure 8. Summary of the results for the 30 complexes in the cross docking benchmark, employing.
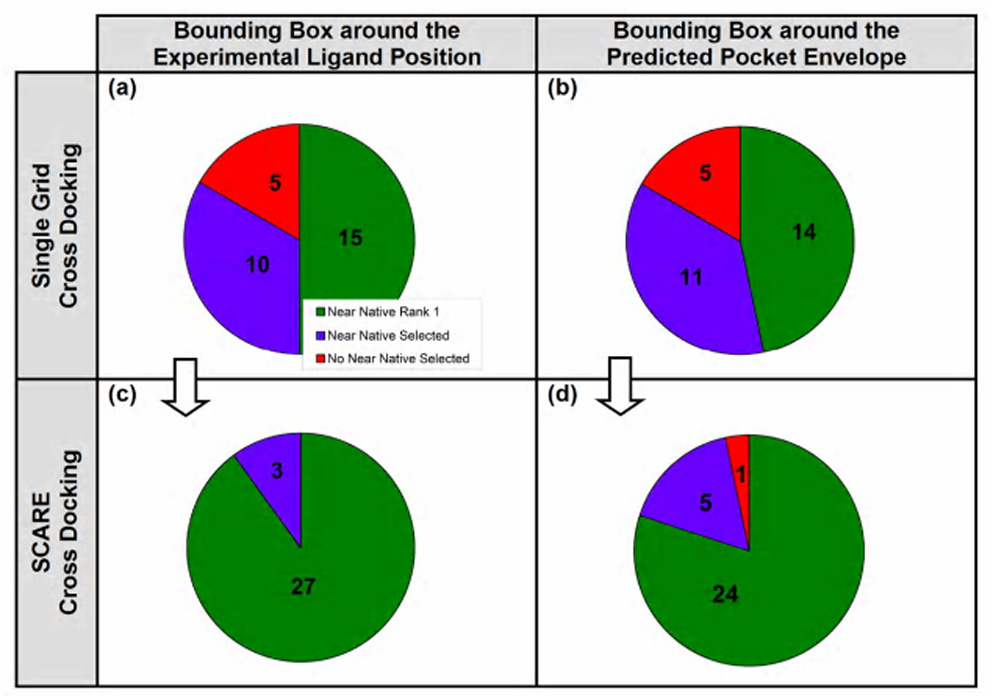
(a) single cross grid docking; the pocket boundaries are defined by the residues within 5 Å from the experimental ligand position, (b) SCARE docking; the pocket boundaries are defined by the residues within 5 Å from the experimental ligand position, (c) single cross grid docking; the pocket boundaries are defined by the residues within 3 Å from the predicted pocket envelope, and (d) SCARE docking; the pocket boundaries are defined by the residues within 3 Å from the predicted pocket envelope.
The idea of removing the movable parts of the environment (e.g. mutating side chains to alanines) rather than sampling them to generate candidates for refinement was successfully applied to side chain placements [31] and then to ligand docking for a preselected list of side-chains [21]. Here we used a fully automated dual alanine scan of instead of concurrent removal of all preselected “flexible” side chains in an attempt to create an unbiased general method applicable to a single protein binding pocket model. In this implementation of the SCARE protocol the number of pocket variants and, consequently, refined ligand poses, was relatively small, and only small adjustments of the protein backbone were allowed during the refinement. However the protocol is easily extendable to a more aggressive loop sampling algorithms. The SCARE paradigm can also be combined with the traditional MRC approaches relying on multiple crystal structures or generated structures [17; 32; 33].
The current benchmark was relatively limited, in part due to our desire to stick to the previously published induced fit benchmarks, and in part due to the time constraints of the procedure. The future algorithms would benefit from at least an order of magnitude larger high quality cross docking benchmarks that are now available [34] or under development [Kufareva et al, manuscript in preparation]. Overall, we believe that SCARE represents a reliable and practical unbiased “induced fit” docking protocol to assist rational structure based drug design, optimization and virtual screening efforts.
Supplementary Material
The complete description of the computational methods employed in the present study is reported in the Supplementary Information.
Abbreviations
- ICM
Internal Coordinate Mechanics
- RMSD
Root Mean Square Deviation
- SCARE
SCan Alanines and REfine algorithm
Bibliography
- 1.Kitchen DB, Decornez H, Furr JR, Bajorath J. Nat Rev Drug Discov. 2004;3:935. doi: 10.1038/nrd1549. [DOI] [PubMed] [Google Scholar]
- 2.Halperin I, Ma B, Wolfson H, Nussinov R. Proteins. 2002;47:409. doi: 10.1002/prot.10115. [DOI] [PubMed] [Google Scholar]
- 3.Bursulaya BD, Totrov M, Abagyan R, Brooks CL., 3rd J Comput Aided Mol Des. 2003;17:755. doi: 10.1023/b:jcam.0000017496.76572.6f. [DOI] [PubMed] [Google Scholar]
- 4.Teague SJ. Nat Rev Drug Discov. 2003;2:527. doi: 10.1038/nrd1129. [DOI] [PubMed] [Google Scholar]
- 5.Jiang F, Kim SH. J Mol Biol. 1991;219:79. doi: 10.1016/0022-2836(91)90859-5. [DOI] [PubMed] [Google Scholar]
- 6.Ponder JW, Richards FM. J Mol Biol. 1987;193:775. doi: 10.1016/0022-2836(87)90358-5. [DOI] [PubMed] [Google Scholar]
- 7.Leach AR. J Mol Biol. 1994;235:345. doi: 10.1016/s0022-2836(05)80038-5. [DOI] [PubMed] [Google Scholar]
- 8.Zavodszky MI, Kuhn LA. Protein Sci. 2005;14:1104. doi: 10.1110/ps.041153605. [DOI] [PMC free article] [PubMed] [Google Scholar]
- 9.Damm KL, Carlson HA. J Am Chem Soc. 2007;129:8225. doi: 10.1021/ja0709728. [DOI] [PubMed] [Google Scholar]
- 10.Knegtel RM, Kuntz ID, Oshiro CM. J Mol Biol. 1997;266:424. doi: 10.1006/jmbi.1996.0776. [DOI] [PubMed] [Google Scholar]
- 11.Osterberg F, Morris GM, Sanner MF, Olson AJ, Goodsell DS. Proteins. 2002;46:34. doi: 10.1002/prot.10028. [DOI] [PubMed] [Google Scholar]
- 12.Claussen H, Buning C, Rarey M, Lengauer T. J Mol Biol. 2001;308:377. doi: 10.1006/jmbi.2001.4551. [DOI] [PubMed] [Google Scholar]
- 13.Huang SY, Zou X. Proteins. 2007;66:399. doi: 10.1002/prot.21214. [DOI] [PubMed] [Google Scholar]
- 14.Lin JH, Perryman AL, Schames JR, McCammon JA. J Am Chem Soc. 2002;124:5632. doi: 10.1021/ja0260162. [DOI] [PubMed] [Google Scholar]
- 15.Lin JH, Perryman AL, Schames JR, McCammon JA. Biopolymers. 2003;68:47. doi: 10.1002/bip.10218. [DOI] [PubMed] [Google Scholar]
- 16.Gervasio FL, Laio A, Parrinello M. J Am Chem Soc. 2005;127:2600. doi: 10.1021/ja0445950. [DOI] [PubMed] [Google Scholar]
- 17.Cavasotto CN, Kovacs JA, Abagyan RA. J Am Chem Soc. 2005;127:9632. doi: 10.1021/ja042260c. [DOI] [PubMed] [Google Scholar]
- 18.Totrov M, Abagyan R. Proteins. 1997 Suppl 1:215. doi: 10.1002/(sici)1097-0134(1997)1+<215::aid-prot29>3.3.co;2-i. [DOI] [PubMed] [Google Scholar]
- 19.Cavasotto CN, Abagyan RA. J Mol Biol. 2004;337:209. doi: 10.1016/j.jmb.2004.01.003. [DOI] [PubMed] [Google Scholar]
- 20.Zhao Y, Sanner MF. Proteins. 2007;68:726. doi: 10.1002/prot.21423. [DOI] [PubMed] [Google Scholar]
- 21.Sherman W, Day T, Jacobson MP, Friesner RA, Farid R. J Med Chem. 2006;49:534. doi: 10.1021/jm050540c. [DOI] [PubMed] [Google Scholar]
- 22.Daily MD, Masica D, Sivasubramanian A, Somarouthu S, Gray JJ. Proteins. 2005;60:181. doi: 10.1002/prot.20555. [DOI] [PubMed] [Google Scholar]
- 23.Meiler J, Baker D. Proteins. 2006;65:538. doi: 10.1002/prot.21086. [DOI] [PubMed] [Google Scholar]
- 24.Abagyan R, Frishman D, Argos P. Proteins. 1994;19:132. doi: 10.1002/prot.340190206. [DOI] [PubMed] [Google Scholar]
- 25.Abagyan R, Totrov M. J Mol Biol. 1994;235:983. doi: 10.1006/jmbi.1994.1052. [DOI] [PubMed] [Google Scholar]
- 26.Totrov M, Abagyan R. In: Drug-receptor thermodynamics :introduction and applications. Raffa RB, editor. New York: Wiley, Chichester; 2001. pp. 603–624. [Google Scholar]
- 27.An J, Totrov M, Abagyan R. Mol Cell Proteomics. 2005;4:752. doi: 10.1074/mcp.M400159-MCP200. [DOI] [PubMed] [Google Scholar]
- 28.Smith CA, O'Maille G, Want EJ, Qin C, Trauger SA, Brandon TR, Custodio DE, Abagyan R, Siuzdak G. Ther Drug Monit. 2005;27:747. doi: 10.1097/01.ftd.0000179845.53213.39. [DOI] [PubMed] [Google Scholar]
- 29.Abagyan R, Orry A, Raush E, Budagyan L, Totrov M. ICM Manual 3.5. La Jolla, CA: Molsoft LCC; 2007. [Google Scholar]
- 30.Totrov M. Journal of Computational Chemistry. 2004;25:609. doi: 10.1002/jcc.10392. [DOI] [PubMed] [Google Scholar]
- 31.Eisenmenger F, Argos P, Abagyan R. J Mol Biol. 1993;231:849. doi: 10.1006/jmbi.1993.1331. [DOI] [PubMed] [Google Scholar]
- 32.Cavasotto CN, Kovacs JA, Totrov M, Abagyan R. Biophysical Journal. 2004;86:95a. [Google Scholar]
- 33.Kovacs J, Cavasotto CN, Abagyan RA. Biophysical Journal. 2005;88:334a. [Google Scholar]
- 34.Hartshorn MJ, Verdonk ML, Chessari G, Brewerton SC, Mooij WT, Mortenson PN, Murray CW. J Med Chem. 2007;50:726. doi: 10.1021/jm061277y. [DOI] [PubMed] [Google Scholar]
Associated Data
This section collects any data citations, data availability statements, or supplementary materials included in this article.
Supplementary Materials
The complete description of the computational methods employed in the present study is reported in the Supplementary Information.