

Abstract
Long-term potentiation (LTP) is an increase in synaptic responsiveness thought to be involved in mammalian learning and memory. The localization (presynaptic and/or postsynaptic) of changes underlying LTP has been difficult to resolve with current electrophysiological techniques. Using a biochemical approach, we have addressed this issue and attempted to identify specific molecular mechanisms that may underlie LTP. We utilized a novel multiple-electrode stimulator to produce LTP in a substantial portion of the synapses in a hippocampal CA1 minislice and tested the effects of such stimulation on the presynaptic protein synapsin I. LTP-inducing stimulation produced a long-lasting 6-fold increase in the phosphorylation of synapsin I at its Ca2+/calmodulin-dependent protein kinase II (CaM kinase II) sites without affecting synapsin I levels. This effect was fully blocked by either the N-methyl-d-aspartate receptor antagonist d(−)-2-amino-5-phosphonopentanoic acid (APV) or the CaM kinase II inhibitor KN-62. Our results indicate that LTP expression is accompanied by persistent changes in presynaptic phosphorylation, and specifically that presynaptic CaM kinase II activity and synapsin I phosphorylation may be involved in LTP expression.
Keywords: hippocampus, synaptic plasticity
Synaptic plasticity has been extensively studied in the mammalian hippocampal formation. Long-term potentiation (LTP) is one form of plasticity that has attracted considerable attention as a possible cellular substrate for learning and memory. LTP was first described by Bliss and Lomo (1), who demonstrated that a relatively brief burst of high-frequency stimulation (HFS) produces a long-lasting enhancement of synaptic responses in the mammalian hippocampus. Although presynaptic (2–4) and/or postsynaptic (5–8) changes have been proposed to underlie LTP, the exact localization of these changes remains highly controversial. This has been due in part to the difficulty in resolving presynaptic and postsynaptic events electrophysiologically (9). In this study, we have utilized a biochemical approach to address this issue and attempted to identify molecular mechanisms that may underlie LTP.
Numerous studies suggest that protein phosphorylation (specifically by protein kinase C and Ca2+/calmodulin-dependent protein kinase II [CaM kinase II)] plays a critical role in the induction and possibly the maintenance of LTP (10–12). However, identification of the specific phosphoproteins involved in LTP has been problematic. Synapsin I is a phosphoprotein that has a number of features which make it a likely candidate to mediate persistent presynaptic plasticity (13–15). It is found exclusively in neuronal presynaptic terminals, where it associates with synaptic vesicles (16–18). Considerable evidence suggests that synapsin I plays a key role in neurotransmitter release by regulating the availability of synaptic vesicles for exocytosis (19–24) (however, see ref. 25). According to this model, synapsin I crosslinks synaptic vesicles to the cytoskeleton in a phosphorylation state-dependent manner, thereby limiting the ability of vesicles to move to active zones for exocytosis. Phosphorylation of synapsin I by CaM kinase II reduces its affinity for synaptic vesicles 10-fold, thus removing its constraint on the availability of vesicles for release.
We have previously tested the hypothesis that synapsin I plays a role in LTP by examining the effects of pharmacological LTP-inducing, treatments [e.g., β-adrenergic agonists (26) and protein kinase C activators (27)] on synapsin I phosphorylation. Bath application of isoproterenol (14) or phorbol dibutyrate (28) produces a dose-dependent increase in the phosphorylation of synapsin I at its CaM kinase II sites. Furthermore, isoproterenol’s ability to induce synapsin I phosphorylation and its ability to generate LTP-like potentiation share the same brain region specificity (action on dentate gyrus and not CA1) (29). Such data support a role for synapsin I and its phosphorylation in LTP.
There are, however, significant limitations to this pharmacological approach. The LTP-like potentiation produced by pharmacological treatments may not be identical to LTP induced by classical electrophysiological techniques (29–32). In addition, the observed changes in synapsin I phosphorylation may be due to non-LTP effects of drug treatment, rather than purely LTP-related mechanisms. Hence, here we have been particularly interested in studying synapsin I phosphorylation following electrophysiologically induced LTP. The typical LTP stimulation paradigm involves delivering HFS to area CA1 through a single stimulating electrode. Using this method, we have been unsuccessful at detecting any LTP-associated changes in synapsin I phosphorylation. We have been concerned that such stimulation may not have induced LTP in a sufficient fraction of synapses for any changes in synapsin I phosphorylation to be detectable. Indeed, studies by two different groups suggest that single electrode stimulation produces LTP in only a limited number of synapses even within subregions of the hippocampal slice (33, 34).
In the present study, we have designed a new stimulating electrode array, called the rake, and developed a stimulation paradigm to deliver LTP to more synapses in the slice. We also used the CA1 minislice preparation to remove from our analyses the large unstimulated hippocampal areas (dentate gyrus and CA3) which are rich in synapsin I and would only add to our biochemical background. Taken together, these modifications increase the fraction of synapses which receive stimulation, effectively increasing the signal-to-noise ratio in our biochemical detection system. Here we present data, collected by using rake electrode stimulation of CA1 minislices, which indicate that electrically induced LTP increases the phosphorylation of synapsin I at its CaM kinase II sites immediately after stimulation. This effect persists for at least 30 min and is fully blocked by the N-methyl-d-aspartate (NMDA)-receptor antagonist d(−)-2-amino-5-phosphonopentanoic acid (APV).
MATERIALS AND METHODS
Slice Preparation and Stimulation.
Male Sprague–Dawley rats weighing 100–120 g were used in all experiments. After the animals had been sacrificed, hippocampi were removed and 400-μm thick slices were prepared on a McIlwain tissue chopper. Slices were placed in a 31.5°C oxygenated interface chamber and microdissected to CA1 minislices as previously described (29). The chamber contained artificial cerebrospinal fluid (aCSF: 124 mM NaCl/4 mM KCl/1 mM MgCl2/2.5 mM CaCl2/1 mM KH2PO4/10 mM dextrose/25.7 mM NaHCO3, bubbled with hydrated 95%O2/5%CO2). After a 90-min incubation at interface, slices were perfused with aCSF for the remainder of the experiment at 4 ml/min. Rake electrodes were prepared as linear arrays of four stainless steel monopolar electrodes, each separated by 100 μm and driven by its own stimulus isolation unit. Rake and recording (2–8 MΩ) electrodes were positioned in the stratum moleculare (Fig. 1 Inset). For paired pulse analysis, a 1-V, 150-μsec stimulus was used, which typically elicited a 1-mV field excitatory postsynaptic potential (EPSP). HFSs were 3-V, 300-μsec pulses delivered at 100 Hz for 1 sec. All simultaneous HFSs (s-HFSs) were HFSs administered simultaneously through all four electrodes. Multiple s-HFSs were delivered 30 sec apart. When multiple placements were indicated, rake positions were evenly spaced along the slice, approximately 0.75 mm apart (see Fig. 3). For phosphorylation experiments, >24 minislices were prepared from each animal. All slices were confirmed viable by electrophysiological criteria (fixed stimulus generates >1.0-mV field EPSP). One slice was used to confirm that the preparation was able to support rake-HFS-induced LTP. Twelve slices were perfused in aCSF and 12 in aCSF containing 100 μM APV, beginning at least 10 min prior to stimulation and continuing throughout the stimulation period. From each set, 6 stimulated and 6 control slices were harvested 0 or 30 min after s-HFS. When indicated, 10 μM KN-62 was perfused for a minimum of 20 min prior to stimulation and for 30 min after stimulation. In all cases, control slices were incubated in the same chamber and removed at the same time as paired stimulated slices.
Figure 1.
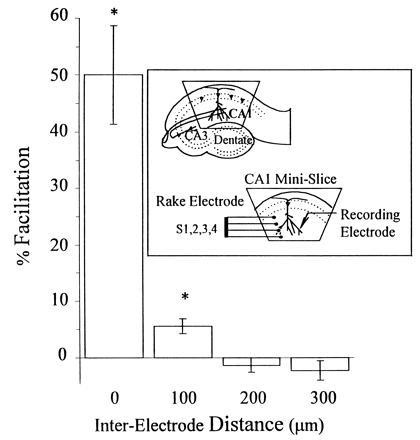
With low-frequency stimulation, there is minimal overlap between the fields of synapses affected by adjacent electrodes and no overlap between nonadjacent electrodes of the rake, as determined by paired pulse analysis. (Inset) CA1 minislice preparation and rake electrode configuration. Paired pulse facilitation was induced by coupling a conditioning stimulus with a test pulse delivered 50 msec later. Test stimuli were delivered either through the same electrode [interelectrode distance (IED) = 0 μm], an adjacent electrode (IED = 100 μm), or a nonadjacent electrode (IED = 200 or 300 μm). Every possible combination of conditioning and test pulses (S1-S1, S2-S2, S3-S3, and S4-S4 are averaged in column 1; S1-S2, S2-S1, S2-S3, S3-S2, S3-S4, and S4-S3, in column 2; S1-S3, S3-S1, S2-S4, and S4-S2 in column 3; and S1-S4 and S4-S1 in column 4) was performed, 15 times each, and the results of all experiments are averaged. Pulses paired through the same electrode showed significant (50% ± 9%) facilitation. Adjacent electrode facilitation was much smaller (6% ± 1%) but was also significantly higher than baseline. Paired pulses from nonadjacent electrodes did not produce any facilitation.
Figure 3.
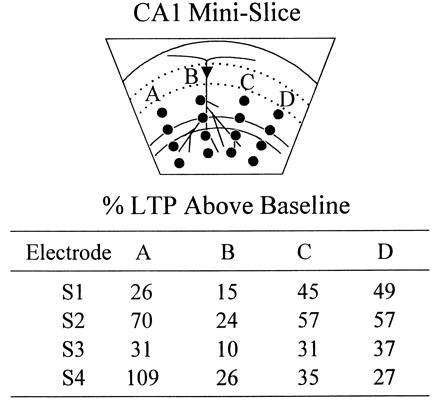
Additional synapses can be potentiated by utilizing multiple placements of the rake electrode. The rake electrode was first placed at position A, and baseline EPSPs were measured at each of S1, S2, S3, and S4. Responses were monitored for 30 min after s-HFS delivery at position A, and the % LTP generated at each electrode is tabulated. After ensuring saturation of LTP at this position (by administering second and third s-HFSs and showing that no further potentiation was possible), the rake was repositioned at B and a new baseline was obtained. s-HFS at B potentiated responses above this baseline, and the extent of LTP is quantitated. After saturation was confirmed at B, the electrode was repositioned at C and then at D, and the above tests were repeated. s-HFS was shown to produce comparable levels of LTP at each position, regardless of the prior stimulation received by the slice at other positions. This experiment was repeated and similar results were obtained in a slice from a separate animal.
Biochemical Analysis and Determination of Stoichiometry of Synapsin I Phosphorylation.
Stimulated and control slices were sonicated in 0.5 ml of 5 mM ZnC2H3O2 to block endogenous kinase and phosphatase activities and were stored at −20°C. Synapsin I was extracted from samples by a modified acid extraction procedure (29) in which synapsin was solubilized in 10 mM citric acid (pH 3.0)/0.1% Nonidet P-40 containing protease inhibitors phenylmethanesulfonyl fluoride (10 μg/ml), pepstatin (10 μg/ml), and Pefabloc-SC (100 μM; Sigma). Precipitated proteins were removed by centrifugation (10 min at 10,000 × g). After neutralization to pH 6.0 by addition of sodium phosphate (pH 7.4), stoichiometry of phosphorylation was determined for each slice extract by using the back-phosphorylation technique (28) and Western blot analysis. The back-phosphorylation assay was performed using purified CaM kinase II (CaM kinase II was added during preincubation and again 5 min after initiation of the reaction, for a final concentration of 3.6 ng/μl). Phenanthroline, a Zn2+-chelator, was added (0.18 mM) to prevent inhibition of CaM kinase II by residual Zn2+. Back-phosphorylation reactions were conducted for 30 min at room temperature in 45 mM Hepes, pH 7.4/10 mM MgCl2/0.3 mM CaCl2/0.03 mg/ml calmodulin/0.1 mM [γ-32P]ATP (specific activity 2 × 10⁶ dpm/nmol). The concentration of synapsin I in the acid extract (2–5 nM) was substantially less than the Km of CaM kinase II for synapsin I (≈2.0 μM). Absolute stoichiometric phosphorylation is required for the back-phosphorylation assay. In control experiments with extracted synapsin, a 20- to 25-min phosphorylation reaction was required to reach a stoichiometry of 2.0. Thus we chose to use the 30-min time point in our assays. Under such conditions virtually all (>95%) of the 32P incorporated into synapsin I is at its CaM kinase II sites. Western blots were used to determine the synapsin I concentration in each extract, using standard curves generated from synapsin I standards run on each gel. 32P and 35S incorporation were quantitated on a Bio-Rad phosphorimager analyzer, and stoichiometries of back-phosphorylation and endogenous phosphorylation were calculated from these data.
Determination of Synapsin I Phosphorylation State.
Back-phosphorylation of synapsin I revealed the moles of exogenous phosphate incorporatable per volume of slice extract. Western blot analysis was used to determine the moles of synapsin I per volume of slice extract. Back-phosphorylation stoichiometry was calculated from these values and subtracted from the total number of sites (2.0) to determine the stoichiometry of endogenous synapsin I phosphorylation for each slice.
Statistical Analyses.
Larger differences in phosphorylation state were observed between animals than among slices from a single animal. This is likely due to unavoidable day-to-day variations in dissection speed and slicing technique. To account for this variability, average control and stimulated values were determined for each animal, and paired two-tailed t tests were performed on these data. Values are reported as means ± SEM.
RESULTS
Optimization of a Stimulation Paradigm for Extensive Slice LTP Induction. The rake electrode, a linear array of four monopolar electrodes, each separated by 100 μm, was first characterized and then used to develop a stimulation paradigm to maximize the fraction of synapses receiving LTP. Responses of normal magnitude and duration could be elicited by any of the rake’s four electrodes when it was placed in the stratum radiatum of CA1 (Fig. 1 Inset). Paired pulse facilitation was used to assess the extent of overlap between the synapses stimulated by each electrode (Fig. 1). When pulses were paired through the same electrode, the second response was potentiated by 50% ± 9%, mean ± SEM (n = 12 slices). When the test pulse was delivered through an adjacent electrode (100 μm away), the resulting potentiation was statistically significant but much smaller (6% ± 1%, n = 90 slices, P < 0.05), suggesting little overlap in the synapses stimulated by neighboring electrodes. Furthermore, when the test pulse was delivered through a nonadjacent electrode (200 or 300 μm away), no paired pulse facilitation was observed (−1% ± 1% (n = 60 slices) for 200-μm separation; −2% ± 2% (n = 30 slices) for 300-μm separation), indicating no detectable overlap between nonadjacent electrodes. This suggested that each electrode stimulates fibers within a 50-μm radius and most importantly, that at low frequency, each electrode activates virtually distinct synapses.
Next we determined whether HFS delivered via one electrode in the rake produced LTP in the synapses activated by the other electrodes. We found no evidence of such overlap (Fig. 2 A and B), regardless of which electrode received HFS (n = 21 slices), suggesting that even with HFS, each electrode acts on a virtually independent population of synapses. Next, we showed that simultaneous HFS (s-HFS) of all four electrodes successfully produced LTP of conventional magnitude and duration in all four pathways (Fig. 2C). Furthermore, despite the high intensity of s-HFS, such stimulation generated LTP that was fully blocked by 100 μM APV, an NMDA receptor antagonist known to block LTP induction (data not shown).
Figure 2.
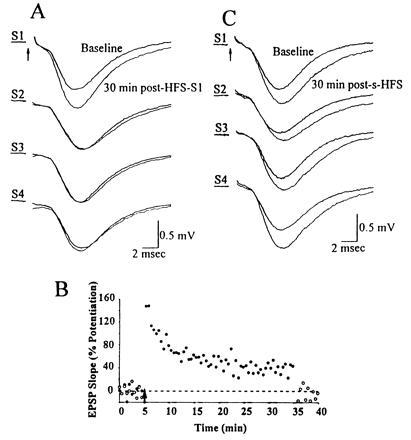
HFS delivered to one or simultaneously to all of the rake’s electrodes selectively potentiates the responses evoked by those electrode(s) receiving HFS. (A) Baseline responses were obtained by individually stimulating each of S1, S2, S3, and S4. HFS was delivered to S1. Thirty minutes later, responses were again elicited by individual stimulation at each electrode. Paired traces for each electrode show superimposed responses before and 30 min after the HFS-S1. Only responses to S1 were potentiated. All traces represent averages of 10 sweeps. Similar results were obtained when the electrode receiving HFS was S2, S3, or S4. One representative experiment is shown, of the 21 performed. (B) The percent change in the slope of the field EPSP is displayed as a function of time during this experiment. •, Potentiation (40% LTP at 30 min) generated by HFS-S1; ○, absence of LTP in an adjacent electrode (S2). (C) In separate minislices, HFS was delivered simultaneously (s-HFS) to all four of the rake’s electrodes. Averaged baseline and 30-min-post-s-HFS field EPSPs are superimposed for responses evoked by each of S1, S2, S3, and S4.
Last, we explored the possibility that stimulation at multiple rake positions could potentiate additional synapses. Theoretically, if the plane of section were perfect and no axons entered the slice from above or below, all Schaffer collateral/commissural synapses in the slice would originate from a bundle of continuous axons which could be stimulated at any single position along their path. However, because this slice anatomy is unlikely, we postulated that additional synapses could be potentiated by sequentially repositioning the rake along this path. Our data showed that slice LTP was far from saturated by s-HFS at a single position, and that additional LTP could be generated at each of four different rake positions (the most attempted) (Fig. 3).
Using these results, we designed a new LTP-inducing stimulation paradigm, called “3×4 s-HFS.” In this paradigm, the rake is sequentially placed at four different positions in the CA1 minislice, starting medially at position A and moving laterally to position D (see Fig. 3). At each position, s-HFS is delivered three times, 30 sec apart. The complete 3×4 s-HFS paradigm requires 6 min per slice.
Determination of LTP-Associated Changes in Synapsin I Phosphorylation. To study synapsin I phosphorylation during LTP induction and maintenance, slices were assayed at two time points (0 and 30 min, respectively) after stimulation. Control and stimulated slices were harvested immediately or 30 min after the final stimulus of 3×4 s-HFS, and synapsin I was extracted from each slice as described in Materials and Methods. In separate experiments, control and stimulated slices were exposed to 100 μM APV beginning 10 min prior to stimulation and lasting until all slices were harvested 0 or 30 min after 3×4 s-HFS stimulation. To avoid the potential artifacts and radiation hazards associated with prelabeling protocols, a back-phosphorylation assay (modified from ref. 35) was used to determine the stoichiometry of endogenous synapsin I phosphorylation. In this assay, a stimulation-dependent increase in endogenous synapsin I phosphorylation appears as a decrease in back-phosphorylation.
The back-phosphorylation assay and Western analysis were performed on all slice extracts. Autoradiograms from extracts of a representative control and stimulated slice pair are shown in Fig. 4. Synapsin I, appearing as a doublet (Ia and Ib isoforms), showed less back-phosphorylation by CaM kinase II in the stimulated slice versus control. Cumulative data obtained from 18 animals are summarized in Figs. 5 and 6. Immediatelyafter stimulation, there was a significant reduction in back-phosphorylation of synapsin I (85% ± 8% of unstimulated controls, P < 0.05, n = 8 rats) (Fig. 5). Furthermore, this effect was also observed when slices were harvested 30 min after 3×4 s-HFS (91% ± 2% of control, P < 0.01, n = 18 rats) (Fig. 5). Hence, stimulation reduced the number of exogenously phosphorylatable CaM kinase II sites, indicating, as hypothesized, greater endogenous phosphorylation. The observed changes in synapsin I phosphorylation could not be accounted for by any changes in synapsin I expression, as Western blot analysis of the same slice extracts showed no significant differences in the levels of synapsin I between stimulated and control slices (97% ± 3% of control, P > 0.3, n = 8 rats) even up to 30 min after stimulation (104% ± 2% of control, P > 0.2, n = 18 rats) (Fig. 6). Most importantly, the effect of LTP-inducing stimulation on synapsin I phosphorylation was fully blocked by 100 μM APV (phosphorylation 108% ± 5% of control, P > 0.2, n = 9 rats), consistent with it being an LTP-associated change rather than merely an artifact of intense stimulation (Fig. 5).
Figure 4.
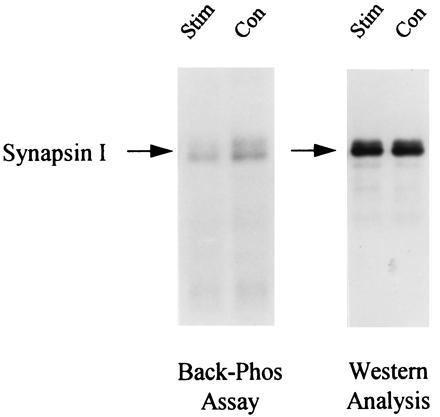
Induction of LTP by 3×4 s-HFS stimulation leads to a decrease in synapsin I back-phosphorylation. Control and stimulated minislices were collected 30 min after 3×4 s-HFS stimulation and subjected to back-phosphorylation by exogenous CaM kinase II (Left) and Western blot analysis (Right). Stimulation reduced the number of sites available for back-phosphorylation—i.e., increased endogenous phosphorylation. Western analysis shows no significant change in synapsin I expression, suggesting that phosphorylation alone accounts for this observed difference. Data from a representative slice pair are shown.
Figure 5.
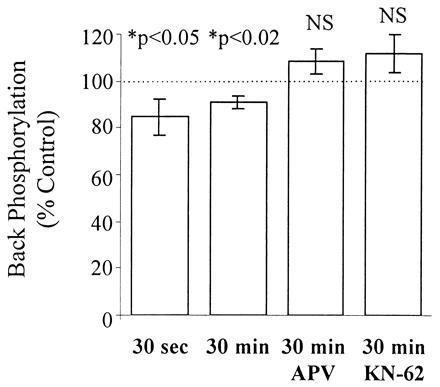
The rise in endogenous synapsin I phosphorylation due to 3×4 s-HFS is rapid, persists for at least 30 min, and is fully blocked by 100 μM APV or 10 μM KN-62. Back-phosphorylation assays were performed on slices 30 sec (n = 48 slice pairs, 8 rats) and 30 min (n = 108 slice pairs, 18 rats) after receiving 3×4 stimulation in aCSF, and 30 min after receiving 3×4 stimulation in 100 μM APV (n = 54 slice pairs, 9 rats) or 10 μM KN-62 (n = 16 slice pairs, 4 rats). Each bar represents the mean back-phosphorylation as % of control (±SEM). asterisks indicate significant differences from control slices (P < 0.05, two-tailed t test).
Figure 6.
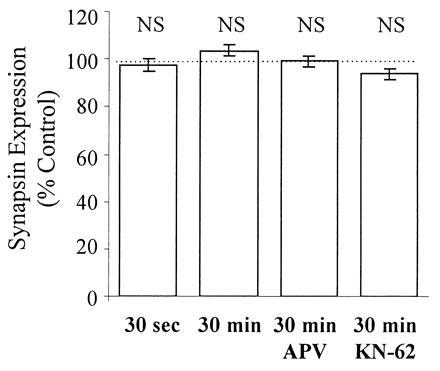
LTP induced by 3×4 s-HFS has no effect on synapsin I levels immediately and up to 30 min after stimulation. Western blot analysis of the same slice extracts presented in Fig. 5 showed no significant LTP-associated changes in synapsin I levels up to 30 min after stimulation.
The above experiment was repeated in the presence of 10 μM KN-62, a highly specific, membrane-permeant inhibitor of CaM kinase II (Figs. 5 and 6) to determine whether the observed increase in endogenous synapsin I phosphorylation was dependent upon activation of CaM kinase II. KN-62 blocked the increase in synapsin I phosphorylation (back-phosphorylation = 111.8% ± 8.2% of control, P > 0.1, n = 16 slice pairs, 4 rats), suggesting that activation of endogenous CaM kinase II is required for the observed changes in synapsin I.
The stoichiometry of endogenous synapsin I phosphorylation at its two CaM kinase II sites was calculated for all slices (see Materials and Methods). As shown in Table 1, synapsin I has a very low level of basal phosphorylation (1.9%). 3×4 s-HFS increases the endogenous phosphorylation state of synapsin I 6-fold to 12%, an effect which persists for 30 min after the cessation of stimulation.
Table 1.
Stoichiometry of endogenous synapsin I phosphorylation
| Treatment | Stoichiometry | % phosphorylation |
|---|---|---|
| Control | 0.038 | 1.9 |
| 3×4 s-HFS | 0.236 | 12 |
Stoichiometries of endogenous phosphorylation were calculated from the data in the text. Although the 3×4 s-HFS-generated change in back-phosphorylation is relatively small, the corresponding rise in endogenous synapsin I phosphorylation is quite large (6-fold).
Weaker stimulation paradigms were also tested, such as 1×4 (1 s-HFS at each of 4 positions) and 1×1 (1 s-HFS at 1 position). In these experiments, no significant changes in synapsin I phosphorylation were observed (data not shown).
DISCUSSION
Our data show that LTP inducing stimulation produces a 6-fold increase in endogenous synapsin I phosphorylation at its CaM kinase II sites. The observed rise in synapsin I phosphorylation occurred rapidly after the stimulation and persisted for at least 30 min. Most importantly, this effect was not observed in the presence of the NMDA receptor antagonist APV, suggesting that the rise in synapsin I phosphorylation is due to the LTP-inducing nature of the stimulation. Since synapsin I is localized exclusively in the presynaptic terminal, our data provide strong evidence that LTP expression is accompanied by persistent biochemical changes in the presynaptic terminal. Because the observed LTP-associated presynaptic changes require NMDA receptor activation, these data support models of LTP in which a retrograde messenger (generated subsequent to postsynaptic NMDA receptor activation) may produce presynaptic changes underlying LTP (36–38).
The mechanism by which LTP induction might lead to this long-lasting increase in synapsin I phosphorylation is currently unknown. One attractive hypothesis is that CaM kinase II may be persistently activated in the presynaptic terminal. It is well known that CaM kinase II can undergo autophosphorylation, rendering it constitutively active and no longer requiring Ca2+ or calmodulin for its activity, and such constitutive activation of CaM kinase II has been associated with LTP (39). Our data suggest that the presynaptic terminal is at least one location where such persistent CaM kinase II activation may occur. Because the increase in synapsin I phosphorylation was blocked by the CaM kinase II inhibitor KN-62, we favor the hypothesis that an increase in endogenous CaM kinase II activity is responsible for the long-lasting increase in synapsin I phosphorylation. However, it is important to note that the effect on synapsin I could also be due to decreased protein phosphatase activity. Given the abundance of phosphatase inhibitors in the central nervous system, which themselves can be regulated by phosphorylation, this possibility must also be carefully considered as a potential mechanism.
Our studies using the rake electrode have shown that single-electrode stimulation affects a very small fraction of the synapses even within the CA1 subregion. Moreover, we have shown that single-electrode stimulation produces no detectable changes in synapsin I phosphorylation in the CA1 minislice. Thus, we are puzzled by studies recently reported (40, 41) wherein single-electrode stimulation produced an increase in GAP-43, microtubule-associated protein 2, and synapsin I phosphorylation. Far more unstimulated synapses should have been present in the biochemical assays of these groups than in our own. One possible explanation of this discrepancy is that the front-phosphorylation assay employed by these other groups is subject to artifacts associated with the failure to achieve isotopic equilibrium in 32P-labeling experiments. Since these studies show increased 32P incorporation into every protein assayed, it is possible that the stimulation may have altered the specific activity of some ATP pools in the slice.
It is unlikely that the stimulation paradigm we have used is capable of stimulating all synapses in the minislice, since even with multiple positioning of a multi-electrode array, only a fraction of the total volume of the slice receives direct stimulation. Thus, it is possible that individual stimulated synapses actually experience a much larger increase in synapsin I phosphorylation than we report, and that this is masked in our system by unstimulated synapses that are included in the biochemical analysis. Moreover, it is also possible that some stimulated slices that did not exhibit LTP may have been included in our assay, thus leading us to underestimate the magnitude of the effect on synapsin I phosphorylation. Unfortunately, determination of the exact magnitude of the increase in synapsin I phosphorylation within a single LTP-stimulated synapse is not currently possible.
The prolonged increase we have observed in synapsin I phosphorylation appears to be unique to LTP. Previously, treatments such as KCl-depolarization have been shown to enhance synapsin I phosphorylation, but this effect is extremely transient and is reversed within minutes after removal of the depolarizing stimulus (35). Thus the persistent increase in synapsin I phosphorylation we have observed requires some aspect of LTP stimulation beyond the transitory Ca2+ influx that occurs during KCl-induced depolarization.
Greengard and colleagues and others have proposed a model in which synapsin I links synaptic vesicles to the presynaptic cytoskeleton and restricts the availability of those vesicles for release (19–24). Phosphorylation of synapsin I at its CaM kinase II sites is thought to free vesicles from synapsin I, thereby increasing the availability of vesicles for exocytosis. Thus, a persistent increase in synapsin I phosphorylation could contribute to LTP by providing a mechanism for a long-lasting enhancement of presynaptic neurotransmitter release. However, the role of synapsin I remains somewhat controversial. For example, Rosahl et al. (25) have studied synapsin I knockout mice and have found no evidence that expression of synapsin I is essential for LTP. It is important to note that in the present study we have assayed only for changes in the phosphorylation state of synapsin I. CaM kinase II is a multifunctional kinase that can phosphorylate a multitude of different proteins. We consider it quite likely that if CaM kinase II is persistently activated in the presynaptic terminal following LTP then it may phosphorylate other substrates in the terminal. Any or all of these could contribute to presynaptic changes during LTP.
In summary, our data indicate that LTP induction and early maintenance are accompanied by a persistent increase in phosphorylation of synapsin I in the presynaptic terminal. Although such data do not prove that LTP is presynaptic, they do provide new biochemical evidence in support of presynaptic mechanisms in LTP. We have also shown that conventional single-electrode stimulation produces potentiation in only a fraction of the synapses in a hippocampal subregion. Thus the rake electrode should be particularly useful in future attempts to identify the molecular mechanisms underlying LTP.
Acknowledgments
We thank Dr. T. V. Dunwiddie for helpful discussions, technical support, and reviewing the manuscript. This work was supported by an individual National Institutes of Health–National Research Service Award (MH10757) to A.S.N. and Public Health Service Grants AG04418, MH44212, AA09675, and AA03527 to M.D.B..
Footnotes
Abbreviations: APV, d(−)-2-amino-5-phosphonopentanoic acid; CaM kinase II, Ca2+/calmodulin-dependent protein kinase II; EPSP, excitatory postsynaptic potential; HFS, high-frequency stimulation; LTP, long-term potentiation; NMDA, N-methyl-d-aspartate; s-HFS, simultaneous HFS.
References
- 1.Bliss T V P, Lomo T. J Physiol (London) 1973;232:331–356. doi: 10.1113/jphysiol.1973.sp010273. [DOI] [PMC free article] [PubMed] [Google Scholar]
- 2.Dolphin A C, Errington M L, Bliss T V P. Nature (London) 1982;297:496–498. doi: 10.1038/297496a0. [DOI] [PubMed] [Google Scholar]
- 3.Malinow R, Tsien R W. Nature (London) 1990;346:177–180. doi: 10.1038/346177a0. [DOI] [PubMed] [Google Scholar]
- 4.Malgaroli A, Tsien R W. Nature (London) 1992;357:134–139. doi: 10.1038/357134a0. [DOI] [PubMed] [Google Scholar]
- 5.Muller D, Lynch G. Proc Natl Acad Sci USA. 1988;85:9346–9350. doi: 10.1073/pnas.85.23.9346. [DOI] [PMC free article] [PubMed] [Google Scholar]
- 6.Kauer J A, Malenka R C, Nicoll R A. Neuron. 1988;1:911–917. doi: 10.1016/0896-6273(88)90148-1. [DOI] [PubMed] [Google Scholar]
- 7.Manabe T, Renner P, Nicoll R A. Nature (London) 1992;355:50–55. doi: 10.1038/355050a0. [DOI] [PubMed] [Google Scholar]
- 8.Manabe T, Nicoll R A. Science. 1994;265:1888–1892. doi: 10.1126/science.7916483. [DOI] [PubMed] [Google Scholar]
- 9.Malinow R. Science. 1994;266:1195–1196. doi: 10.1126/science.7973700. [DOI] [PubMed] [Google Scholar]
- 10.Finn R, Browning M, Lynch G. Neurosci Lett. 1980;19:103–108. doi: 10.1016/0304-3940(80)90264-5. [DOI] [PubMed] [Google Scholar]
- 11.Malinow R, Schulman H, Tsien R W. Science. 1989;245:862–866. doi: 10.1126/science.2549638. [DOI] [PubMed] [Google Scholar]
- 12.Hvalby O, Hemmings H C, Jr, Paulsen O, Czernik A J, Nairn A C, Godfraind J-M, Jensen V, Raastad M, Storm J F, Andersen P, Greengard P. Proc Natl Acad Sci USA. 1994;91:4761–4765. doi: 10.1073/pnas.91.11.4761. [DOI] [PMC free article] [PubMed] [Google Scholar]
- 13.Nestler E J, Greengard P. Nature (London) 1983;305:583–588. doi: 10.1038/305583a0. [DOI] [PubMed] [Google Scholar]
- 14.Parfitt K D, Hoffer B J, Browning M D. Proc Natl Acad Sci USA. 1991;88:2361–2365. doi: 10.1073/pnas.88.6.2361. [DOI] [PMC free article] [PubMed] [Google Scholar]
- 15.Greengard P, Valtorta F, Czernik A J, Benfenati F. Science. 1993;259:780–785. doi: 10.1126/science.8430330. [DOI] [PubMed] [Google Scholar]
- 16.De Camilli P, Harris S M, Huttner W B, Greengard P. J Cell Biol. 1983;96:1355–1373. doi: 10.1083/jcb.96.5.1355. [DOI] [PMC free article] [PubMed] [Google Scholar]
- 17.Huttner W B, Schiebler W, Greengard P, De Camilli P. J Cell Biol. 1983;96:1374–1388. doi: 10.1083/jcb.96.5.1374. [DOI] [PMC free article] [PubMed] [Google Scholar]
- 18.Navone F, Di Gioia G, Jahn R, Browning M, Greengard P, De Camilli P. J Cell Biol. 1989;109:3425–3433. doi: 10.1083/jcb.109.6.3425. [DOI] [PMC free article] [PubMed] [Google Scholar]
- 19.Llinás R R, McGuinness T L, Leonard C S, Sugimori M, Greengard P. Proc Natl Acad Sci USA. 1985;82:3035–3039. doi: 10.1073/pnas.82.9.3035. [DOI] [PMC free article] [PubMed] [Google Scholar]
- 20.Schiebler W, Jahn R, Doucet J, Rothlein J, Greengard P. J Biol Chem. 1986;261:8383–8390. [PubMed] [Google Scholar]
- 21.McGuinness T L, Brady S T, Gruner J A, Sugimori M, Llinás R R, Greengard P. J Neurosci. 1989;9:4138–4149. doi: 10.1523/JNEUROSCI.09-12-04138.1989. [DOI] [PMC free article] [PubMed] [Google Scholar]
- 22.Hackett J T, Cochran S L, Greenfield L J, Jr, Brosius D C, Ueda T. J Neurophysiol. 1990;63:701–706. doi: 10.1152/jn.1990.63.4.701. [DOI] [PubMed] [Google Scholar]
- 23.Llinás R, Gruner J A, Sugimori M, McGuinness T L, Greengard P. J Physiol (London) 1991;436:257–282. doi: 10.1113/jphysiol.1991.sp018549. [DOI] [PMC free article] [PubMed] [Google Scholar]
- 24.Ceccaldi P-E, Grohovaz F, Benfenati F, Chieregatti E, Greengard P, Valtorta F. J Cell Biol. 1995;128:905–912. doi: 10.1083/jcb.128.5.905. [DOI] [PMC free article] [PubMed] [Google Scholar]
- 25.Rosahl T, Geppert M, Spillane D, Herz J, Hammer R, Malenka R, Südhof T C. Cell. 1993;75:661–670. doi: 10.1016/0092-8674(93)90487-b. [DOI] [PubMed] [Google Scholar]
- 26.Stanton P K, Sarvey J M. Brain Res Bull. 1987;18:115–119. doi: 10.1016/0361-9230(87)90039-6. [DOI] [PubMed] [Google Scholar]
- 27.Malenka R C, Madison D V, Nicoll R A. Nature (London) 1986;321:175–177. doi: 10.1038/321175a0. [DOI] [PubMed] [Google Scholar]
- 28.Browning M D, Dudek E M. Synapse. 1992;10:62–70. doi: 10.1002/syn.890100109. [DOI] [PubMed] [Google Scholar]
- 29.Parfitt K D, Doze V A, Madison D V, Browning M D. Hippocampus. 1992;2:59–64. doi: 10.1002/hipo.450020108. [DOI] [PubMed] [Google Scholar]
- 30.Muller D, Turnbull J, Baudry M, Lynch G. Proc Natl Acad Sci USA. 1988;85:6997–7000. doi: 10.1073/pnas.85.18.6997. [DOI] [PMC free article] [PubMed] [Google Scholar]
- 31.Kamiya H, Sawada S, Yamamoto C. Exp Neurol. 1988;102:314–317. doi: 10.1016/0014-4886(88)90225-7. [DOI] [PubMed] [Google Scholar]
- 32.Gustafsson B, Huang Y, Wigstrom H. Neurosci Lett. 1988;85:77–81. doi: 10.1016/0304-3940(88)90432-6. [DOI] [PubMed] [Google Scholar]
- 33.Dunwiddie T V, Lynch G. J Physiol (London) 1978;276:353–367. doi: 10.1113/jphysiol.1978.sp012239. [DOI] [PMC free article] [PubMed] [Google Scholar]
- 34.Barnes C A, Jung M W, McNaughton B L, Korol D L, Andreasson K, Worley P F. J Neurosci. 1994;14:5793–5806. doi: 10.1523/JNEUROSCI.14-10-05793.1994. [DOI] [PMC free article] [PubMed] [Google Scholar]
- 35.Forn J, Greengard P. Proc Natl Acad Sci USA. 1978;75:5195–5199. doi: 10.1073/pnas.75.10.5195. [DOI] [PMC free article] [PubMed] [Google Scholar]
- 36.Schuman E M, Madison D V. Science. 1991;254:1503–1506. doi: 10.1126/science.1720572. [DOI] [PubMed] [Google Scholar]
- 37.Zhuo M, Small S A, Kandel E R, Hawkins R D. Science. 1993;260:1946–1950. doi: 10.1126/science.8100368. [DOI] [PubMed] [Google Scholar]
- 38.Stevens C F, Wang Y. Nature (London) 1993;364:147–149. doi: 10.1038/364147a0. [DOI] [PubMed] [Google Scholar]
- 39.Fukunaga K, Stoppini L, Miyamoto E, Muller D. J Biol Chem. 1993;268:7863–7867. [PubMed] [Google Scholar]
- 40.Gianotti C, Nunzi M G, Gispen W H, Corradetti R. Neuron. 1992;8:843–848. doi: 10.1016/0896-6273(92)90198-m. [DOI] [PubMed] [Google Scholar]
- 41.Fukunaga K, Muller D, Miyamoto E. J Biol Chem. 1995;270:6119–6124. doi: 10.1074/jbc.270.11.6119. [DOI] [PubMed] [Google Scholar]