Abstract
Adenoviral oncolytic virotherapy represents an attractive treatment modality for central nervous system (CNS) neoplasms. However, successful application of virotherapy in clinical trials has been hampered by inadequate distribution of oncolytic vectors. Neural stem cells (NSCs) have been shown as suitable vehicles for gene delivery because they track tumor foci. In this study, we evaluated the capability of NSCs to deliver a conditionally replicating adenovirus (CRAd) to glioma. We examined NSC specificity with respect to viral transduction, migration and capacity to deliver a CRAd to tumor cells. Fluorescence-activated cell sorter (FACS) analysis of NSC shows that these cells express a variety of surface receptors that make them amenable to entry by recombinant adenoviruses. Luciferase assays with replication-deficient vectors possessing a variety of transductional modifications targeted to these receptors confirm these results. Real-time PCR analysis of the replication profiles of different CRAds in NSCs and a representative glioma cell line, U87MG, identified the CRAd-Survivin (S)-pk7 virus as optimal vector for further delivery studies. Using in vitro and in vivo migration studies, we show that NSCs infected with CRAd-S-pk7 virus migrate and preferentially deliver CRAd to U87MG glioma. These results suggest that NSCs mediate an enhanced intratumoral distribution of an oncolytic vector in malignant glioma when compared with virus injection alone.
Keywords: neural stem cells, oncolytic virus, adenovirus, virotherapy, glioma, brain tumor
Introduction
Drug delivery to the brain represents a major hurdle in the management of primary central nervous system (CNS) tumors. Radiation, chemotherapy and gross total resection serve little to significantly change the prognosis of patients diagnosed with this fatal disease. As a result, researchers have developed several new strategies to treat CNS neoplasms, such as the local delivery of biologically therapeutic agents. The allure of local biologic therapy for CNS tumors versus any conventional treatment strategy is based on the belief that local biologic therapy can be manipulated to address both the physiological and molecular aspects of cancer pathophysiology while avoiding the formidable barrier to drug delivery—the blood–brain barrier.
The advent of conditionally replicating adenoviruses (CRAds) for glioma treatment has been marked by a generation of recombinant vectors capable of specific replication and transduction in tumor cells.1 At present, viral vectors can be engineered to specifically transduce and replicate according to molecular hallmarks of aggressive cancer cells, leaving normal healthy cells unharmed. Although the efficient entry and replication in glioma cells by recombinant adenoviral vectors have been investigated and proven by several groups,2-9 the issue of vector distribution remains a significant—yet seldom investigated—obstacle in glioma virotherapy. A limitation involved with local delivery of virolytic agents by themselves results from the fact that gene distribution occurs by passive diffusion; thus, gene delivery remains restricted to areas immediately surrounding the injection tract. To obtain successful clinical application, an ideal vector must show specificity, potency and adequate distribution throughout the target tissue. These factors underscore the need for developing a component of virotherapy that ensures appreciable dissemination of an ideal oncolytic vector.
We propose that the local delivery of adenoviral agents to CNS tumors would benefit from an additional carrier that, when delivered together, would allow the therapy to address both tumor pathophysiology and molecular abnormalities of neoplastic CNS tumors. Bone marrow-derived and neural stem cells (NSCs) have shown a preferential homing capacity in response to glioma pathophysiology and microenvironment (reviewed in Aboody et al.10). As cells, stem cells represent a delivery system capable of responding to the diverse pathological signals of proliferating tumors. Such characteristics of stem cells highlight their potential for achieving targeted delivery of therapeutic transgenes, or entire vectors, to diseased areas of the brain in a manner that would affect observable therapeutic benefits. We have shown earlier the ability of mesenchymal stem cells (MSCs) to effectively target delivery of the CRAd vector, CRAd-CXCR4-5/3, to experimental intracranial glioma.11 However, unlike MSCs, NSCs are endogenous to the CNS. We therefore wished to investigate the capability of NSCs to deliver an oncolytic Ad to intracranial glioma.
In this study, we hypothesize that the use of an immortalized NSC line to deliver an oncolytic Ad locally to CNS tumors will lead to an enhanced delivery of that oncolytic agent in the tumor tissue. To study the delivery capacity of NSCs in depth, we have evaluated the susceptibility and permissivity of NSCs by subjecting them to a variety of assays using a multitude of CRAd vectors, with the end result of selecting an optimal vector for in vivo studies. Our screening process, which has included in vitro delivery assays with NSCs, led to the identification of the CRAd-S-pk7 vector as an optimal candidate for in vivo study. The CRAd-S-pk7 virus is a recombinant Ad whose replication is restricted to glioma cells overexpressing the inhibitor of apoptosis protein, survivin. This oncolytic Ad efficiently transduces glioma cells through a poly-l-lysine incorporation into the C terminus of the fiber knob protein. We have shown earlier that CRAd-S-pk7 exhibits a potent antitumor activity in animal models of glioma.9 Our findings, as shown in this article, indicate that NSCs are capable of providing a carrier function and mediating enhanced distribution of an oncolytic Ad to malignant glioma.
Results
NSCs express stem cell markers
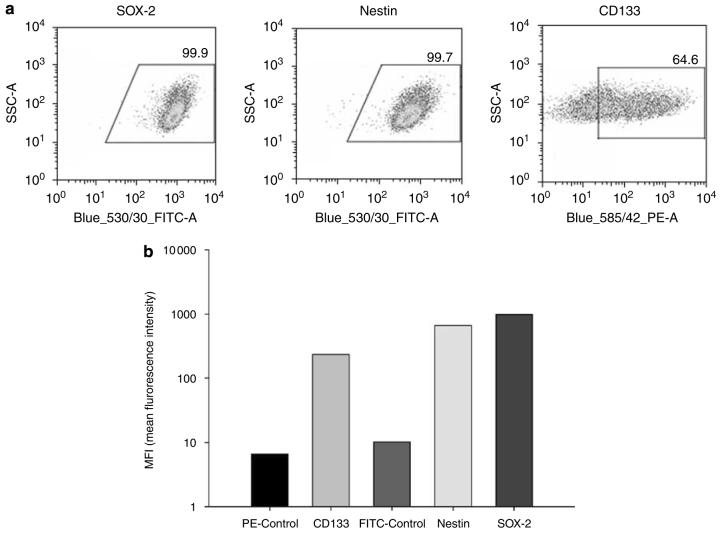
First, we wished to characterize the stem-like nature of our cells by measuring the relative expression of neural stem/progenitor markers by flow cytometry (Figures 1a and b). We measured the expression of CD133, a surface marker of neural and endothelial precursor cells; SOX-2, a transcription factor expressed in embryonic stem cells and NSCs and nestin, an intermediate filament protein expressed during neuronal embryogenesis. CD133 was expressed in 64.4% of cells, whereas nestin and SOX-2 expressions were found virtually in all examined NSCs (SOX-2: 99.9% cells positive; nestin: 99.7%). The average mean fluorescence intensity is also shown in Figure 1b to show the relative amount of each protein expressed in NSCs.
Figure 1.
Expression of neural stem cell markers. NSCs were stained to measure their expression of SOX-2, nestin and CD133 and subsequently analyzed by flow cytometry. (a) Flow cytometric dot plots depict the percentage of cells undergoing shifts in fluorescence intensity. Gates were drawn based on a negative control, which consisted of NSCs incubated only with FITC- or PE-conjugated antibodies. (b) Bar graphs represent the average mean fluorescence intensities (MFI) of each stem marker, indicating the relative amount of each protein expressed in NSCs. Each experiment was repeated twice.
NSCs allow efficient Ad entry
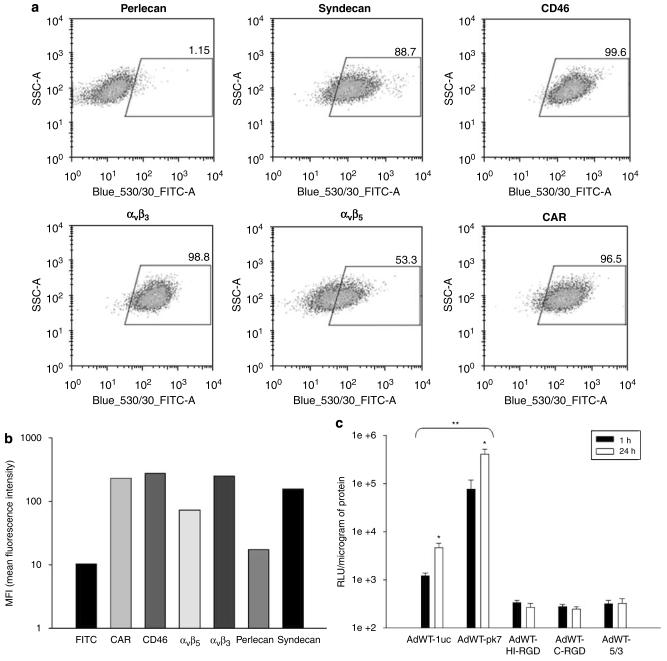
The suitability of NSCs for delivering Ad to glioma rests partly on the efficiency with which NSCs can be ‘loaded’ with a particular vector. As surface protein expression and the configuration of the adenoviral knob domain determine the degree of viral entry, we evaluated the expression of Ad-targeted surface receptors in NSCs as well as the transduction efficiencies of a cohort of recombinant Ads that bind to these receptors (Figure 2).
Figure 2.
NSCs express adenoviral target receptors and permit efficient gene transduction by recombinant adenoviral vectors. (a) Flow cytometric analysis of surface receptors targeted by recombinant adenovirus vectors. Dot plots represent the percentage of cells undergoing shifts in fluorescence intensity. (b) Bar graph representing average MFI values (y-axis) for each adenoviral receptor (x-axis). (c) Transduction of NSCs with recombinant Ad vectors was analyzed by luciferase activity. The level of transduction with each vector (x-axis) is represented on the y-axis as relative light units (RLUs)/mg protein. *P-value <0.05 vs time; **P-value <0.05 vs AdWT.
We measured the expression of the following adenoviral targets by flow cytometry (Figures 2a and b): αvβ3 and αvβ5 integrins, adhesion proteins targeted by vectors possessing RGD (Arg-Gly-Asp) motifs;6 CAR, the primary receptor of wild-type human Ad5;12 CD46, the target of group B Ad8,13 and syndecan and perlecan, two representative heparan sulfate proteoglycans that bind to vectors containing a poly-l-lysine (pk7) modification.14 NSCs showed immunophenotypes marked by appreciable expression of all Ad-targeted receptors, with perlecan being the only exception (perlecan: 1.15%; syndecan: 88.7%; CD46: 99.6% ; αvβ3: 98.8%; αvβ5: 53.3% and CAR: 96.5%).
The pk7-modified vector (AdWT-pk7) showed the greatest capacity for NSC transduction (Figure 2c), as detected by luciferase assay (1 h: 7.7×10⁴ RLU (relative light units) per mg protein; 24 h: 4.0×10⁵ RLU per mg protien). Wild-type Ad5 showed efficient transduction, when compared with other vectors. Interestingly, CD46 expression and integrin expression did not render NSCs particularly vulnerable to entry with vectors possessing group B knob and RGD modifications, respectively. It can be noted that both AdWT and AdWT-pk7 vectors showed a time-dependent increase in viral transduction (P<0.05).
Transcriptional profiling: survivin and CXR4 are transcriptional targets for viral oncolysis in NSCs and glioma
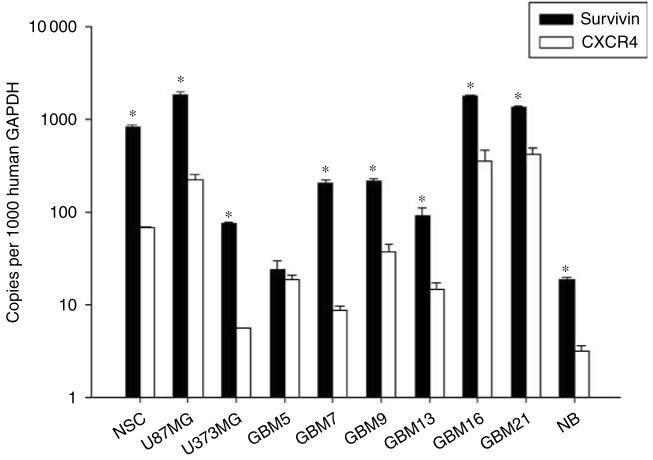
There are several important factors to consider when studying NSC-mediated vector delivery. In addition to providing a carrier function for an oncolytic vector, NSCs must also provide adequate vector amplification. Genome amplification—and consequent oncolysis—is crucial when attempting to achieve optimal vector delivery, infectivity and sustained glioma toxicity. The activity of the promoter that controls the transcription/translation of the viral E1A replication gene is essential in this matter. Thus, to characterize the transcriptional targeting of our vectors in NSCs, glioma and normal brain, we performed quantitative reverse transcription PCR (RT-PCR) of certain genes of interest (Figure 3). We have previously screened several glioma cell lines and patient specimens in hope of identifying gene expression profiles that would suit transcriptional targeting maneuvers.15 We performed a similar analysis in NSCs, two cell lines (U87MG and U373MG), seven human GBM specimen and normal brain tissue (NB) (Figure 3). With the exception of two subsets (GBM5 and GBM13), survivin and CXCR4 transcriptional activity was notably robust in glioma cells, yet relatively attenuated in NB. These results suggest that a vector harboring a survivin or CXCR4 promoter element that controls viral replication and oncolysis may be appropriate for NSC-mediated delivery to glioma.
Figure 3.
Transcriptional targeting of oncolytic vectors. Survivin and CXCR4 transcriptional activity in NSCs, human glioma and normal tissue. Quantitative RT-PCR analysis was performed to measure the transcriptional activity of survivin and CXCR4 in NSCs, glioma cells lines (U87MG, U373MG), human glioblastoma multiforme tissue specimen (GBM) and normal brain tissue (NB). *P-value <0.05 vs CXCR4.
Viral replication and cytolysis in NSCs and U87MG
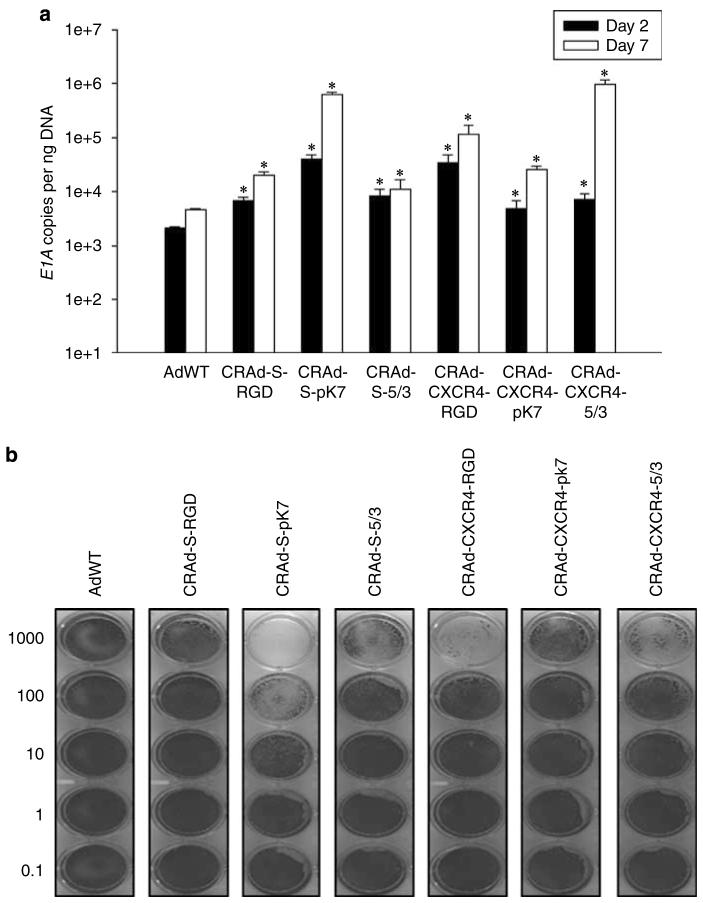
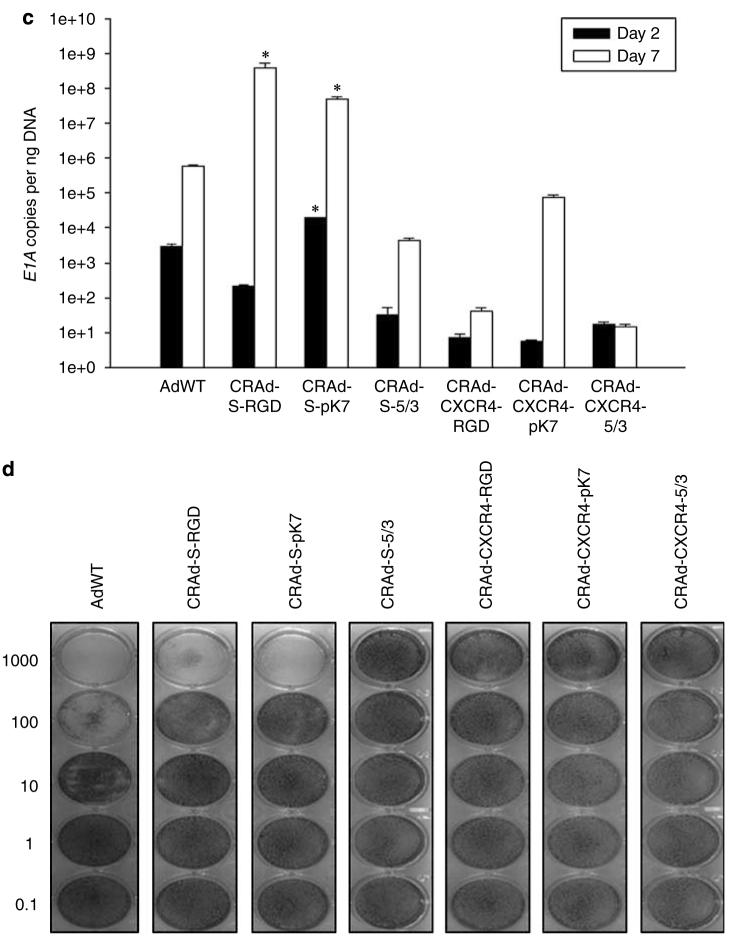
Having addressed both the transcriptional and transductional questions of different vectors in NSCs and glioma cells, we wished to confirm these findings by performing an analysis of viral replication and cell killing with vectors containing different knob orientations and transcriptional regulation cassettes. As viral replication and resultant tumor cytotoxicity are a function of particle binding and internalization, vector gene transcription (E1A gene), vector amplification and ultimately progeny production (oncolysis), these studies represent a comprehensive evaluation toward identifying an ideal vector for NSC-mediated delivery of an oncolytic agent. Having this in mind, it is important that the chosen oncolytic vector is sufficiently toxic to glioma, yet is moderately toxic to the carrier—NSCs. To address these questions, we performed semiquantitative analysis of viral replication and cytotoxicity by quantitative RT-PCR and crystal violet staining, respectively, in both NSCs and U87MG.
Our results indicate that CRAd-S-pk7 and CRAd-CXCR4-5/3 are suitable vectors for NSC-mediated delivery to glioma (Figure 4). Both CRAd-S-pk7 and CRAd-CXR4-5/3 show relatively attenuated replicative cytotoxicity in NSCs; however, the same vectors also show sufficient replicative cytotoxicity in U87MG. Taken together, these results indicate that CRAd-S-pk7 and CRAd-CXCR4-5/3 vectors fulfill the criteria of limited toxicity to NSCs, yet potent replicative toxicity to glioma, which we had outlined at the beginning of this study.
Figure 4.
Replication and cytotoxicity profiles of oncolytic adenoviral vectors in U87MG and NSCs. The replicative capacity of each indicated vector was measured using quantitative RT-PCR. The extent of genome amplification in each cell type was determined by measuring the number of viral E1A copy numbers per nanogram of DNA. Genome amplification was quantified at 2 days (black bars) and 7 days (white bars) after initial infection with each vector in U87MG (a) or NSCs (c). The cytotoxicity of each viral vector was also assessed in U87MG (b) or NSCs (d) using crystal violet staining of cell monolayers. Cells were infected with each vector at the indicated doses (1000–0.1 vp (viral particles) per cell), and the degree of cell monolayer confluency was assessed 10 days after the day of infection. Cell lysis and consequent monolayer disruption are indicated by transparent regions in a well, whereas a lack of replicative cytotoxicity is indicated by a monolayer of cells that stain dark and appear opaque. *P-value <0.05 vs AdWT.
NSCs migrate in response to glioma cells in vitro and in vivo
The allure of NSC-mediated delivery of an oncolytic vector is that both the vector and the carrier are ‘bio-responsive’ to molecular and physiologic cues of glioma. We believe that NSCs could potentially provide specific and potent distribution of an oncolytic vector. As such, we wished to test if the migratory capacity of our NSCs was specific for glioma (Figure 5a). Using an in vitro migration chamber, we observed that NSCs migrate in response to conditioned medium from U87MG cells but not to conditioned medium from normal human astrocytes or serum-free media (negative control) (P<0.05). These findings confirm the preferential homing nature of NSCs for U87MG cells.
Figure 5.
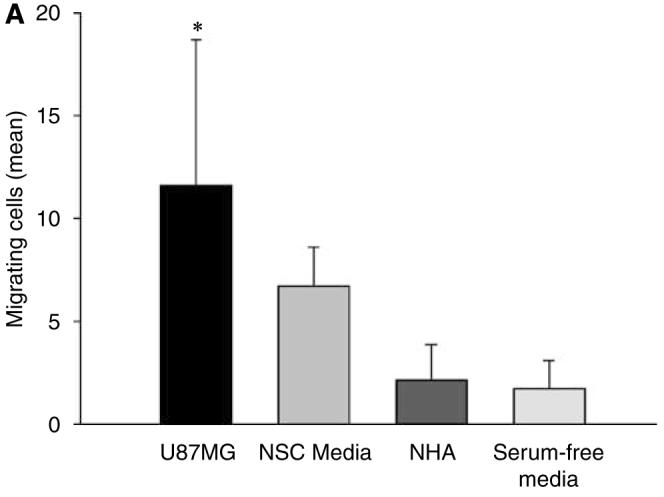
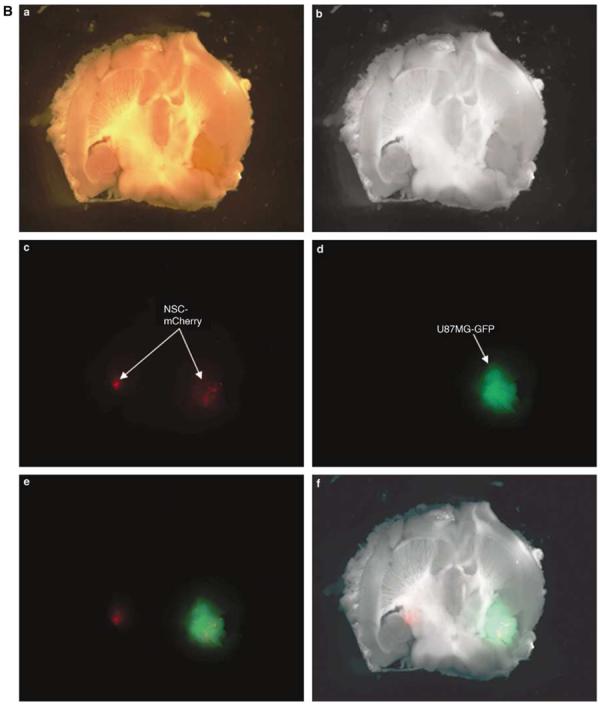
NSCs migrate in response to glioma. (A) An in vitro migration assay was conducted using a migration chamber (see Materials and methods section). NSC, NHA, U87MG cells were cultured for 24 h in serum-free or growth factor-free (NSC) media. After a 24-h incubation period, the medium from each cell type was placed in the bottom of the migration assay chamber. Cells that migrated through the porous membrane in response to the conditioned media were quantified by counting the number of migrating cells in five random × 10 field views. The bar graphs represent the average number of migrating cells per × 10 high-power field (± s.d.). As shown, NSCs migrate preferentially in response to media conditioned from U87MG cells (11.63±7.06) and not normal human astrocytes (2.12±1.75; P<0.05) (B) In vivo assessment of NSC migratory potential toward malignant glioma. A total of 5 × 10⁵ U87MG-GFP cells were injected into the right hemisphere of male nude mice. Two weeks later, 5 × 10⁴ NSC-mCherry cells were injected directly contralateral to the site of U87MG-GFP injection. To observe NSC-mCherry migration, mice were killed, brains were extracted and underwent serial 500 μm axial sectioning on a vibratome until a total cut depth of 3 mm was reached. The data presented show a mouse brain that was extracted 12 days after NSC-mCherry implantation. Images were captured using a fluorescent stereomicroscope. (a) Bright phase image of mouse brain; (b) grayscale rendering; (c) live NSC-mCherry cells visualized using the Cy3 channel (red band-pass filter); (d) U87MG-GFP cells are visualized using a GFP channel (green band-pass filter); (e) overlay of Cy3 and GFP channels and (f) overlay of grayscale, GFP and Cy3 captured images. *P-value <0.05.
We also wished to examine if our NSCs could migrate specifically in response to glioma in vivo. We assayed in vivo migration using a two-color fluorescent confocal microscopy approach. Using U87MG cells that are constitutively expressing green fluorescent protein (U87MG-GFP) and NSCs constitutively expressing the mCherry red fluorescent protein (NSC-mCherry), we were provided with a clear and detailed anatomic representation of specific NSC migration in response to glioma pathophysiology. We observed specific and appreciable engraftment of NSC-mCherry cells into malignant glioma 12 days after NSC-mCherry cells were injected in the hemisphere directly contralateral to the U87MG-GFP injection site (Figure 5b). These in vivo results confirm our in vitro studies, which show that these NSCs are capable of migrating to U87MG cells in a specific manner. It can be noted that we observed the presence of these cells up to 12 days after injection, indicating that these cells engraft and remain viable in the tumor region for a sustained period of time.
NSC-mediated delivery of an oncolytic Ad in vitro
Having shown the ability of NSCs to internalize and remain permissive for Ad genome amplification, we tested these preliminary findings by performing delivery studies using our identified vectors, CRAd-S-pk7 and CRAd-CXCR4-5/3. In this study, we wished to examine what type of vector is better suited for NSC-mediated delivery; one with low NSC replicative cytotoxicity/high U87MG cytotoxicity (CRAd-CXCR4-5/3), or one with moderate NSC replicative cytotoxicty/high U87MG cytotoxicity (CRAd-S-pk7). Using a matrigel migration plate, our studies indicate that incubation of NSCs with an oncolytic vector does not significantly affect NSC migration (Figure 6a). As shown in Figure 6b, CRAd-S-pk7 vector showed better NSC-mediated delivery, indicated by an increased E1A copy number measured in the U87MG cells plated at the bottom of the migration chamber. Taken together, Figures 6a and b indicate that NSCs can internalize CRAd-S-pk7, migrate to U87MG and remain permissive for viral replication, suggesting the feasibility of this carrier/vector combination for future in vivo studies.
Figure 6.
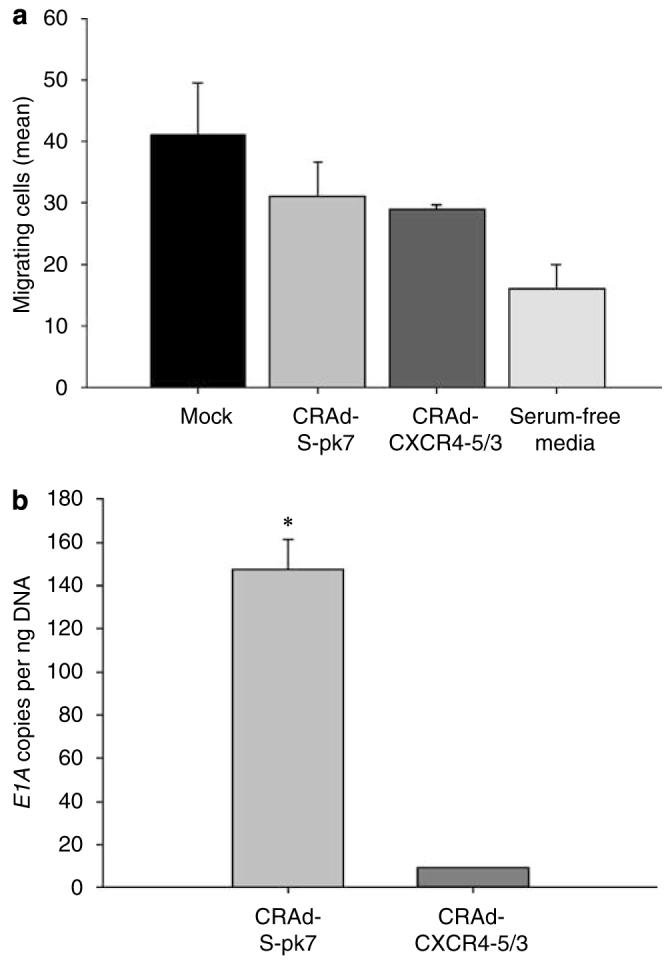
NSCs deliver an oncolytic virus to U87MG cells in vitro. (a) The ability of NSCs to deliver the two oncolytic adenoviruses, CRAd-CXCR4-5/3 and CRAd-S-pk7, to U87MG cells was assessed using the same migration plate and assay methods used in Figure 5a. NSCs were incubated with each vector for 1 h at a viral titer of 100 vp/cell. After loading of NSCs, cells were lifted and plated in multiwell migration inserts (105 NSCs/well) above U87MG cells, which had been plated 2 days before NSC plating. Twenty-four hours after plating of loaded or non-loaded NSCs, the number of migrating cells was quantified. Bar graph represents the average number of migrating cells counted per random × 10 field view. (b) The ability of NSCs to deliver a replicating adenovirus was assessed by removing the cells at the bottom of the chamber and quantifying the number of viral E1A copy numbers 48 h after initial plating of NSCs at the top of the migration chamber. The graph represents the number of viral E1A copies that were quantified from cells in the bottom of the migration chamber. *P-value <0.05.
NSCs deliver CRAd-S-pk7 and enhance vector distribution in vivo
Up to this point, we have shown that NSCs are capable of internalizing and delivering an oncolytic vector to U87MG glioma cells in vitro. We next wished to ask if we could observe similar results in an in vivo nude mouse model. To assess both NSC-mediated delivery and distribution of an oncolytic Ad in vivo, we chose to analyze the migration and viability of loaded NSC-mCherry cells with respect to U87MG-GFP by fluorescence-activated cell sorting (FACS) (according to scheme in Figure 7a) and fluorescent microscopy. To analyze the delivery and distribution of a replicating Ad by NSCs, we chose to perform laser capture microdissection of mouse brain tissue that had received NSC-Ad or Ad injections and subsequently measure the distribution of the viral E1A gene by quantitative PCR (qPCR). Combined, this approach represents an in-depth and stringent analysis of NSC's ability to deliver an oncolytic vector to a U87MG model of malignant glioma.
Figure 7.
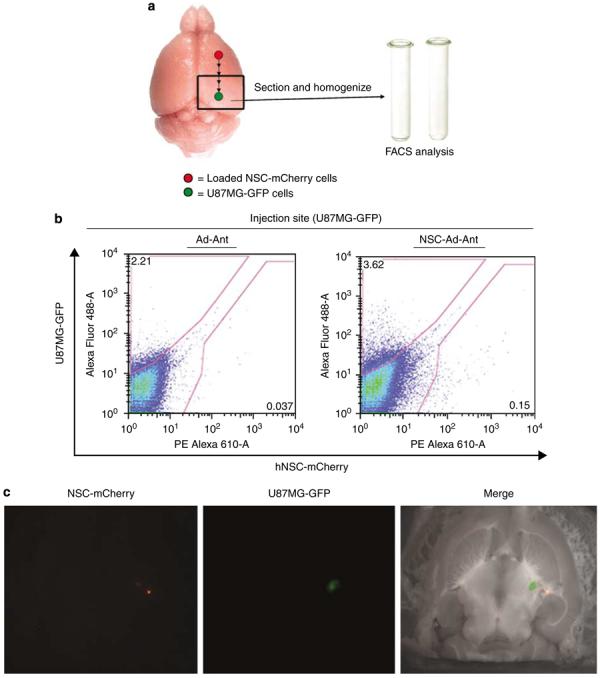
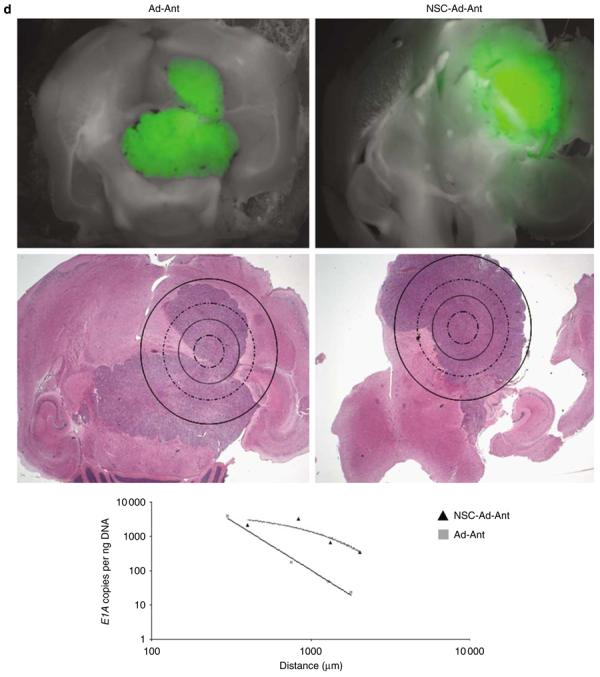
NSCs deliver CRAd-S-pk7 oncolytic adenovirus and enhance vector distribution in an intracranial glioma model. Experimental schematics (a). The presence of live, loaded NSC-mCherry cells at the site of U87MG-GFP implantation was assessed by flow cytometry (b). The data shown represent nude mouse brains that were extracted 4 days after loaded NSC-mCherry or CRAd-S-pk7 were injected at a site anterior to the tumor injection site (18 days after U87MG-GFP implantation). The presence of U87MG-GFP is represented by an upward shift on the y-axis (AlexaFluor488-A; green band-pass filter), whereas the presence of NSC-mCherry cells is indicated by a rightward shift on the x-axis (PE Alexa 610-A; red band-pass filter). A shift on both axes describes the presence of both NSC-mCherry and U87MG-GFP cells in roughly the same anatomical location of the brain (U87MG-GFP injection site). Numbers on representative dot plots indicate the percentage of total cells processed (total: 50 000 events collected and recorded). The presence of loaded NSC-mCherry cells with respect to U87MG-GFP was also assessed by fluorescence microscopy 4 days after injection of loaded NSC-mCherry injection anterior to the U87MG-GFP injection site. Left: Cy3 (red) band-pass filter was used to detect the presence of live NSC-mCherry cells. Middle: GFP (green) band-pass filter channel was used to detect the presence of live U87MG-GFP cells. Right: Merged image (Grayscale+Cy3+GFP) (c). Laser capture microdissection (LCM) analysis and qPCR assessment of CRAd distribution (d). To investigate the role of NSC in CRAd distribution throughout U87MG-GFP tumors, mice were killed at day 12 after loaded NSC-mCherry implantation anterior to the tumor injection site (26 days after U87MG-GFP implantation). After fluorescent microscope observations were recorded, the same mice brains were fixed and embedded in paraffin tissue blocks. The processed tissue then underwent serial 6 μm sections onto glass slides or slides specifically made for LCM analysis. After the injection site had been identified by H&E, sections of tissue were laser-captured at varying distances from the injection site in separate tubes. DNA was extracted from the collected tissue and the number of viral E1A copy numbers was quantified by PCR techniques. As shown (middle row, H&E), tissue was collected separately at increasing distances from the identified injection site by drawing concentric circles of increasing diameter around the injection site. Viral E1A copy numbers were quantified (y-axis) as a function of the distance from the injection site (x-axis). Best-fit trend lines and equations were obtained using Microsoft Excel. Data shown are representative of n = 4 mice from each group killed at day 12 after viral injection anterior to the tumor injection site (loaded or Ad by itself). Ad: CRAd-S-pk7; Ant: anterior injection; NSC: NSC-mCherry.
As shown in Figure 7b, we were able to detect the presence of live NSC-mCherry cells (rightward shift) in roughly the same anatomical location as proliferating U87MG-GFP cells (upward shift) 4 days after implantation of loaded NSC-mCherry cells anterior to the tumor injection site (NSC-Ad-Ant). These findings were corroborated with fluorescent microscope analysis of brain tissues receiving loaded NSC-mCherry injections (Figure 7c). When loaded, NSC-mCherry cells are injected anterior to the U87MG-GFP site, live NSC-mCherry cells (red) could be visualized in close proximity to the tumor (green).
The main goal of NSC-mediated delivery of an oncolytic Ad is to achieve adequate distribution of an oncolytic vector. As these NSCs showed a characteristic ability to engraft and distribute throughout the tumor bed, we hypothesized that this would allow for better distribution of an oncolytic vector when compared with the delivery of genes using only Ad by itself. To study NSC-mediated viral gene delivery, we conducted qPCR of laser-captured brain tissue sections from mice receiving injections of CRAd-S-pk7 with or without loading into NSC-mCherry cells anterior to the tumor injection site (Figure 7d). First, we found that CRAd-S-pk7-loaded NSCs that were injected anterior to the U87MG-GFP injection site (NSC-Ad-Ant) showed an enhanced E1A gene distribution away from the injection site and throughout the tumor. When delivered by NSCs, CRAd-S-pk7 E1A gene distribution could be best described using an exponential function (y=5262.4e−0.0013x R2=0.8098). On the other hand, CRAd-S-pk7, when injected alone (Ad-Ant), showed E1A gene distribution that dropped drastically when tissue was sampled at increasing distances away from the injection site and throughout the tumor. CRAd-S-pk7, delivered alone, could be best described using a power function (y=5e+10x−2.8938; R2=0.9888). What's more, at a site corresponding to a distance of roughly 5 mm away from the site of injection, NSC-Ad-Ant delivery demonstrated approximately a 15-fold increase in E1A copy numbers (NSC-Ad-Ant: 352 copies; Ad-Ant: 23 copies). These findings indicate that NSC-mediated delivery of an Ad results in enhanced distribution of a given oncolytic virus.
NSCs loaded with CRAd-S-pK7 reduce tumor growth
Ultimately, the benefit of any proposed therapy would be a reduction or delay in tumor growth. To investigate the therapeutic efficacy of NSC-mediated CRAd delivery, we conducted an in vivo study using athymic mice that had received subcutaneous flank injections of U87 tumor cells. As shown in Figure 8, mice receiving intratumoral injections of CRAd-loaded NSC showed an overall reduction in tumor volume (mean volume (mm3): 69.4±16.5), when compared to mice receiving intratumoral injection of CRAd-S-pk7 (138.1±22.7) or saline solution (MOCK: 235.9±63.3). These results indicate a clear benefit to NSC-mediated CRAd delivery to tumors in vivo.
Figure 8.
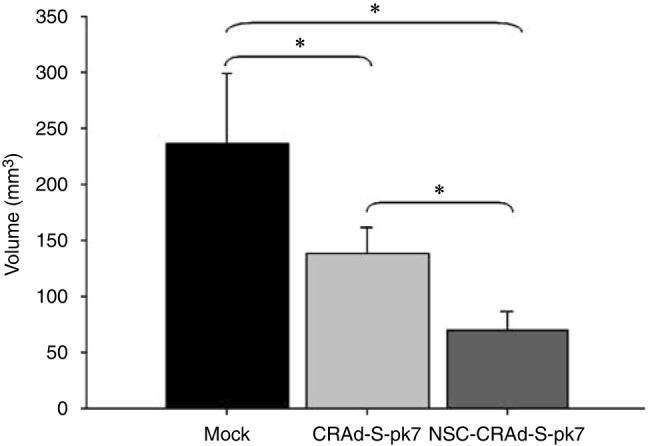
NSC-mediated delivery of a CRAd shows an enhanced antitumor effect. Male, athymic (nude) mice received subcutaneous injections of 1 × 10⁶ U87 tumor cells into the right hind leg (flank). One week after tumor implantation, the tumor was visible and the mice received intratumoral injections as follows: 100 μl of PBS solution (MOCK; n = 5); 1 × 10⁹ vp of CRAd-S-pk7 (n = 5) or 1 × 10⁶ NSCs loaded with 1000 vp/cell (1 × 10⁹ vp; n = 5) of CRAd-S-pk7. Ten days after experimental treatment, tumor volumes were recorded for each treatment group. Data are presented as mean tumor volume for each experimental group, with error bars representing standard deviation in a treatment group. *P-value <0.05.
Discussion
Drug delivery to the brain represents a major obstacle to brain tumor therapy. The blood–brain barrier, along with confounding idiopathies associated with malignant brain tumors, makes it difficult for a particular drug to reach cytotoxic concentrations within the bulk of the tumor tissue. The experimental use of adenoviral vectors for the treatment of malignant glioma has been proven as a potential treatment strategy that one day may change the prognosis of patients diagnosed with this fatal disease. Indeed, many viral vectors have entered clinical scenarios to assess their toxicity against deadly tumors, including malignant glioma; however, the efficacy of such approaches remains a significant facet of viral therapy which deserves further attention.
The clinical efficacy of virotherapy—and many types of gene therapies, for that matter—has yet to be fully realized partly because the delivery rate of the therapeutic gene of interest remains an obstacle to scientific researchers.1,16 Stem cells—mesenchymal and neural—are attractive candidates for achieving selective distribution of therapeutic genes to tumors because they have been extensively documented as possessing a unique and specific tropism for tumor pathology in the brain.10,11,17-21 One potential advantage of MSCs is the feasibility of extracting them from the same patient, thus bypassing issues of immunity. NSCs, which are likely to be donor derived, may induce an immune response, although at least some reports indicate a low degree of immune response.22 Nevertheless, it remains to be determined which cell type will provide specific and adequate distribution of therapeutic genes to tumors. NSCs represent biological carriers that are ‘equipped’ (through cell surface expression, transcriptional profile and stem-like character) to respond to the pathological cues of tumors. Logically, these features make NSCs an optimal candidate for selective distribution of therapeutic genes, potentially more optimal than current liposomal delivery, antibody-based delivery or any other current gene therapy delivery system. The Aboody group10 has made significant headway in characterizing an immortalized NSC cell line's antitumor characteristics to the extent that a phase 1 NSC-mediated glioma therapy clinical trial is currently under development. In addition to this group's work, NSCs of different origin have been studied in a myriad of other diseases for their therapeutic potential.23-31
In this study, we have shown for the first time that an immortalized human NSC cell line is capable of affecting adequate distribution of the CRAd, CRAd-S-pk7. Our approach included a breadth of analyses that address the ability of NSCs to deliver an oncolytic Ad to malignant glioma. Admittedly, this is a considerable challenge. Using NSCs to deliver an oncolytic Ad bears an obvious hurdle—the viral lytic cycle. One consequence of loading NSCs with a replication-competent viral vector is that the virus will eventually lyse the NSC carrier. Indeed, this is somewhat of a double-edged sword. Vector amplification and particle release are desirable goals of NSC-mediated CRAd delivery. Theoretically, loading NSCs with virus should lead to logarithmic increases in vector titer in diseased regions of brain tissue, without increasing the number of injections. However, the vector must not lyse the NSC carrier before it sufficiently distributes throughout the tumor mass. With this in mind, our in vitro assays were conducted in a manner to identify a vector that displayed moderate replicative cytotoxicity to the carrier, yet potent cytotoxic effects to glioma cells. This approach allowed us to circumvent the use of additional agents that slow viral/cell replication and cell lysis, such as mimosine.32
Our approach to identify an optimal CRAd for NSC-mediated delivery, which included qPCR, cytotoxicity viral internalization (transduction), and in vitro delivery studies, led to the identification of two candidate CRAds, CRAd-CXCR4-5/3 and CRAd-S-pk7. Both vectors fulfilled our functional criteria outlined at the beginning of this study. However, when it came to our in vitro delivery studies, the CRAd-CXCR4-5/3 vector did not show optimal delivery results. We believe that this could most likely be explained by one logical explanation; that is, the 5/3 transductional modification did not render 5/3-modified vectors with significant transduction levels such that NSCs could not be adequately loaded to observe delivery and vector amplification (see Figures 2 and 6). This came as somewhat of a surprise, because NSCs exhibited significant CD46 expression (Figures 2a and b), the target of 5/3-modified vectors.13 This may result from the fact that cellular localization of the CD46 protein does not render NSCs particularly susceptible to loading with 5/3-modified vectors. The same argument could be made regarding our finding that NSCs expressed significant αvβ3 and αvβ5 integrins, but were relatively less susceptible to transduction by RGD-modified Ad vectors. We speculate that this may have occurred because infections were conducted in monolayer cultures, which are, in essence, two-dimensional. Cells may express CD46 and integrins largely on the cell surface–plastic interface, preventing efficient entry by vectors possessing 5/3 and RGD modifications, but still show significant expression upon fluorescent analysis. Otherwise, our flow cytometry data support our observations from transduction experiments. Despite this, we felt fortunate to identify the CRAd-S-pk7 vector as a suitable candidate for our studies, considering that we have shown the capability of this CRAd for targeted glioma toxicity by itself.9 This particular CRAd displayed limited toxicity to the NSC carrier, superb levels of NSC transduction, potent cytotoxicity to glioma cells and could be delivered to U87MG cell in vitro, legitimizing its use for further in vivo study. On the basis of our observations, we chose to load NSCs with 100 vp (viral particles) per cell of CRAd-S-pk7 for in vitro and in vivo studies, because infections at this titer showed little-to-moderate replicative cytotoxicity to the NSC carrier.
Monitoring the efficacy of brain tumor therapy is a challenging experimental endeavor. Nevertheless, the use of lentiviral-based fluorescent systems has been proven as useful for tracking the fate of NSCs in vivo.33 FACS, fluorescent microscopy and qPCR analysis of viral E1A gene distribution were used to stringently describe NSC viability and gene delivery when loaded with oncolytic Ad. Such approaches allowed us to observe that loaded NSCs were detectable in mice brains at day 4 after NSC-mCherry implantation. However, we noted the presence of non-loaded NSC-mCherry cells up to 12 days after intracranial injection (Figure 5b). These findings are in agreement with earlier studies, which found that NSC lacking therapeutic transgenes or drug treatments that prematurely kill NSCs can remain in the brain from 2 to 12 weeks after implantation; although, this exceeded our time point for observations.34-37 We suggest that the absence of any observed loaded NSC-mCherry cells in the mouse brain could likely be the result of viral cell lysis of the NSC carrier; however, several factors that remain beyond the scope of this investigation are equally likely, such as clearance of carrier/viral load by local immune system, clearance by cerebrospinal compartments and leakage into other organ systems. It can be noted that, however, we observed that in the absence of observable tumor burden (as determined by GFP and H&E (hematoxylin and eosin) pathological analysis), NSC-mCherry expression was found localized to areas of the brain corresponding to the ventricular compartments, a phenomenon that has been similarly observed by different researchers.33,38,39 These observations underscore the need to more properly describe the molecular mechanisms that render NSCs particularly ‘equipped’ to migrate throughout the brain parenchyma in response to tumor pathophysiology. This aspect of NSC biology remains an elusive challenge for researchers, because NSC migration likely varies with respect to a combination of confounding factors, including anatomical delivery location, growth factor gradients, stem-like character of the cell, and so on.10 Regardless, it is necessary that these particular traits of NSCs, and stem cells in general, are defined before they enter clinical assessment.
Indeed, a noteworthy limitation of virotherapy is that the injected vector has a gene distribution that is confined to areas immediately surrounding the injection tract. We were able to observe enhanced distribution of CRAd-S-pk7 that persisted throughout the tumor area, as measured by laser capture microdissection and qPCR. These findings indicate that NSCs are capable of adequately distributing an oncolytic vector in vivo. In agreement with such findings, when CRAd-S-pk7 was delivered using NSCs, the distribution of the viral E1A gene was marked by elevated copy numbers throughout the tumor region. Most importantly, NSCs loaded with CRAd-S-pk7 significantly inhibited tumor growth in vivo.
A potential limitation of our study involves the use of a single tumor cell line. U87MG is a well-known human glioma cell line that produces a reliable in vivo growth pattern. Other human glioma cell lines, such as A172 or U373MG, do not establish tumors in a predictable manner. Nevertheless, we believe that the findings obtained with U87MG can have meaningful extension to other tumor types. Earlier studies investigating the use of immortalized NSCs have found that NSCs can target antitumor therapies to heterogeneous and spontaneous tumor types, including medulloblastoma,19 disseminated neuroblastoma24,25,40 and colon carcinoma,41 to name a few. Aboody and colleagues have shown the ability of an immortalized NSC cell line, HB1.F3, to deliver the rat carboxylesterase gene in the form of a human, replication-deficient Ad (rCE). The rabbit form of carboxylesterase very effectively converts irinotecan (CPT-11) to an active and potent inhibitor of topoisomerase I (SN-38). Researchers found that HB1.F3 cells transduced with Ad expressing rCE delivered intravenously and in combination with CPT-11 produced a 90% long-term survival rate (>1 year) in mice harboring multiple disseminated (metastatic) neuroblastoma. These findings have promising corollaries with the work conducted in this study. If NSCs are to act as carriers for an Ad, replication-deficient or -competent, it will be necessary to characterize the factors that affect viral loading of a stem cell, transgene expression and NSC delivery when carrying viral cargos. In this way, factors that affect virus-mediated gene expression and NSC-mediated viral delivery can be optimized at the level of the recombinant virus, such that the therapeutic potential of the NSC-vector combination can be fully realized.
In conclusion, we show for the first time that NSCs are capable of delivering a CRAd vector, CRAd-S-pk7, to an intracranial model of glioma. Our findings suggest that NSC-mediated delivery of CRAd-S-pk7 enhances the distribution of the vector, when compared with administration of the CRAd-S-pk7 vector by itself (see Figure 7d). These findings have a significant yet broad application in the gene therapy research field. We, along with countless others in the research community, feel that stem cells may one day provide a feasible platform for the treatment of many diseases, specifically cancer. Having shown that NSCs mediate enhanced distribution of a therapeutic gene in the form of an oncolytic Ad vector, it is likely that extensions of these studies will open the door for other gene therapies using NSCs. We have now shown that both NSCs and MSCs are capable of delivering an oncolytic vector to intracranial tumors. It remains to be answered which carrier is more suitable for delivering oncolytic viral vectors to glioma and is thus more efficacious in providing an adequate anti-tumor effect. This is an ultimate goal for future studies and the identification of the most optimal carrier/vector combination will make significant headway into these cellular delivery paradigms soon entering the clinical forum.
Materials and methods
Cell culture and establishment of fluorescent-labeled cell lines
The U87MG and U373MG human glioma cells were purchased from the American Tissue Culture Collection (Manassas, VA, USA) and maintained according to vendor recommendations. U87MG cells were cultured in MEM (minimum essential medium) (HyClone, Thermo Fisher Scientific, Waltham, MA, USA) containing 2% penicillin-streptomycin antibiotic (Cellgro, Mediatech, Inc., Manassas, VA, USA) and 10% fetal bovine serum (FBS; Atlanta Biologicals, Lawrenceville, GA, USA). The normal human astrocyte cell line (NHA) was purchased from Cambrex-Clonetics (East Rutherford, NJ, USA). Both NHA and U373MG cells were grown in DMEM (Dulbecco's modified Eagle's medium) (HyClone, Thermo Fisher Scientific) with 4.5 g l−1 glucose and L-glutamine, supplemented with 10% FBS (Mediatech, Inc., Manassas, VA, USA). All cells (including NSCs) were grown in a humidified atmosphere with 5% CO2 at 37 °C conditions. NHA, U87MG and U373MG cells subcultured for experimentation were lifted using 1 ml/106 cells 0.25% Trypsin/2.21 mM EDTA solution (Mediatech Inc.; cat. no. 25-053-CI). The trypsinase activity was quenched using the appropriate media for each cell type. Cells were then washed at 300 relative centrifugal force (rcf) and plated at the indicated densities.
Human primary brain tumor specimen (GBM5, GBM7, GBM9, GBM13, GBM16 and GBM21) and NB were obtained from patients undergoing surgery in accordance with a protocol approved by the Institutional Review Board at the University of Chicago. Tumor specimens were confirmed as the World Health Organization grade IV malignant glioma by an attending neuropathologist. All human tissue specimens were treated with 1% hyaluronidase (Sigma-Aldrich, St Louis, MO, USA) and 2% collagenase (Sigma-Aldrich) enzymes and subsequently minced through 70 mm strainers. After several washings in phosphate-buffered saline (PBS) solution, cells were then cultured in flasks containing 10% FBS-DMEM supplemented with 100 μg ml−1 ampicillin/streptomycin and 20 ng ml−1 of epidermal growth factor (Millipore, Billerica, MA, USA) and basic fibroblast growth factor (Millipore). Cells were maintained in a humidified atmosphere containing 5% CO2 at 37 °C.
Human NSCs (ReNCell) were obtained from the Millipore and maintained according the manufacturer's protocol. Briefly, the NSCs used in these experiments were isolated from the cortical region of 14-week-old fetal tissue and immortalized by retroviral transduction and insertion of the c-myc gene. Cells were characterized according to their expression of nestin, SOX-2, CD133 and CD44 (data not shown) stem cell markers (see the Results section; Figure 1). Subcultures of human NSCs for experimentation were conducted as follows: tissue culture plastic dishes were coated with laminin (Sigma) at a concentration of 20 μgml−1 in serum-free DMEM in 37 °C and 5% CO2 atmospheric conditions 4 h before NSC plating. NSCs were detached from plastic dishes using 1 ml/106 cells of Accutase (Millipore), centrifuged at 300 rcf for 5 min, resuspended in ReNCell NSC Maintenance Medium (Millipore), supplemented with 20 ng ml−1 basic fibroblast growth factor (Millipore) and 20 ng ml−1 epidermal growth factor (Millipore) and seeded at the indicated cell densities.
The two stable, fluorescently labeled cell lines, U87-GFP and NSC-mCherry,42 were established as described earlier.43 Briefly, U87MG or NSCs were seeded at a density of 5 × 10⁴ cells/well (50–60% confluency) in six-well plastic culture dishes (BD, Franklin Lakes, NJ, USA). One day after initial seeding, cells were incubated for 24 h with replication-deficient lentiviral vectors containing GFP (U87MG) or mCherry (NSC) expression cassettes. After 48 h, media were replaced with fresh culture media appropriate for each cell type containing 1 μgml−1 Puromycin for the establishment of stable clonal populations, which expressed fluorescent protein (Sigma). Selected populations were screened by FACS to verify mCherry and GFP expression.
Viral vectors
The replication-deficient adenoviral vectors, AdWT-luc, AdWT-pk7, AdWT-5/3, AdWT-HI-RGD and AdWT-CRGD (Figure 2c), are adenoviral vectors lacking the E1A gene region and in its place contain a firefly luciferase expression cassette under the control of the cytomegalo-virus promoter.2 The replication-competent adenoviral vectors, AdWT, CRAd-CXCR4-5/3, CRAd-CXCR4-RGD, CRAd-CXCR4-pk7, CRAd-S-RGD, CRAd-S-5/3 and CRAd-S-pk7, retain the wild-type E1A gene, which controls viral replication. AdWT is the wild-type Ad5. CXCR4-modified vectors (CRAd-CXCR4-5/3, CRAdCXCR4-RGD and CRAd-CXCR4-pk7) or survivin-modified vectors (CRAd-S-5/3, CRAd-S-RGD CRAd-S-pk7) contain the wild-type Ad replication protein, E1A, under the control of either human CXCR4 or survivin promoters. These vectors have been created by homologous recombination between a shuttle plasmid containing either the human CXCR4 or survivin promoter upstream of the viral E1A gene. Shuttle plasmids containing these regions were homologously recombined into adenoviral plasmids containing different modifications in the Ad fiber structure, such as an RGD incorporation into HI loop of wild-type fiber protein, or polylysine incorporation into the C terminus of the wild-type fiber knob protein or complete replacement of the type 5 fiber knob protein for knob protein from the type 3 Ad.9,11,15
Luciferase assay
To measure the level of NSC transduction, NSCs were plated at a density of 5 × 10⁴ cells/well in 24-well plastic culture dishes. The next day, cells were treated with the recombinant adenoviral vectors AdWT-luc, AdWT-pk7, AdWT-5/3, AdWT-HI-RGD and AdWT-C-RGD at a titer of 1000 vp/cell. After a 1- or 24-h incubation period, viral-containing media were removed and replaced with fresh ReNCell media. After 48 h initial treatment with virus, cells were harvested and subsequently assayed for luciferase activity (Promega, Madison, WI, USA). All measurements were conducted in triplicates. Relative transduction levels with each vector are represented as RLU per mg protein.
Analysis of viral replication
U87MG cells and NSCs were plated at a density of 5 × 10⁴ cells/well. The next day, cells were infected with 10 vp/cell of AdWT, AdRGD, Ad5/3, CRAd-CXCR4-5/3, CRAd-CXCR4-RGD, CRAd-CXCR4-pk7, CRAd-S-RGD, CRAd-S-5/3 or CRAd-S-pk7. After a 1-h incubation period, virus-containing media were removed, cells were washed with PBS and fresh portion of complete growth media was added. Infected cells were harvested at days 2 and 7 after the day of infection. Total DNA was extracted from infected cells using a DNeasy Tissue Kit (Qiagen, Hilden, Germany) according to the manufacturer's protocol. Gene expression was quantified by real-time quantitative PCR using SYBR Green PCR Master Mix (Applied Biosystems, Foster City, CA, USA) and primers recognizing the viral E1A gene.11 DNA amplification was carried out using an Opticon 2 system (Bio-Rad, Foster City, CA, USA), and the detection was performed by measuring the binding of the fluorescent dye, SYBR green. Each sample was run in triplicates. Results are presented as the average number of E1A copies per nanogram of DNA (E1A copies per ng DNA).
Analysis of CXCR4 and survivin mRNA expression
The relative expression of human CXCR4 and survivin mRNA transcripts was assessed in the NSC, U373MG and U87MG cell lines, resected malignant glioma specimens (GBM5, −7, −9, −13, −16, −21) and NB. Total cellular RNA was isolated by RNeasy kit (Qiagen) and RNA was reverse-transcribed using Superscript II system reagents (Invitrogen) according to the manufacturer's protocol. The expression of transcripts was assessed by PCR amplification using primers described elsewhere.15 Each subset was amplified in triplicates and products were analyzed by Opticon 2 software and presented as ratio between levels of target transcript expression to the level of cellular glyceraldehyde 3-phosphate dehydrogenase.
Crystal violet staining of cell monolayer
To assess the level of replicative cytotoxicity mediated by each CRAd, cell monolayers were washed twice with PBS followed by treatment with a 2% (w/v) methanolic solution of Gentian Violet (Ricca Chemicals). Plates were incubated at room temperature for 20 min in said staining solution. After staining, cells were washed thoroughly with H2O and air-dried for 24 h. Images were taken and analyzed using a ChemiDoc XRS imaging system (Bio-Rad).
Flow cytometry analysis of protein expression
Cells were labeled and analyzed for surface markers using a two-antibody staining system. First, cells were incubated with 1 μg/106 cells/100 μl 1.0% FBS (w/v) PBS solution for 30 min. After primary antibody labeling, nonspecific/extra antibody was removed by washing cells twice with PBS solution and spinning at 300 rcf for 5 min. Second, cells were stained in the same conditions as described above with a secondary antibody conjugated either to a fluorescein isothiocyanate (FITC) or phycoerythrin (PE) fluorochrome. After secondary antibody labeling, cells were washed and bench top acquisition was conducted on a BDFACSCanto (BD) using BDFACSDiVa software. Data analysis of FACS dot plots was performed using FlowJo v8.7.2 website software (http://www.flowjo.com). Gates were drawn based on negative control samples incubated only with the secondary PE- or FITC-labeled antibodies. The following primary and secondary antibodies were used to analyze surface protein expression on NSCs: primary (anti-human), CD46 (BD); CD44 (LabVision, Fremont, CA, USA); CD133-PE (Miltenyi Biotec, Bergisch Gladbach, Germany); CD138(syndecan-1)-PE (eBioscience, San Diego, CA, USA); αvβ3 (Millipore); αvβ5 (Millipore); CAR (Abcam, Cambridge, MA, USA); Perlecan (eBioscience) and secondary antibodies: FITC-conjugated goat anti-rabbit (Santa Cruz Biotechnology, Inc., Santa Cruz, CA, USA) or rabbit anti-mouse (BD) antibody.
Intracellular staining
Intracellular staining was performed to detect the level of intracellular SOX-2 (Millipore) and nestin (Millipore) protein expressions using BD Cytofix/Cytoperm Fixation/permeabilization (BD) reagents according to the manufacturer's protocol. Similar to the surface staining, staining was performed with a two-antibody system using primary antibody specific for intracellular SOX-2 or nestin proteins and secondary FITC-labeled antibodies. Briefly, cells first were fixed using fixative solution (BD) and incubated for 20 min on ice followed by washing twice with permeabilization buffer (BD). Cells were then incubated with primary antibodies dissolved in permeabilization buffer (1:50 v/v dilution) for 30 min on ice. After incubation with primary antibodies, cells were washed with permeabilization reagent and finally incubated with permeabilization buffer containing secondary FITC-labeled antibody for 30 min. Subsequently, cells were washed twice with wash buffer and subjected to flow analysis by the same methods described above for surface staining.
Evaluation of NSC migration and viral delivery in vitro
To analyze the migratory and oncolytic Ad delivery characteristics of NSC in vitro, we used a similar system described earlier,11 with slight modification. To characterize the specificity of NSC migration in response to glioma, we used a BD Biocoat Tumor Invasion System (BD Biosciences, http://www.bdbiosciences.com) containing BD Falcon Fluoroblock 24-Multiwell inserts (8-μm pore size; PET membrane) in accordance with the manufacturer's protocol. NSCs were labeled with a Vybrant carboxyfluorescein diacetate (CFDA-SE) succinimidyl ester (5 μM) cell tracer (Invitrogen, Carlsbad, CA, USA) according to the manufacturer's instruction. The migration was characterized with respect to four different chemoattractant gradients. NSC, U87MG and NHA cells were cultured in serum-free/growth factor-free media for 24 h, after which, equal amounts of each conditioned medium was aliquoted in the bottom wells of the migration chamber to act as a chemoattractant for plated NSCs. For migration studies without Ad, NSCs were plated at a density of 25 × 103 cells/well. Experiments were conducted in triplicates for each subset. Conditioned media from NSC and serum-free media were used as positive and negative controls, respectively. After 24 h of initial plating of NSCs into the top insert, the number of migrating cells per well was counted using an Olympus IX81 inverted microscope and MetaMorph software (Olympus, Tokyo, Japan). Cells were counted in five random field views/well ( × 10 objective lens) and the average was taken for each experimental condition. For studies involving NSC-mediated delivery of Ad, the same migration system was used; however, NSCs were loaded with each vector (CRAd-S-pk7; CRAd-CXCR4-5/3) at a concentration of 100 vp/cell 1 h before plating loaded NSCs in the top chamber matrigel inserts (105 cells/well). Instead of conditioned medium, U87MG cells were plated in the bottom wells of the migration chamber in serum-free MEM at a density of 5 × 10⁴ cells/well 2 days before experimentation. Each experimental subset was conducted in triplicates. Non-loaded NSCs were plated in chambers immersed in serum-free MEM as a reference control. The number of migrating cells was assessed as described above. Two days after plating loaded NSCs in the top inserts, viral replication in the bottom wells was assessed by quantitative RT-PCR techniques as described elsewhere in this section.
Animal studies
Male athymic/nude mice were obtained from Charles River Laboratory (Wilmington, MA, USA). Animals were cared for according to a study-specific animal protocol approved by the Institutional Animal Care and Use Committee. For migration studies conducted with NSC that were not loaded with Ad, 5 × 10⁵ U87MG-GFP cells were injected as described earlier.11 Seven days after tumor implantation, three mice were killed to confirm the presence of viable tumor cells according to GFP expression measured by FACS using an AlexaFluor488 (green) band-pass filter on a Becton Dickinson LSRII flow cytometer (BD). The same check was conducted at day 13 after U87MG-GFP injection (1 day before NSC-mCherry injection) to confirm tumor viability. Fourteen days after tumor implantation, a total of 16 mice were injected with 5 × 10⁴ NSC-mCherry cells contralateral to the U87MG-GFP injection site. Mice were randomly subdivided into four groups to assess NSC-mCherry migration and viability at 4-day intervals after NSC-mCherry injection (4, 8, 12 and 16 days after NSC-mCherry injection). The migration of NSC-mCherry was observed using an Olympus SZX12 stereomicroscope. Fluorescent analysis of NSC-mCherry migration was conducted using Cy3 (Red) and GFP (Green) optical band-pass filters. Images were captured through a × 1.2 objective lens using an AxioCam HRc digital camera (http://www.zeiss.com/) and OpenLab software v 5.0.0 (http://www.improvision.com/) and rendered for publication using Adobe Photoshop v8.0 (http://www.adobe.com/).
In vivo studies conducted which included the use of the CRAd, CRAd-S-pk7, were conducted as follows. A total of 24 male nude mice were stereotactically injected with 1 × 10⁶ U87MG-GFP cells in 5 μl PBS as described above. As above, tumor progression was monitored by FACS at days 7 and 13 after the day of implantation. Fourteen days after U87MG-GFP injection, mice were randomly separated into two groups: one group receiving 1 × 10⁸ vp in 5 μl PBS directly anterior to the tumor implantation site and another group receiving injections with loaded NSCs directly anterior to the tumor injection site. NSCs were loaded with CRAd-S-pk7 viral particles at a density of 100 vp/cell (see the Materials and methods section) and subsequently stereotactically injected either directly into the tumor injection site or into a earlier drilled burr hole 3 mm directly anterior to the tumor injection site. Loaded NSC-mCherry cells were injected into each site at a density of 5 × 10⁵ cells/5 μl PBS solution.
We developed a three-pronged approach to assess the viability and delivery capability of loaded NSC-mCherry cells in vivo which consisted of FACS, fluorescence microscopy, and laser capture microdissection analysis. At each time point after injection (4, 8, 12 days post-injection), four mice from each group were killed and brains were extracted to assess the migration and viability of NSC-mCherry cells by FACS and fluorescence/immunohistochemical analyses. To characterize the viability/migration of NSC-mCherry cells, mice brains were extracted and assessed using flow cytometry (see scheme in Figure 7a) and fluorescent microscope analysis (see methods above). The presence of U87MG-GFP and NSC-mCherry cells in each anatomical location was observed using AlexaFluor-488 (GFP) and PEAlexa-610 (mCherry) band pass filters on a Becton Dickinson LSRII flow cytometer and subsequent data analysis was conducted using FlowJo. For cytometer assay of migration, mouse brains were extracted and placed in ice-cold PBS solution. After careful dissection (see Figure 7a), each sectioned brain tissue was minced in 70 μm cell strainers immersed in 7 ml serum-free MEM, washed 2 × with PBS solution and subsequently analyzed on a flow cytometer. For fluorescent microscope analysis, extracted brains were glue-mounted on agar blocks, placed in an ice-cold reservoir of artificial cerebrospinal fluid solution supplemented with pressurized oxygen gas. Mounted brain tissues immersed in ice-cold artificial cerebrospinal fluid solution then underwent serial 500 μm axial sections using a Leica VT1000 S vibratome (http://www.leica-microsystems.com/) until a cut depth of 3 mm was reached. Sections of tissue were then observed under fluorescent microscope for the migration/viability of NSC-mCherry cells in designated six-well tissue culture plastic dishes using a fluorescent stereomicroscope (above).
To study the effect of CRAd-loaded NSC delivery on tumor growth, we established a U87 flank tumor model. Fifteen athymic (nude) mice received subcutaneous injections of 1 × 10⁶ U87 cells (in 100 μl PBS) into the right hind leg (flank). After the tumor was visible (1 week after tumor implantation), mice were randomly divided into three groups (five mice/group) and each mouse/group received intratumoral injections as follows: mice from the control group (MOCK) received 100 μl injections of saline solution; another group received 1 × 10⁷ vp of CRAd-S-pk7 (in 100 μl PBS); the last group received injections of 1 × 10⁶ NSCs loaded with 1000 vp/cell of CRAd-S-pk7 (in 100 μl PBS). Tumors were measured with calipers in three mutually perpendicular diameters (x, y and z) and the volume (V) was calculated as V = (x × y × z). The data represent the mean tumor volume±the standard deviation from each experimental group recorded 10 days after experimental treatment.
Laser capture microdissection and qPCR analysis of NSC vector delivery
After fluorescent microscope observations were recorded, the same brains were fixed in 10% formalin fixative solution for 24 h, after which, the tissues were embedded in paraffin blocks. The paraffin-embedded tissue then underwent serial 6 μm axial sections and was stained with H&E formulates on glass slides or laser capture slides (Leica; http://www.microdissect.de). Using H&E-stained tissue on glass slides, an injection site was identified. After the injection site had been identified, concentric circles of increasing diameter were drawn at increasing distances from the loaded NSC/Ad injection site and laser dissections were made using a Hitachi HV-C2OA camera (http://www.hitachi.com/) attached to a 4 × Leica AS LMD microscope (http://www.leica-microsystems.com/). The imaging software used for performing the indicated laser cuts was Laser Microdissection System Software v. 4.4.0.0 (http://www.leica-microsystems.com/). Representative H&E-stained murine brain tissue pictures for manuscript presentation (Figure 7d) were captured using an AxioCam Color MR digital camera (http://www.zeiss.com/) attached to an Olympus BX41 microscope ( × 1.25 objective lense) (http://www.olympus-global.com/en/global/) using AxioVision software v. 3.0. The representative circles drawn in Figure 7d show circles drawn from the burn marks of the corresponding laser cut tissue slides. Individual tissue sections were collected in designated tubes, after which total DNA was extracted using DNeasy blood and tissue kit (Qiagen) according to the manufacturer's protocol. Isolated DNA samples were then used to conduct quantitative real-time PCR with primers specifically recognizing the viral E1A region. The distribution of the viral E1A gene is plotted (y-axis) as a function of distance (x-axis) recorded in micrometers from the loaded NSC/Ad injection site. Trend lines and R2 values were calculated using Microsoft Office Excel 2003.
Statistical analysis
The statistical analysis was performed using a standard independent two-sample t-test. A P-value <0.05 was considered statistically significant.
Acknowledgements
This work was supported by the National Cancer Institute (R01-CA122930), the National Institute of Neurological Disorders and Stroke (K08-NS046430), The Alliance for Cancer Gene Therapy Young Investigator Award and the American Cancer Society (RSG-07-276-01-MGO). We are grateful for the assistance of Dr Dingcai Cao, a biostatistician at the University of Chicago, in preparing this article. We also acknowledge Dr Vytas Bindokas and Shirley Bond (University of Chicago Integrated Microscopy Research Facility) for their help in obtaining the fluorescent microscope images presented in this article.
Footnotes
Conflict of interest
The authors state no conflict of interest.
References
- 1.Tyler MA, Sonabend AM, Ulasov IV, Lesniak MS. Vector therapies for malignant glioma: shifting the clinical paradigm. Expert Opin Drug Deliv. 2008;5:445–458. doi: 10.1517/17425247.5.4.445. [DOI] [PubMed] [Google Scholar]
- 2.Borovjagin AV, Krendelchtchikov A, Ramesh N, Yu DC, Douglas JT, Curiel DT. Complex mosaicism is a novel approach to infectivity enhancement of adenovirus type 5-based vectors. Cancer Gene Ther. 2005;12:475–486. doi: 10.1038/sj.cgt.7700806. [DOI] [PubMed] [Google Scholar]
- 3.Brouwer E, Havenga MJ, Ophorst O, de Leeuw B, Gijsbers L, Gillissen G, et al. Human adenovirus type 35 vector for gene therapy of brain cancer: improved transduction and bypass of pre-existing anti-vector immunity in cancer patients. Cancer Gene Ther. 2007;14:211–219. doi: 10.1038/sj.cgt.7701010. [DOI] [PubMed] [Google Scholar]
- 4.Miura Y, Yoshida K, Nishimoto T, Hatanaka K, Ohnami S, Asaka M, et al. Direct selection of targeted adenovirus vectors by random peptide display on the fiber knob. Gene Therapy. 2007;14:1448–1460. doi: 10.1038/sj.gt.3303007. [DOI] [PubMed] [Google Scholar]
- 5.Paul CP, Everts M, Dent P, Fisher PB, Ulasov IV, Lesniak MS, et al. Characterization of infectivity of Knob-modified adenoviral vectors in glioma. Cancer Biol Ther. 2008;7:786–793. doi: 10.4161/cbt.7.5.5421. [DOI] [PubMed] [Google Scholar]
- 6.Tyler MA, Ulasov IV, Borovjagin A, Sonabend AM, Khramtsov A, Han Y, et al. Enhanced transduction of malignant glioma with a double targeted Ad5/3-RGD fiber-modified adenovirus. Mol Cancer Ther. 2006;5:2408–2416. doi: 10.1158/1535-7163.MCT-06-0187. [DOI] [PubMed] [Google Scholar]
- 7.Ulasov IV, Tyler MA, Han Y, Glasgow JN, Lesniak MS. Novel recombinant adenoviral vector that targets the interleukin-13 receptor alpha2 chain permits effective gene transfer to malignant glioma. Hum Gene Ther. 2007;18:118–129. doi: 10.1089/hum.2006.146. [DOI] [PubMed] [Google Scholar]
- 8.Ulasov IV, Tyler MA, Zheng S, Han Y, Lesniak MS. CD46 represents a target for adenoviral gene therapy of malignant glioma. Hum Gene Ther. 2006;17:556–564. doi: 10.1089/hum.2006.17.556. [DOI] [PubMed] [Google Scholar]
- 9.Ulasov IV, Zhu ZB, Tyler MA, Han Y, Rivera AA, Khramtsov A, et al. Survivin-driven and fiber-modified oncolytic adenovirus exhibits potent antitumor activity in established intracranial glioma. Hum Gene Ther. 2007;18:589–602. doi: 10.1089/hum.2007.002. [DOI] [PubMed] [Google Scholar]
- 10.Aboody KS, Najbauer J, Danks MK. Stem and progenitor cell-mediated tumor selective gene therapy. Gene Therapy. 2008;15:739–752. doi: 10.1038/gt.2008.41. [DOI] [PubMed] [Google Scholar]
- 11.Sonabend AM, Ulasov IV, Tyler MA, Rivera AA, Mathis JM, Lesniak MS. Mesenchymal stem cells effectively deliver an oncolytic adenovirus to intracranial glioma. Stem Cells. 2008;26:831–841. doi: 10.1634/stemcells.2007-0758. [DOI] [PubMed] [Google Scholar]
- 12.Bergelson JM, Cunningham JA, Droguett G, Kurt-Jones EA, Krithivas A, Hong JS, et al. Isolation of a common receptor for Coxsackie B viruses and adenoviruses 2 and 5. Science. 1997;275:1320–1323. doi: 10.1126/science.275.5304.1320. [DOI] [PubMed] [Google Scholar]
- 13.Gaggar A, Shayakhmetov DM, Lieber A. CD46 is a cellular receptor for group B adenoviruses. Nat Med. 2003;9:1408–1412. doi: 10.1038/nm952. [DOI] [PubMed] [Google Scholar]
- 14.Wickham TJ, Tzeng E, Shears LL, II, Roelvink PW, Li Y, Lee GM, et al. Increased in vitro and in vivo gene transfer by adenovirus vectors containing chimeric fiber proteins. J Virol. 1997;71:8221–8229. doi: 10.1128/jvi.71.11.8221-8229.1997. [DOI] [PMC free article] [PubMed] [Google Scholar]
- 15.Ulasov IV, Rivera AA, Sonabend AM, Rivera LB, Wang M, Zhu ZB, et al. Comparative evaluation of survivin, midkine and CXCR4 promoters for transcriptional targeting of glioma gene therapy. Cancer Biol Ther. 2007;6:679–685. doi: 10.4161/cbt.6.5.3957. [DOI] [PubMed] [Google Scholar]
- 16.Lesniak MS. Targeted therapy for malignant glioma: neural stem cells. Expert Rev Neurother. 2006;6:1–3. doi: 10.1586/14737175.6.1.1. [DOI] [PubMed] [Google Scholar]
- 17.Aboody KS, Brown A, Rainov NG, Bower KA, Liu S, Yang W, et al. Neural stem cells display extensive tropism for pathology in adult brain: evidence from intracranial gliomas. Proc Natl Acad Sci USA. 2000;97:12846–12851. doi: 10.1073/pnas.97.23.12846. [DOI] [PMC free article] [PubMed] [Google Scholar]
- 18.Brown AB, Yang W, Schmidt NO, Carroll R, Leishear KK, Rainov NG, et al. Intravascular delivery of neural stem cell lines to target intracranial and extracranial tumors of neural and non-neural origin. Hum Gene Ther. 2003;14:1777–1785. doi: 10.1089/104303403322611782. [DOI] [PubMed] [Google Scholar]
- 19.Kim SK, Kim SU, Park IH, Bang JH, Aboody KS, Wang KC, et al. Human neural stem cells target experimental intracranial medulloblastoma and deliver a therapeutic gene leading to tumor regression. Clin Cancer Res. 2006;12:5550–5556. doi: 10.1158/1078-0432.CCR-05-2508. [DOI] [PubMed] [Google Scholar]
- 20.Ourednik V, Ourednik J, Park KI, Teng YD, Aboody KA, Auguste KI, et al. Neural stem cells are uniquely suited for cell replacement and gene therapy in the CNS. Novartis Found Symp. 2000;231:242–262. doi: 10.1002/0470870834.ch15. discussion 262–269, 302–306. [DOI] [PubMed] [Google Scholar]
- 21.Ziu M, Schmidt NO, Cargioli TG, Aboody KS, Black PM, Carroll RS. Glioma-produced extracellular matrix influences brain tumor tropism of human neural stem cells. J Neurooncol. 2006;79:125–133. doi: 10.1007/s11060-006-9121-5. [DOI] [PubMed] [Google Scholar]
- 22.Modo M, Rezaie P, Heuschling P, Patel S, Male DK, Hodges H. Transplantation of neural stem cells in a rat model of stroke: assessment of short-term graft survival and acute host immunological response. Brain Res. 2002;958:70–82. doi: 10.1016/s0006-8993(02)03463-7. [DOI] [PubMed] [Google Scholar]
- 23.Benedetti S, Pirola B, Pollo B, Magrassi L, Bruzzone MG, Rigamonti D, et al. Gene therapy of experimental brain tumors using neural progenitor cells. Nat Med. 2000;6:447–450. doi: 10.1038/74710. [DOI] [PubMed] [Google Scholar]
- 24.Danks MK, Yoon KJ, Bush RA, Remack JS, Wierdl M, Tsurkan L, et al. Tumor-targeted enzyme/prodrug therapy mediates long-term disease-free survival of mice bearing disseminated neuroblastoma. Cancer Res. 2007;67:22–25. doi: 10.1158/0008-5472.CAN-06-3607. [DOI] [PubMed] [Google Scholar]
- 25.Dickson PV, Hamner JB, Burger RA, Garcia E, Ouma AA, Kim SU, et al. Intravascular administration of tumor tropic neural progenitor cells permits targeted delivery of interferon-beta and restricts tumor growth in a murine model of disseminated neuroblastoma. J Pediatr Surg. 2007;42:48–53. doi: 10.1016/j.jpedsurg.2006.09.050. [DOI] [PubMed] [Google Scholar]
- 26.Ehtesham M, Kabos P, Gutierrez MA, Chung NH, Griffith TS, Black KL, et al. Induction of glioblastoma apoptosis using neural stem cell-mediated delivery of tumor necrosis factor-related apoptosis-inducing ligand. Cancer Res. 2002;62:7170–7174. [PubMed] [Google Scholar]
- 27.Ehtesham M, Kabos P, Kabosova A, Neuman T, Black KL, Yu JS. The use of interleukin 12-secreting neural stem cells for the treatment of intracranial glioma. Cancer Res. 2002;62:5657–5663. [PubMed] [Google Scholar]
- 28.Ehtesham M, Stevenson CB, Thompson RC. Stem cell therapies for malignant glioma. Neurosurg Focus. 2005;19:E5. doi: 10.3171/foc.2005.19.3.6. [DOI] [PubMed] [Google Scholar]
- 29.Ehtesham M, Yuan X, Kabos P, Chung NH, Liu G, Akasaki Y, et al. Glioma tropic neural stem cells consist of astrocytic precursors and their migratory capacity is mediated by CXCR4. Neoplasia. 2004;6:287–293. doi: 10.1593/neo.3427. [DOI] [PMC free article] [PubMed] [Google Scholar]
- 30.Kabos P, Ehtesham M, Black KL, Yu JS. Neural stem cells as delivery vehicles. Expert Opin Biol Ther. 2003;3:759–770. doi: 10.1517/14712598.3.5.759. [DOI] [PubMed] [Google Scholar]
- 31.Kabos P, Ehtesham M, Kabosova A, Black KL, Yu JS. Generation of neural progenitor cells from whole adult bone marrow. Exp Neurol. 2002;178:288–293. doi: 10.1006/exnr.2002.8039. [DOI] [PubMed] [Google Scholar]
- 32.Herrlinger U, Woiciechowski C, Sena-Esteves M, Aboody KS, Jacobs AH, Rainov NG, et al. Neural precursor cells for delivery of replication-conditional HSV-1 vectors to intracerebral gliomas. Mol Ther. 2000;1:347–357. doi: 10.1006/mthe.2000.0046. [DOI] [PubMed] [Google Scholar]
- 33.Shah K, Hingtgen S, Kasmieh R, Figueiredo JL, Garcia-Garcia E, Martinez-Serrano A, et al. Bimodal viral vectors and in vivo imaging reveal the fate of human neural stem cells in experimental glioma model. J Neurosci. 2008;28:4406–4413. doi: 10.1523/JNEUROSCI.0296-08.2008. [DOI] [PMC free article] [PubMed] [Google Scholar]
- 34.Chu K, Kim M, Park KI, Jeong SW, Park HK, Jung KH, et al. Human neural stem cells improve sensorimotor deficits in the adult rat brain with experimental focal ischemia. Brain Res. 2004;1016:145–153. doi: 10.1016/j.brainres.2004.04.038. [DOI] [PubMed] [Google Scholar]
- 35.Jeong SW, Chu K, Jung KH, Kim SU, Kim M, Roh JK. Human neural stem cell transplantation promotes functional recovery in rats with experimental intracerebral hemorrhage. Stroke. 2003;34:2258–2263. doi: 10.1161/01.STR.0000083698.20199.1F. [DOI] [PubMed] [Google Scholar]
- 36.Kim SU. Human neural stem cells genetically modified for brain repair in neurological disorders. Neuropathology. 2004;24:159–171. doi: 10.1111/j.1440-1789.2004.00552.x. [DOI] [PubMed] [Google Scholar]
- 37.Meng XL, Shen JS, Ohashi T, Maeda H, Kim SU, Eto Y. Brain transplantation of genetically engineered human neural stem cells globally corrects brain lesions in the mucopolysaccharidosis type VII mouse. J Neurosci Res. 2003;74:266–277. doi: 10.1002/jnr.10764. [DOI] [PubMed] [Google Scholar]
- 38.Coskun V, Wu H, Blanchi B, Tsao S, Kim K, Zhao J, et al. CD133+ neural stem cells in the ependyma of mammalian postnatal forebrain. Proc Natl Acad Sci USA. 2008;105:1026–1031. doi: 10.1073/pnas.0710000105. [DOI] [PMC free article] [PubMed] [Google Scholar]
- 39.Duan X, Kang E, Liu CY, Ming GL, Song H. Development of neural stem cell in the adult brain. Curr Opin Neurobiol. 2008;18:108–115. doi: 10.1016/j.conb.2008.04.001. [DOI] [PMC free article] [PubMed] [Google Scholar]
- 40.Sims TL, Jr, Hamner JB, Bush RA, Williams RF, Zhou J, Kim SU, et al. Neural progenitor cell-mediated delivery of interferon beta improves neuroblastoma response to cyclophosphamide. Ann Surg Oncol. 2008;15:3259–3267. doi: 10.1245/s10434-008-0103-z. [DOI] [PMC free article] [PubMed] [Google Scholar]
- 41.Staflin K, Honeth G, Kalliomaki S, Kjellman C, Edvardsen K, Lindvall M. Neural progenitor cell lines inhibit rat tumor growth. Cancer Res. 2004;64:5347–5354. doi: 10.1158/0008-5472.CAN-03-1246. [DOI] [PubMed] [Google Scholar]
- 42.Shaner NC, Campbell RE, Steinbach PA, Giepmans BN, Palmer AE, Tsien RY. Improved monomeric red, orange and yellow fluorescent proteins derived from Discosoma sp. red fluorescent protein. Nat Biotechnol. 2004;22:1567–1572. doi: 10.1038/nbt1037. [DOI] [PubMed] [Google Scholar]
- 43.Deregowski V, Canalis E. Gene delivery by retroviruses. Methods Mol Biol. 2008;455:157–162. doi: 10.1007/978-1-59745-104-8_12. [DOI] [PubMed] [Google Scholar]


