Abstract
We generated three populations of macrophages (Mφ) in vitro and characterized each. Classically activated Mφ (Ca-Mφ) were primed with IFN-γ and stimulated with LPS. Type II-activated Mφ (Mφ-II) were similarly primed but stimulated with LPS plus immune complexes. Alternatively activated Mφ (AA-Mφ) were primed overnight with IL-4. Here, we present a side-by-side comparison of the three cell types. We focus primarily on differences between Mφ-II and AA-Mφ, as both have been classified as M2 Mφ, distinct from Ca-Mφ. We show that Mφ-II more closely resemble Ca-Mφ than they are to AA-Mφ. Mφ-II and Ca-Mφ, but not AA-Mφ, produce high levels of NO and have low arginase activity. AA-Mφ express FIZZ1, whereas neither Mφ-II nor Ca-Mφ do. Mφ-II and Ca-Mφ express relatively high levels of CD86, whereas AA-Mφ are virtually devoid of this costimulatory molecule. Ca-Mφ and Mφ-II are efficient APC, whereas AA-Mφ fail to stimulate efficient T cell proliferation. The differences between Ca-Mφ and Mφ-II are more subtle. Ca-Mφ produce IL-12 and give rise to Th1 cells, whereas Mφ-II produce high levels of IL-10 and thus, give rise to Th2 cells secreting IL-4 and IL-10. Mφ-II express two markers that may be used to identify them in tissue. These are sphingosine kinase-1 and LIGHT (TNF superfamily 14). Thus, Ca-Mφ, M-II, and AA-Mφ represent three populations of cells with different biological functions. J. Leukoc. Biol. 80: 1298–1307; 2006.
Keywords: IL-10, IL-12, sphingosine kinase, LIGHT
INTRODUCTION
Resident tissue macrophages (Mφ) can rapidly respond to external stimuli with dramatic alterations in gene expression [1]. This rapid response to stimuli represents the process of Mφ activation [2]. Mφ respond to a variety of stimuli, including microbial ligands for TLRs [3], endogenous “danger” signals [4], and cytokines. There is an increasing body of evidence to support the idea that the nature of the stimulus, or the combination of stimuli, can exert a profound effect on the type of Mφ activation response that occurs. The corollary to this is that different populations of activated Mφ can arise in response to different stimuli. The classically activated Mφ (Ca-Mφ) is generated in response to the cytokine IFN-γ in combination with TNF or stimuli that induce TNF. These cells are prototypical immune effector cells, which kill intracellular pathogens via the production of oxygen and nitrogen radicals [5]. These cells also secrete a battery of inflammatory cytokines, which help to orchestrate and amplify Th1 immune responses. The Ca-Mφ is an important component of host defense, but it can also be a potent mediator of inflammation.
A second population of activated Mφ was identified more than a decade ago [6] and termed alternatively activated Mφ (AA-Mφ). These cells arise in response to the Th2 cytokines IL-4 and/or IL-13. These cells are functionally and biochemically distinct from Ca-Mφ. They fail to produce NO, but they up-regulate mannose receptor expression [6]. They express several unique “markers”, which are not found on Ca-Mφ [7]. These cells are associated with parasitic diseases [8] and may contribute to the production of the extra-cellular matrix (ECM) [9].
A third population of activated Mφ was generated by activating Mφ in the presence of immune complexes (IC). These activation conditions resulted in an unexpected alteration in cytokine production by these cells. The cross-linking of FcγRs during activation resulted in an abrogation of IL-12 production and strong induction of IL-10 [10, 11]. The IL-10 secreted by these cells made them potent, anti-inflammatory cells [10]. When these Mφ were used to present antigen to naïve T cells, they stimulated the production of Th2-like T cells, which produced high levels of IL-4. Consequently, these Mφ were termed Type II-activated Mφ (Mφ-II) [12]. These cells may play a role in the exacerbation of visceral leishmaniasis, where the presence of IgG-coated parasites can induce the production of IL-10 from Mφ, allowing for disease progression [13]. Several other Mφ have also been reported to preferentially produce IL-10 in response to stimulation. These include Mφ isolated from tumors [14] or Mφ exposed to glucocorticoids [15].
There have been suggestions that the ratio of IL-12 to IL-10 can be used as a simple way to classify activated Mφ into two categories, M1 (classical) or M2 (alternative or nonclassical) [16, 17]. This simplified classification is based on the well-established tenet that Ca-Mφ are an important source of IL-12 [18]. Mφ in the M2 category produce reduced amounts of IL-12 but higher levels of IL-10. The implication from this classification is that the cells in the latter category (M2) would share functional and physiological properties. We undertook the present studies to determine how similar two of the M2 Mφ, AA-Mφ and Mφ-II, were. To our surprise, we found that these cells are quite distinct functionally and biochemically. In fact, Mφ-II more closely resembled Ca-Mφ than AA-Mφ. We conclude that each of the three populations of Mφ studied here has distinct characteristics by which it can be identified. Thus, we suggest that the simple designation of all non-Ca-Mφ as M2 may be a misleading oversimplification.
MATERIALS AND METHODS
Mice
Six- to 8-week-old BALB/c mice were purchased from Taconic Farms (Germantown, NY). Mice were used at 6 –10 weeks of age as a source of bone marrow-derived Mφ (BMMφ). Breeding pairs of mice transgenic for OVA323–339/Ad-specific, DO11.10 [19] TCR-αβ were purchased from The Jackson Laboratory (Bar Harbor, ME). All mice were maintained in high-efficiency particulate air-filtered Thoren units (Thoren Caging Systems, Hazleton, PA) at the University of Maryland (College Park, MD). All procedures were reviewed and approved by the University of Maryland Institutional Animal Care and Use Committee.
Mφ activation
BMMφ were prepared as described previously [20]. Briefly, BM was flushed from the femurs and tibias of mice, and cells were plated in petri dishes in DMEM/F12 supplemented with 10% FBS, penicillin/streptomycin-glutamine, and 20% conditioned medium from the supernatants of M-CSF-secreting L929 (LC14) fibroblasts. Cells were fed on Day 2, and complete medium was replaced on Day 6. Cells were used at 7–10 days for experiments.
Ca-Mφ and Mφ-II were prepared by priming BMMφ overnight with 100 U/ml recombinant IFN-γ (R&D Systems, Minneapolis, MN). Ca-Mφ were washed and stimulated with l0 ng/ml Ultra-Pure LPS (Escherichia coli, K12, Invivogen, San Diego, CA). Mφ-II received LPS along with IC consisting of IgG-OVA. IC were made by mixing a tenfold molar excess of rabbit anti-OVA IgG (Cappel, Durham, NC) to OVA (Worthington, Lake-wood, NJ) for 30 min at room temperature, as described [11]. AA-Mφ were prepared by stimulating BMMφ with 10 U/ml recombinant IL-4 (R&D Systems) as described previously [8].
RT-PCR and real-time PCR
PCR was performed after cDNA synthesis using Platinum PCR SuperMix (Invitrogen, Carlsbad, CA) and primer pairs specific for inducible NO synthase (iNOS), arginase-1 (Arg-1), sphingosine kinase-1 (SPHK1), FIZZ1, IL-10, IL12p40, and GAPDH. Real-time PCR was performed on GAPDH, TNF superfamily 14 LIGHT (homologous to lymphotoxins, shows inducible expression and competes with herpes simplex virus glycoprotein D for herpes virus entry mediator (HVEM)/TNF-related 2), and SPHK1. These primer pairs are presented in Table 1.
TABLE 1.
Primers Used in PCR Analysis
| Gene | Accession number | Primers |
|---|---|---|
| iNOS | NM_010927 | 5′-CCCTTCCGAAGTTTCTGGCAGCAGC-3′ |
| 5′-GGCTGTCAGAGCCTCGTGGCTTTGG-3′ | ||
| Arg-1 | NM_007482 | 5′-CAGAAGAATGGAAGAGTCAG-3′ |
| 5′-CAGATATGCAGGGAGTCACC-3′ | ||
| SPHK1 | NM_011451 | 5′-ACAGCAGTGTGCAGTTGATGA-3′ |
| 5′-GGCAGTCATGTCCGGTGATG-3′ | ||
| FIZZ1 | NM_020509 | 5′-GGTCCCAGTGCATATGGATGAGACCATAGA-3′ |
| 5′-CACCTCTTCACTGCAGGGACAGTTGGCAGA-3′ | ||
| IL-10 | NM_010548 | 5′-CCAGTTTTACCTGGTAGAAGTGATG-3′ |
| 5′-TGTCTAGGTCCTGGAGTCCAGCAGACTCAA-3′ | ||
| IL-12p40 | NM_008352 | 5′-ATGGCCATGTGGGAGCTGGAGAAAG-3′ |
| 5′-GTGGAGCAGCAGATGTGAGTGGCT-3′ | ||
| GAPDH | NM_001001303 | 5′-GCACTTGGCAAAATGGAGAT-3′ |
| 5′-CCAGCATCACCCCATTAGAT-3′ | ||
| LIGHT/TNFSF14 | NM_019418 | 5′-CTGCATCAACGTCTTGGAGA-3′ |
| 5′-GATACGTCAAGCCCCTCAAG-3′ |
Real-time PCR was conducted with the ABI Prism 7700 sequence detection system using iQ SYBR Green Supermix (Bio-Rad Laboratories, Hurcules, CA) following the manufacturer’s instructions. For data analysis, the comparative threshold cycle (CT) value for GAPDH was used to normalize loading variations in the real-time PCRs. A ΔΔ CT value was then obtained by subtracting control Δ CT values from the corresponding experimental ΔCT. The ΔΔCT values were converted to fold difference compared with the control by raising two to the ΔΔ CT power.
Microarray analysis
RNA was prepared from 5 × 10⁶ Ca-Mφ or Mφ-II 2 h after activation with LPS or LPS + IC, respectively. High-quality RNA was first purified using the TRIzol reagent (Invitrogen), according to the manufacturer’s instructions. RNA was then DNase (Roche Diagnostics, Indianapolis, IN)-treated and purified using the RNeasy Mini kit (Qiagen, Valencia, CA), following the RNA cleanup protocol. RNA quality assessment and microarray analysis were performed at the University of Maryland Biotechnology Institute’s Microarray Core Facility. Microarray analysis was performed using the Affymetrix GeneChip Mouse Genome 430 2.0 (Santa Clara, CA), according to the manufacturer’s instructions. This array allowed for the assessment for changes in expression of ~39,000 transcripts. Robust changes in expression were determined according to the GeneChip expression analysis data analysis manual (Affymetrix), selecting for statistically significant changes in expression from Ca-Mφ (control) to Mφ-II (experimental). Briefly, robust changes from Ca-Mφ to Mφ-II had a signal call of “P” or present and had statistically significant increases or decreases based on the detection and change algorithm, respectively, as determined by the Affymetrix Microarray Suite software. Robust changes also had a signal log ratio greater than 1 for increases. Two sets of biological replicates were compared for consistent, robust changes. Details of these arrays as well as raw data have been deposited in the National Center for Biotechnology Information (NCBI; Bethesda, MD) Gene Expression Omnibus (GEO; http://www.ncbi.nlm.nih.gov/geo) and are accessible through GEO Series Accession Number GSE4811.
Immunoprecipitation and Western blot analyses
LIGHT/TNFSF14 was immunoprecipitated using 5 μg α-mouse LIGHT mAb (R&D Systems, Clone 261639) per ml cell culture supernatant. Samples were subject to SDS-PAGE on 15% resolving gels and transferred to polyvinylidene difluoride membrane. Membranes were blotted with α-mouse LIGHT mAb and HRP-conjugated goat α-rat IgG secondary antibody (Santa Cruz Biotechnology, CA). Membranes were developed using Lumi-LightPLUS Western blotting substrate (Roche Diagnostics) according to the manufacturer’s instructions.
NO production/arginase activity
NO production was estimated from the accumulation of NO2− in the medium after 24 h of Mφ activation using the Greiss reagent, as described previously [21]. Briefly, equal volumes of culture supernatant and Greiss reagent (100 μl) were mixed for 10 min at room temperature. Absorbance at 540λ was measured with a Labsystems Multiscan Ascent assay plate reader. A solution of NO2 was used to construct a standard curve.
Arginase activity was measured in cell lysates as described previously [22]. Briefly, 5 × 10⁵ cells were washed and lysed with 100 μl 0.1% Triton X-100, 16 h after activation. Lysates were combined with 25 mM Tris-HC1 and 1 mM MnCl2, and enzyme was activated by heating for 10 mm at 55°C. The hydrolysis of arginine to ornithine and urea was conducted by incubating the lysates with 100 μl 0.5 M L-arginine (pH 9.7) at 37°C for 60 min. The reaction was stopped with 800 μl H2SO4 (96%)/H3PO4 (85%)/H2O (1/3/7, v/v/v). The urea concentration was measured at 550 nm after addition of 40 μl α-isoni-trosopropiophenone (9% solution in ethanol), followed by heating at 100°C for 30 min.
T cell stimulation assays
CD3+ T cells were prepared from the spleens of DO11.10 mice by negative selection using the SpinSep mouse T cell enrichment kit (StemCell Technologies Inc., Vancouver, BC.) according to the manufacturer’s instructions. For primary stimulation assays, 2 × 10⁵ Mφ were plated per well in 48-well plates and activated as described above. Two hours following stimulation of Mφ, 5 ×10⁵ T cells were added to each well in a total volume of 0.550 ml RPMI 1640 (Cellgro, Herndon, VA) supplemented with 10% FCS, HEPES, glutamine, Pen/Strep, and 50 μM 2- ME. For proliferation assays, cells were CFSE (Invitrogen/Molecular Probes, Eugene, OR)-stained. Briefly, T cells were washed with PBS and resuspended at l × 107 cells/ml in 5 μM CFSE in PBS. Cells were stained while rocking for 7 min, and then labeling was quenched by adding an equal volume of FBS. Cells were washed an additional two times in complete media. In secondary stimulation assays, 4 days following the primary stimulation, fresh RPMI was added with 10 U/ml IL-2 (R&D Systems) to maintain cell viability. Seven days following the primary stimulation, cells were removed from culture, washed, counted, and added to immobilized anti-CD3 (eBioscience, San Diego, CA), which was prepared by adding 5 μg/ml anti-CD3 to tissue-culture dishes in PBS overnight. Cytokines were measured 24 h later by ELISA or after 6 h by intracellular staining.
Cytokine measurement by ELISA
Cytokines were measured by ELISA using the following antibody pairs from BD PharMingen (San Diego, CA): IL-12p40, C15.6 and Cl7.8; IL-10, JES5-2A5 and JES5-16E3; IFN-γ, R4-6A2 and XMG1.2; IL-4, 11B11 and BVD6-24G2, according to the manufacturer’s instructions.
Flow cytometry and intracellular staining
Mφ were stained with FITC-conjugated α-I-Ad (AMS-32.1) or PE-conjugated α-CD86 (GL1; BD PharMingen). T cells were stained with FITC-conjugated antibodies against CD25 (PC61), CD69 (H1.2F3), or CD62 ligand (CD62L; MEL-14) and a PE-conjugated antibody against Thyl.2 (53-2.1; eBioscience). CFSE-stained T cells were also stained against Thy1.2 for gating. Intracellular staining was performed on secondarily stimulated T cells using the PharMingen Cytofix/Cytoperm kit with GolgiStop, according to the manufacturer’s instructions with some modifications. Briefly, cells were incubated in the presence of GolgiStop for 6 h after reactivation. Cells were harvested, washed, and resuspended in Cytofix/Cytoperm solution for 20′ at 4°C and then washed in Perm/Wash solution. Cells were stained with a PE-conjugated antibody against IL-4 (11B11) and a FITC-conjugated antibody against IL-10 (JES5-16E3, BD PharMingen). Cells were analyzed on a Becton Dickinson FACS flow cytometer (San Jose, CA). Quadrants were set to an appropriate isotype control antibody for analysis.
RESULTS
Activated Mφ differ in cytokine production
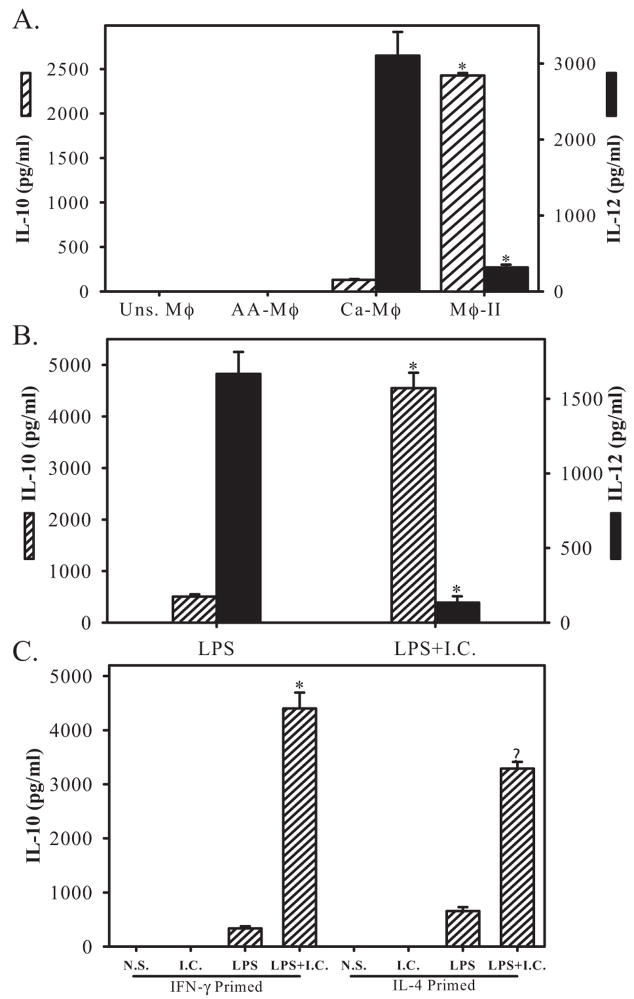
We generated three distinct populations of activated Mφ in vitro from murine BMMφ and performed a series of parallel comparisons between them. As a first step, we measured cytokine production from each of these cells. Ca-Mφ have long been associated with the secretion of IL-12 [18], whereas Mφ-II were previously shown to produce high amounts of IL-10 [23]. Others have also suggested that the AA-Mφ were also a good source of IL-10 [24]. Cytokine production from these three populations of Mφ was compared. As expected, Ca-Mφ produced relatively high levels of IL-12 but low levels of IL-l0 (Fig. 1A). Coupling Mφ activation with FcγR ligation by the addition of IC resulted in a population of Mφ (Mφ-II), which produced high levels of IL- 10 and low levels of IL-12 (Fig. 1A), as previously reported [10]. Priming of these cells with IFN-γ was not necessary to see this reciprocal alteration in cytokine production caused by the addition of IC (Fig. 1B).
Fig. 1.
Cytokine profiles of activated Mφ. (A) IL-10 (hatched bars, left axis) and IL-12 (solid bars, right axis) were measured by ELISA 16 h after Mφ activation. AA-Mφ were prepared by treating Mφ overnight with IL-4 (10 U/ml). Ca-Mφ and Mφ-II were prepared by treated Mφ with IFN-γ (100 U/ml) overnight and then stimulating with LPS or LPS + IC, respectively. (B) IL-10 (hatched bars) and IL-12 (solid bars) levels in supernatants following a 16-h stimulation of cells with LPS or LPS + IC. These cells were not primed with IFN-γ. (C) IL-10 levels in Mφ primed overnight with IFN-γ or IL-4 and then left unstimulated (Uns.) or stimulated with IC, LPS, or LPS + IC. Figures are representative of at least three independent experiments. N. S., Not stimulated. Error bars indicate ± SD. *, P < 0.001.
IL-4-treated Mφ (AA-Mφ) failed to secrete detectable levels of IL-12 or IL-10 (Fig. 1A). Cytokine production by AA-Mφ was not significantly different from unstimulated Mφ. As previous studies reported that Mφ isolated from infections in which IL-4 predominated were a rich source of IL-10 [25], we primed Mφ with IL-4 overnight and then stimulated them with LPS the next morning and examined cytokine production. The stimulation of IL-4-primed cells with LPS resulted in a modest increase in the production of IL-10 (Fig. 1C). However, the level of this cytokine remained substantially below that of Mφ-II. IL-4-primed cells were also stimulated with LPS + IC. These IL-4-primed cells responded to the addition of IC by secreting high levels of IL-10 (Fig. 1C). Thus, all three populations of activated Mφ display distinct profiles of cytokine production, and yet, these cells exhibit functional plasticity. Thus, the nature, order, and/or duration of stimulation can influence cytokine production, as reported previously [26].
Activated Mφ exhibit different patterns of arginine metabolism
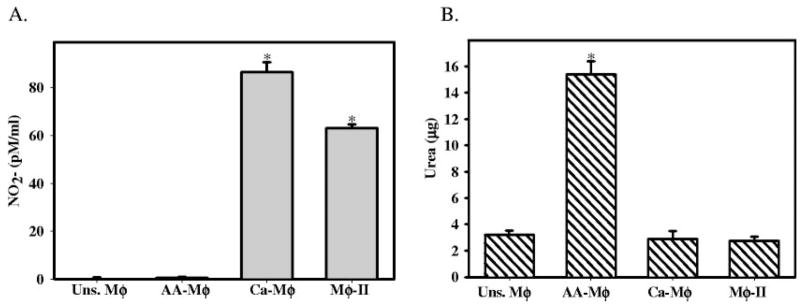
Arginine metabolism has been described previously as one of the defining characteristics of murine AA-Mφ [8]. Therefore, we examined iNOS and arginase production in each of the three Mφ populations. First, we measured the accumulation of NO2− in culture supernatants by the Greiss assay [21]. Ca-Mφ and Mφ-II produced relatively high levels of NO, whereas the AA-Mφ produced virtually no NO (Fig. 2A). We also measured the amount of urea generated by these three populations of Mφ. Ca-Mφ and Mφ-II possessed virtually no arginase activity and therefore, were unable to produce urea when lysates were incubated with L-arginine. The opposite was true of the AA-Mφ, which produced high levels of urea (Fig. 2B). Thus, with regard to arginine metabolism, AA-Mφ were distinct from the other two populations of Mφ. AA-Mφ failed to produce NO but readily catabolized arginine to urea, whereas the converse was true for Ca-Mφ and Mφ-II (Fig. 2).
Fig. 2.
Activated Mφ exhibit different patterns of arginine metabolism. (A) NO2− accumulation after 24 h of Mφ activation measuring iNOS activity. Equal volumes of cell supernatants were mixed with Greiss reagent for 10 min, and the absorbance at 540λ was measured. A solution of NO2− was used to construct a standard curve. (B) Arginase assay measuring the formation of urea after incubation of lysates from activated Mφ with arginine. Arginase enzyme was activated by heating for 10′ at 55°C. The hydrolysis of arginine to ornithine and urea was conducted by incubating the lysates with L-arginine at 37°C for 60 min. The reaction was stopped, and urea was measured at 550 nm after addition of α-isonitrosopropiophenone followed by heating at 100°C for 30 min. Values were compared with a standard curve of urea concentration. Figures are representative of at least three independent experiments. Error bars indicate ± SD. *, P < 0.00001
Biochemical markers to discriminate between populations of Mφ
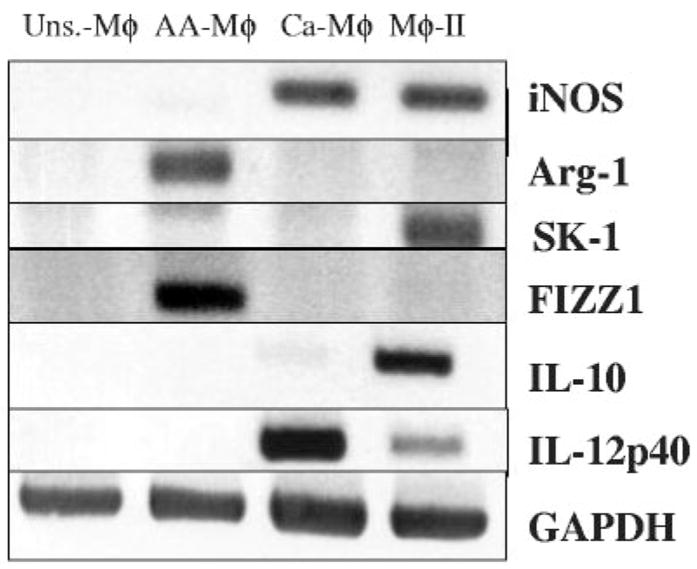
RNA was isolated from the three populations of activated Mφ 4 h after stimulation and analyzed by RT-PCR (Fig. 3). We first examined iNOS and Arg-1 mRNA in each of the three populations. As previously reported and consistent with the protein activity data above, Mφ exposed to the Th2-associated cytokine IL-4 produced mRNA for arginase but failed to produce iNOS mRNA [27]. Conversely, Ca-Mφ and Mφ-II expressed iNOS mRNA but failed to express arginase (Fig. 3). Ca-Mφ produced high levels of IL-12 but little detectable IL-10, whereas Mφ-II expressed high levels of IL-10 and less IL-12. Only the AA-Mφ expressed the marker FIZZ1 (found in inflammatory zone 1) described previously, a secreted protein that has been associated with allergic and pulmonary inflammation [7, 28], confirming that FIZZ1 represents a reliable marker for murine AA-Mφ (Fig. 3).
Fig. 3.
Activated Mφ have different mRNA expression profiles. RT-PCR was performed to examine the expression of iNOS, Arg-1, SPHK1 (SK-1), FIZZ1, IL-10, and IL-12 (p40) mRNA levels in four different Mφ populations. cDNA from unstimulated Mφ and the three activated Mφ populations were reverse-transcribed from total RNA 4 h after stimulation. GAPDH mRNA was used to normalize loading. Figures are representative of at least three independent experiments.
As there have been no reported markers for Mφ-II, we performed an initial microarray analysis using the Affimetrix GeneChip Mouse Genome 430 2.0. The analysis included a comparison between Ca-Mφ and Mφ-II, as these two populations of cells exhibited several biochemical similarities (Fig. 3). Microarray analysis revealed a limited number of changes in gene expression between these two cell types. When a twofold difference in transcript levels was used as the cut-off, only 184 of the 39,000 possible transcripts represented on this chip (<0.5%) were increased consistently in Mφ-II relative to Ca-Mφ. Table 2 lists 29 genes of known biological function, which were increased by threefold or more in Mφ-II and had a signal greater than 2000. These 29 genes are the only ones that fit these criteria. The data discussed in this publication have been deposited in the NCBI GEO (http://www.ncbi.nlm.nih.gov/geo) and are accessible through GEO Series Accession Number GSE4811.
TABLE 2.
Increases in Gene Expression in Mφ-II Relative to Ca-Mφa
| Gene symbol | Average signal | Average fold change |
|---|---|---|
| Bcar3 | 3479.25 | 3.031 |
| Bhlhb2 | 2579.85 | 4.203 |
| Dusp4 | 2713.25 | 3.375 |
| Emp1 | 6476.5 | 4.297 |
| Fabp4 | 5134.4 | 7.222 |
| Fosb | 2357.35 | 3.711 |
| Gadd45g | 2487.2 | 5.78 |
| Gas213 | 6283.1 | 5.291 |
| Hbegf | 6600.95 | 7.956 |
| Hmox1 | 2805.8 | 4.297 |
| Ifnb1 | 3703.8 | 3.186 |
| Il10 | 12817.6 | 3.249 |
| Impact | 2049.6 | 3.516 |
| Klf9 | 2844.65 | 3.639 |
| Mafb | 3254.3 | 4.76 |
| Ndrg1 | 8642.7 | 3.28 |
| Ndr1 | 6851.45 | 3.186 |
| Plau | 5734.55 | 3.155 |
| Plk2 | 3925.6 | 6.981 |
| Rgc32 | 2356.9 | 6.28 |
| Rhov | 4564.9 | 7.423 |
| Ris2 | 3508.2 | 3.14 |
| Samd8 | 2713.4 | 3.155 |
| Sgk | 6724.3 | 3.155 |
| Slc6a8 | 2382.25 | 3.015 |
| Snx30 | 6079.5 | 4.06 |
| Sphk1 | 2449.95 | 3.257 |
| Tnfsf14 | 2281.05 | 8.657 |
| Vps18 | 5875.6 | 4.972 |
Includes genes with known biological function, which exhibited a signal greater than 2000 and an average fold change of three or more.
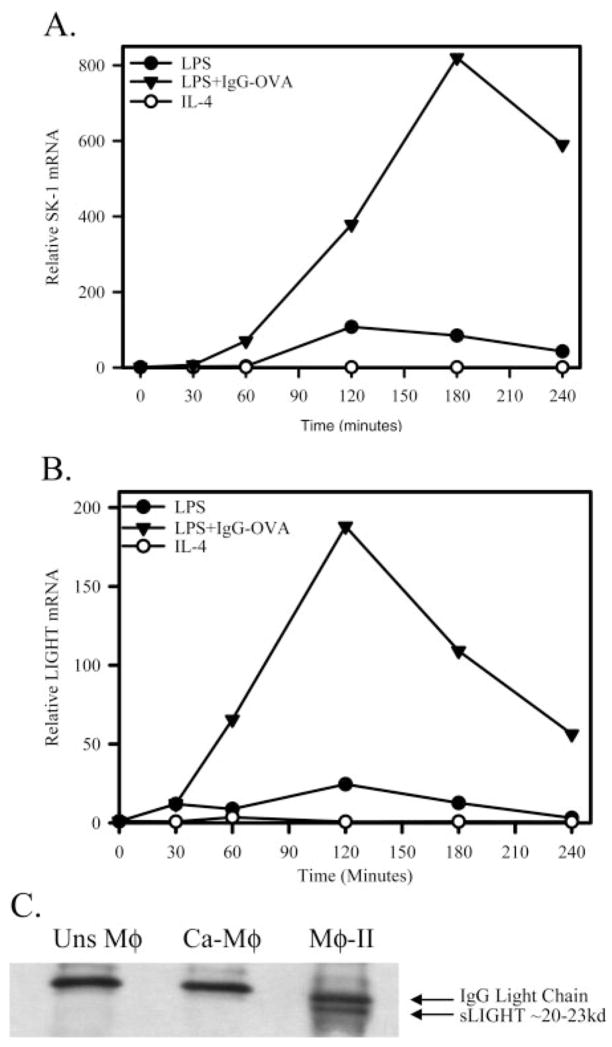
From this analysis, several genes that were up-regulated in Mφ-II were examined. SPHK1 was shown to be up-regulated by more than threefold in Mφ-II, relative to Ca-Mφat 2 h poststimulation. We therefore compared SPHK1 mRNA levels in the three Mφ populations. Only Mφ-II expressed detectable levels of SPHK1 mRNA by conventional PCR 4 h after stimulation (Fig. 3). This observation was extended by quantitative real-time PCR (QRT-PCR; Fig. 4A). This analysis revealed that SPHK1 mRNA was induced robustly in Mφ-II, and mRNA levels increased substantially over time, relative to unstimulated cells (Fig. 4A). There was some induction of SPHK1 mRNA in Ca-Mφ; however, this induction was modest relative to Mφ-II. Thus, high SPHK1 expression may be useful to identify Mφ-II in tissue.
Fig. 4.
Mφ-II up-regulate SPHK1 and TNFSF14/LIGHT. (A) Relative SPHK1 mRNA as measured by real-time PCR after Mφ activation by LPS (●), LPS + IgG-OVA IC (▲), or IL-4 (○). (B) Relative LIGHT mRNA as measured by real-time PCR after Mφ activation by LPS (●), LPS + IgG-OVA IC (▲), or IL-4 (○). Calculation of fold values was detailed in Materials and Methods. (C) Immunoprecipitation of soluble LIGHT (sLIGHT) from 6 h cell supernatants of unstimulated Mφ, Ca-Mφ, and Mφ-II. Western blot analysis for LIGHT using a rat α-LIGHT mAb, showing the soluble form of LIGHT present as a 20- to 23-kD protein. Figures are representative of at least three independent experiments.
Mφ-II express LIGHT, a member of the TNFSF
From the microarray analysis, another marker for Mφ-II emerged. This was murine LIGHT or TNFSF14. It was found to be present at more than 8.5-fold higher levels in the Mφ-II relative to Ca-Mφ. To confirm LIGHT mRNA induction in Mφ-II, QRT-PCR was performed to compare mRNA levels in the three Mφ populations. In the Mφ-II, LIGHT mRNA increased by ~200-fold over unstimulated cells, peaking at 2 h poststimulation (Fig. 4B). Ca-Mφ had a slight induction of LIGHT mRNA, but these levels were always at least tenfold lower than these observed in Mφ-II (Fig. 4B). There was no evidence for LIGHT induction in AA-Mφ, and in fact, the addition of IL-4 marginally decreased LIGHT mRNA levels in AA-Mφ.
It has been reported previously that LIGHT may be secreted or cleaved from the surface of cells in a soluble form [29]. To address this possibility, Mφ were primed with IFN-γ, and then stimulated for 6 h with LPS or LPS + IC. IL-4-treated Mφ were not addressed, as the expression of LIGHT was not induced in this population (Fig. 4B). LIGHT was then immunoprecipitated from the supernatants of stimulated cells with a mAb specific for the extracellular domain of LIGHT. A 20- to 25-kD band, which corresponds to the molecular mass of sLIGHT, was detected only in the supernatants of Mφ-II (Fig. 4C). This suggests that Mφ-II are the primary Mφ producers of LIGHT and that this molecule is rapidly cleaved from the surface of these cells or secreted as sLIGHT by Mφ-II.
Antigen presentation by activated Mφ
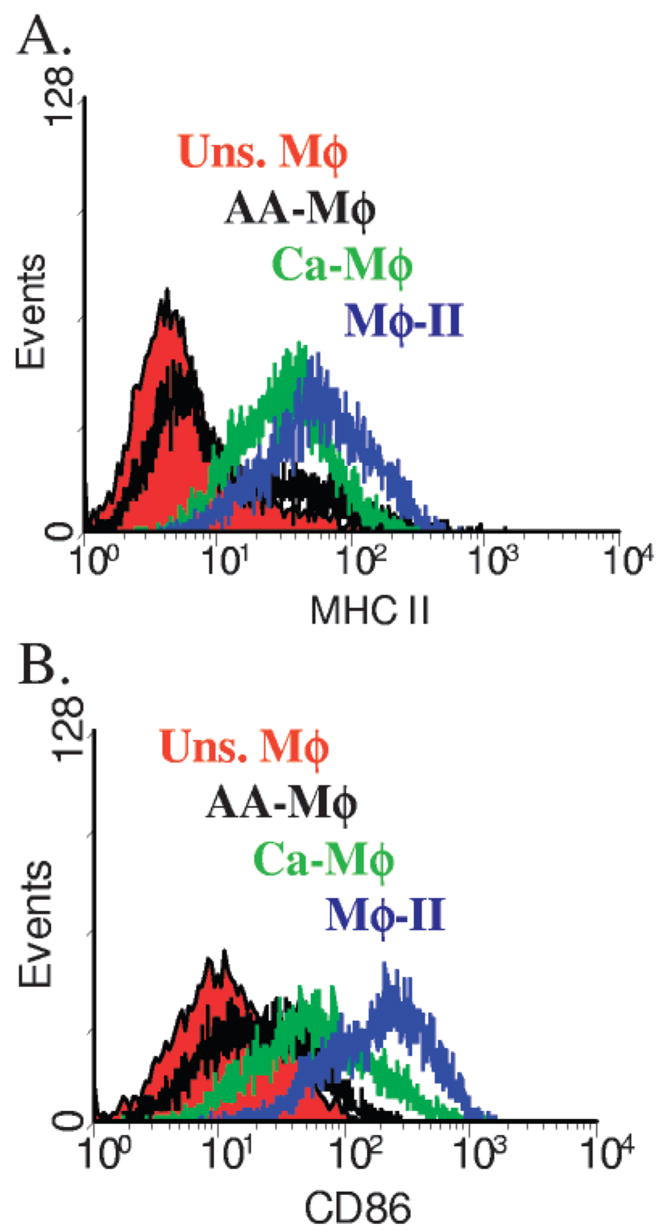
Activated Mφ are able to present antigen to T cells [11]. We wished to examine the antigen-presenting potential of each of the three Mφ populations. One of the defining characteristics of an efficient APC is the expression of MHC Class II and B7 costimulatory molecules. BMMφ were primed with IFN-γ overnight or left unprimed. Primed cells were then stimulated for 24 h with LPS (Ca-Mφ) or LPS + IgG-OVA IC (Mφ-II). AA-Mφ were stimulated with IL-4. These cells were then stained with FITC-conjugated α-I-Ad or PE-conjugated α-CD86. Expression in activated cells was compared with that of unstimulated Mφ. Mφ-II had the highest expression of MHC Class II (Fig. 5A) and CD86 (Fig. 5B). Ca-Mφ also up-regulated MHC Class II and CD86, although not to the level of Mφ-II. In contrast, AA-Mφ only minimally up-regulated MHC Class II and CD86 expression. Thus, the three Mφ populations express distinct levels of these molecules and therefore, may have different potentials to present antigen to T cells.
Fig. 5.
Activated Mφ express different levels of MHC Class II and B7 costimulatory molecules. Flow cytometry profiles for (A) MHC Class II and (B) B7.2 (CD86) on activated Mφ 24 h after stimulation. Mφ were primed with IFN-γ and stimulated with LPS (Ca-Mφ) or LPS + IC (Mφ-II), primed with IL-4 (AA-Mφ) or left unstimulated. Mφ were stained with FITC-conjugated α-I-Ad or PE-conjugated α-CD86. Changes in expression are assessed by comparison against unstimulated Mφ. Figures are representative of at least three independent experiments.
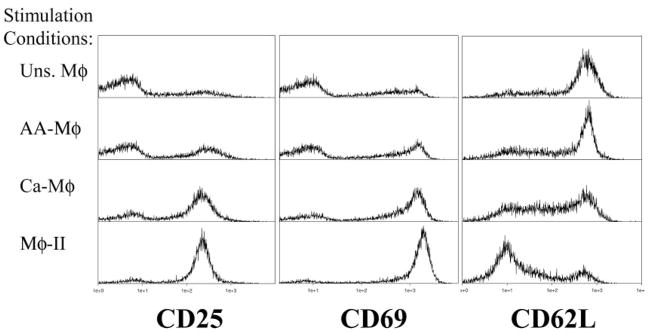
Each of the Mφ populations was analyzed for its ability to present OVA antigen to naive OVA-specific DO11.10 T cells [19]. For these studies, BMMφ were primed overnight with IFN-γ (100 U/ml) or IL-4 (10 U/ml, AA-Mφ). Cells primed with IL-4 overnight were confirmed to have high arginase and FIZZ1 expression (data not shown). Cells were washed and stimulated with LPS + OVA (Ca-Mφ), LPS + IgG-OVA (Mφ-II), or OVA alone (AA-Mφ and unstimulated Mφ). CD3+ T cells were isolated from total splenocytes from DO11.10 ice and added to Mφ 2 h after activation. T cells and Mφ were cocultured for 24 h and then stained for CD25, CD69, and CD62L expression. CD25 and CD69 typically increase with T cell activation, whereas CD62L decreases [30–32]. The expression of each marker was assessed by flow cytometry, gating on Thyl.2+ cells. As expected, unstimulated Mφ drove minimal up-regulation of CD25 (Fig. 6, left panels) and CD69 (Fig. 6, center panels) on T cells. They also induce only minimal down-regulation of CD62L (Fig. 6, right panels). T cells cocultured with Mφ-II showed the greatest signs of activation, expressing the highest levels of CD25 and CD69 expression and the lowest expression of CD62L (Fig. 6). Thus, despite the potent production of IL-10 from Mφ-II, these cells are effective activators of naïve T cells. The cocultivation of T cells with Ca-Mφ was also able to induce T cell activation markers, albeit slightly less than Mφ-II. There was a slight decrease in the up-regulation of CD25 and CD69 and less of a down-regulation of CD62L (Fig. 6). AA-Mφ induced only minimal signs of T cell activation, which were similar to unstimulated Mφ. Thus, Mφ-II appear to be efficient APC, and this is in stark contrast to AA-Mφ, which were poor at inducing T cell activation.
Fig. 6.
Activated Mφ drive different levels of T cell activation. DO11.10 T cells were stained after 24 h of coculture with unstimulated (top panels), AA-Mφ (upper-middle panels), Ca-Mφ (lower-middle panels), and Mφ-II (bottom panels) in the presence of antigen. T cells were selected by gating for Thyl.2+ cells and CD25 (left), CD69 (center), and CD62L (right). Figures are representative of at least three independent experiments.
Activated Mφ drive different levels of antigen-specific T cell proliferation
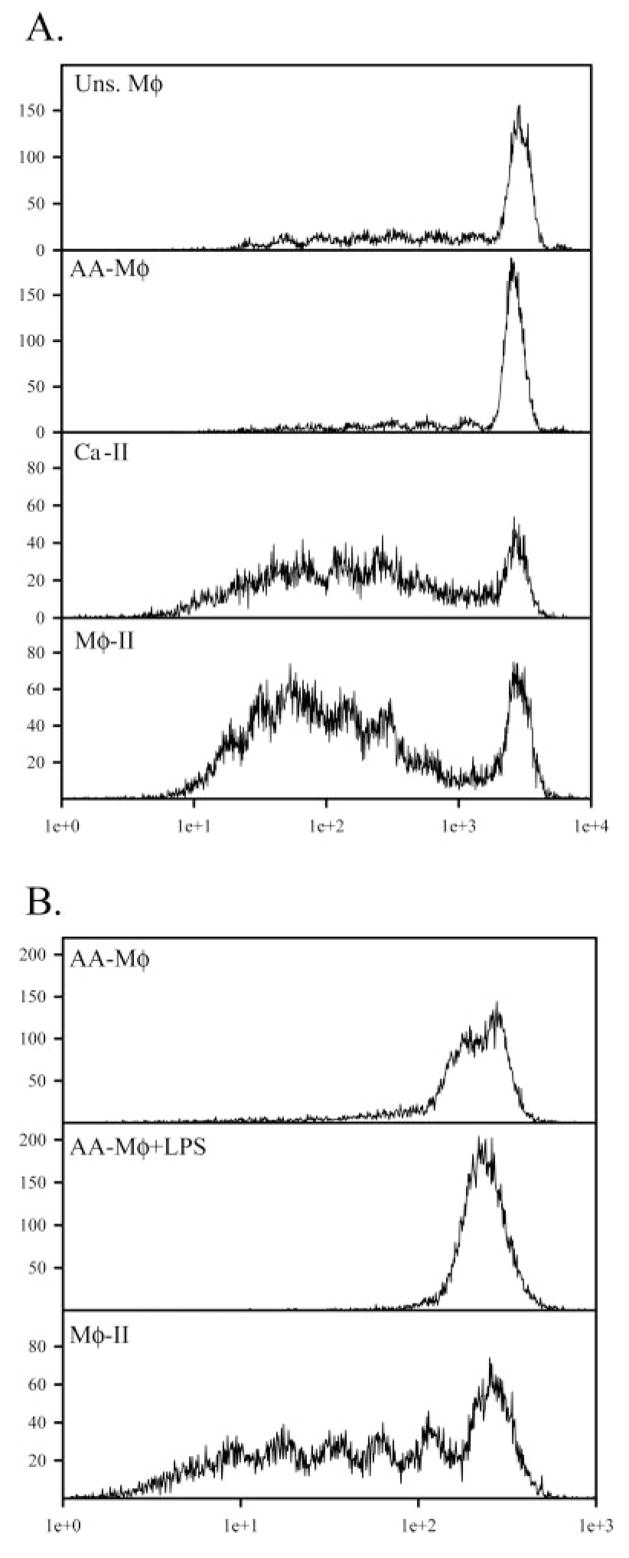
To directly compare T cell activation by these three populations of Mφ, CD3+ T cells were CFSE-stained and added to each population of Mφ 2 h after stimulation. Mφ and T cells were cocultured for 96 h and stained with PE-conjugated α-Thy 1.2. Proliferation of Thyl.2+ cells was assessed by flow cytometry. As expected, Mφ given antigen alone were able to drive only minimal levels of T cell proliferation, as shown by minimal dilution of the CFSE stain (Fig. 7A). AA-Mφ were equally poor at driving T cell proliferation (Fig. 7A). Ca-Mφ and Mφ-II induced a robust, primary T cell response characterized by several rounds of T cell proliferation (Fig. 7A). Thus, Mφ-II are particularly effective as APC, inducing the rapid expression of early activation markers (Fig. 6), and they support T cell proliferation (Fig. 7). AA-Mφ, in contrast, are relatively poor at inducing T cell activation markers, and they fail to support the proliferation of naive T cells. Even after stimulation with LPS, IL-4-primed Mφ failed to support substantial amounts of T cell proliferation (Fig. 7B).
Fig. 7.
Activated Mφ drive different levels of T cell proliferation. (A) Naïve T cells were isolated from total splenocytes from DO11.10, CFSE-stained, and co-cultured in the presence of unstimulated (top panel), AA-Mφ (upper-middle panel), Ca-Mφ (lower-middle panel), or Mφ-II (bottom panel) in the presence of 150 μg/ml OVA. CFSE profiles of Thy1.2+ T cells were measured after 96 h of coculture. (B) AA-Mφ given OVA alone (upper panel) or OVA + LPS (10 ng/ml, center panel). Mφ-II were used as APC as in (A). Figures are representative of at least three independent experiments.
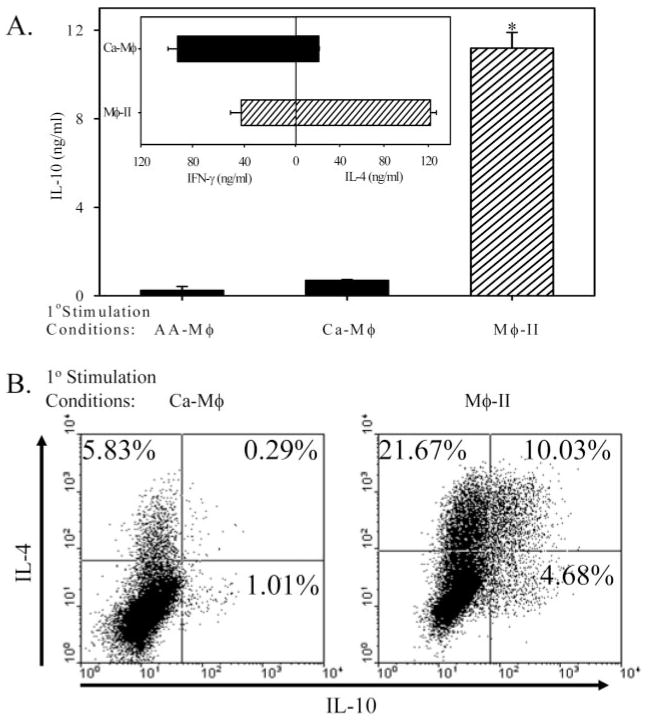
We also examined secondary T cell responses to antigen and APC. For these assays, T cells were stimulated with each of the Mφ populations and antigen for 7 days. T cells were washed and restimulated under nonbiasing conditions with plate-bound anti-CD3 for 24 h. Cytokine levels were measured by ELISA. Although cytokine production from T cells activated by Mφ-II has been examined previously [11], a comparison among the three cell types has not been reported. T cells activated by Ca-Mφ (LPS+OVA) produced relatively high levels of IFN-γ and less IL-4, whereas T cells activated by Mφ-II produced relatively high levels of IL-4 and significantly reduced levels of IFN-γ (Fig. 8A, inset), as previously reported [11]. We measured IL-10 production from these T cells. Mφ-II give rise to T cells which produced high levels of IL-10 in the secondary response, whereas Ca-Mφ induced a population of T cells that produced only modest levels of IL-10 (Fig. 8A). This is not a result of an overall lack of antigen presentation, as Ca-Mφ induced relatively high levels of IFN-γ production from T cells (Fig. 8A, inset). AA-Mφ failed to induce IL-10 production in the secondary response, possibly as a result of the lack of significant levels of proliferation in the primary response. Flow cytometry and intracellular cytokine staining were used to measure cytokine production on the single-cell level (Fig. 8B). Following T cell activation by Ca-Mφ, there was only a small percentage of T cells in the population that produced IL-4 (5.8%) or IL-10 (1%; Fig. 8B, left panel). There were few if any double producers. In contrast, following activation with Mφ-II, a substantial portion of the T cell population produced IL-4 (31.6%) or IL-10 (14.7%), and 10% of total T cells produced IL-4 and IL-10 (Fig. 8B, right panel).
Fig. 8.
Cytokine profiles of T cells after secondary stimulation. T cells were cocultured with AA-Mφ Ca-Mφ, or Mφ-II for 1 week, washed, then restimulated with plate-bound α-CD3 (5 μg/ml). (A) IL-10 from T cells restimulated for 24 h as measured by ELISA. (Inset) T cell cytokine production following primary stimulation with Ca-Mφ (upper) or Mφ-II (lower), as described previously [11]. (B) Intracellular staining for IL-4 and IL-10. T cells were restimulated for 6 h in the presence of GolgiStop (monensin) with plate-bound α-CD3e after biasing and activation by Ca-Mφ (left panel) or Mφ-II (right panel). Cells were fixed/permeablized using the Cytofix/Cytoperm reagent and stained using a PE-conjugated antibody against IL-4 and a FITC-conjugated antibody against IL-10. Quadrants are set using appropriate isotype controls. Figures are representative of at least three independent experiments. Error bars indicate ± SD. *, P < 0.00001.
DISCUSSION
The classical activation of Mφ leads to the production of a variety of lipid mediators, cytokines, and chemokines [16]. These mediators make Ca-Mφ important effector cells, which can efficiently kill intracellular microorganisms. These same mediators, however, make these cells potent inflammatory cells, which can mediate autoimmune pathologies. The thorough characterization of Ca-Mφ has been aided greatly by the reliable generation of these cells in vitro, simply by priming cultivated Mφ with IFN-γ and then stimulating them with TNF or TLR activators. These defined, in vitro studies have told us a great deal about the activation response and the biochemistry of the mediators produced during it. AA-Mφ were first identified following the addition of IL-4 to cultures of resident Mφ. These cells were shown to express higher levels of the mannose receptor [6]. Subsequent studies have identified a number of reliable markers for the AA-Mφ, including FIZZ1 and YM1/2 [7]. Many of the studies to characterize the AA-Mφ were performed on Mφ isolated from mice, following experimental trematode [8] or nematode [33] infections. These studies showed that AA-Mφ are physiologically distinct from Ca-Mφ, in that they up-regulate the ECM-associated proteins fibronectin and βIG-H3 [34], the chemokine alternative Mφ-associated chemokine 1 [35], and the receptor for β-glucan, Dectin-1 [36]. The expression of arginase by murine Mφ restricts the availablility of L-arginine, a substrate for iNOS. This not only prevents NO production by these cells but also gives them the ability to contribute to the formation of the ECM through the production of prolines [9]. It should be noted that human monocytes may not respond to Th2 cytokines in the same way as murine BMMφ cells, as they fail to up-regulate arginase activity when treated with IL-13 [37]. AA-Mφ may provide immunity during helminth infections [13, 38], but they can also contribute to disease pathology in a murine model of experimental schistosomiasis [8]. Despite all we now know about these cells from disease models, a careful parallel comparison with other Mφ following defined, in vitro activation conditions has not been performed previously.
The Mφ-II remains poorly characterized, relative to these other Mφ populations. We previously reported on the alterations in cytokine production by these cells [10, 11] and on functional properties that are distinct from Ca-Mφ [12]. These cells develop during some Leishmania infections and contribute to disease progression [13]. In the present work, we show that Mφ-II lack arginase and are unable to produce urea from arginine. In this respect, they are similar to Ca-Mφ but markedly different from AA-Mφ. Mφ-II express high levels of costimulatory molecules and are efficient APC, another property that distinguishes them from AA-Mφ. Finally, neither Mφ-II nor Ca-Mφ express FIZZ1 or YM1, two markers for AA-Mφ. Thus, there are clear biochemical and functional distinctions between these two populations of Mφ. We also compared Mφ-II with Ca-Mφ by microarray analysis and found that there were only a limited number of transcripts that were different between these two populations.
We identified two potential markers for Mφ-II. We show that Mφ-II up-regulate LIGHT, which may not only be a marker for Mφ-II, but it may also bear functional activity. LIGHT has been shown to costimulate T cell responses through HVEM (TR2) [39], which is expressed on most lymphocyte populations [40]. LIGHT can also transmit co-stimulatory signals into T cells through interactions with the soluble receptor TR6, enhancing activation in response to suboptimal TCR interactions [41, 42]. Thus, LIGHT may play a role as an additional costimulatory molecule, contributing to T cell activation and proliferation in response to Mφ-II. In addition to LIGHT, SPHK1 may be another previously undescribed marker for the Mφ-II. SPHKs catalyze the production of sphingosine-1 phosphate from sphingosine. Mice have two isoforms, SPHK1a and SPHK1b, which are not distinguished by our PCR analysis. These two proteins can differ with respect to enzymatic activity, stability, and cellular location [43]. SPHK1 has been shown to be necessary for C5a-triggered, intracellular Ca2+ signals [44]. Although this does not necessarily fit our model of Mφ-II being antiinflammatory Mφ, this enzyme may be an important mediator of calcium fluxes in these Mφ. It has also been proposed that SPHK1 may play a role in retaining cell viability of endotoxin-stimulated Mφ [45]. In T cells, SPHK1 controls the overproduction of the Th1-associated cytokines, IL-2, TNF-α, and IFN-γ [43, 46]. Thus, the induction of SPHK may be an important negative-regulator of inflammatory cytokines and chemokines in the Mφ-II.
In summary, we provide a side-by-side comparison of three distinct populations of activated Mφ. This comparison has allowed us to characterize each with regard to physiology and functionality. It also puts us in a strong position to identify a panel of markers for each cell population, as a first step toward identifying specific “signatures” for each of the various activated Mφ populations associated with different disease states.
Acknowledgments
This research was supported in part by the National Institutes of Health Grant AI49383.
References
- 1.Lang R, Patel D, Morris JJ, Rutschman RL, Murray PJ. Shaping gene expression in activated and resting primary macrophages by IL-10. J Immunol. 2002;169:2253–2263. doi: 10.4049/jimmunol.169.5.2253. [DOI] [PubMed] [Google Scholar]
- 2.David JR. Macrophage activation by lymphocyte mediators. Fed Proc. 1975;34:1730–1736. [PubMed] [Google Scholar]
- 3.Akira S, Uematsu S, Takeuchi O. Pathogen recognition and innate immunity. Cell. 2006;124:783–801. doi: 10.1016/j.cell.2006.02.015. [DOI] [PubMed] [Google Scholar]
- 4.Oppenheim JJ, Yang D. Alarmins: chemotactic activators of immune responses. Curr Opin Immunol. 2005;17:359–365. doi: 10.1016/j.coi.2005.06.002. [DOI] [PubMed] [Google Scholar]
- 5.Nathan C, Shiloh MU. Reactive oxygen and nitrogen intermediates in the relationship between mammalian hosts and microbial pathogens. Proc Natl Acad Sci USA. 2000;97:8841–8848. doi: 10.1073/pnas.97.16.8841. [DOI] [PMC free article] [PubMed] [Google Scholar]
- 6.Stein M, Keshav S, Harris N, Gordon S. Interleukin 4 potently enhances murine macrophage mannose receptor activity: a marker of alternative immunologic macrophage activation. J Exp Med. 1992;176:287–292. doi: 10.1084/jem.176.1.287. [DOI] [PMC free article] [PubMed] [Google Scholar]
- 7.Raes G, Noel W, Beschin A, Brys L, de Baetselier P, Hassanzadeh GH. FIZZ1 and Ym as tools to discriminate between differentially activated macrophages. Dev Immunol. 2002;9:151–159. doi: 10.1080/1044667031000137629. [DOI] [PMC free article] [PubMed] [Google Scholar]
- 8.Hesse M, Modolell M, La Flamme AC, Schito M, Fuentes JM, Cheever AW, Pearce EJ, Wynn TA. Differential regulation of nitric oxide synthase-2 and arginase-1 by type 1/type 2 cytokines in vivo: granulomatous pathology is shaped by the pattern of L-arginine metabolism. J Immunol. 2001;167:6533–6544. doi: 10.4049/jimmunol.167.11.6533. [DOI] [PubMed] [Google Scholar]
- 9.Albina JE, Mills CD, Henry WL, Jr, Caldwell MD. Temporal expression of different pathways of 1-arginine metabolism in healing wounds. J Immunol. 1990;144:3877–3880. [PubMed] [Google Scholar]
- 10.Gerber JS, Mosser DM. Reversing lipopolysaccharide toxicity by ligating the macrophage Fc γ receptors. J Immunol. 2001;166:6861–6868. doi: 10.4049/jimmunol.166.11.6861. [DOI] [PubMed] [Google Scholar]
- 11.Anderson CF, Mosser DM. Cutting edge: biasing immune responses by directing antigen to macrophage Fc γ receptors. J Immunol. 2002;168:3697–3701. doi: 10.4049/jimmunol.168.8.3697. [DOI] [PubMed] [Google Scholar]
- 12.Anderson CF, Mosser DM. A novel phenotype for an activated macrophage: the type 2 activated macrophage. J Leukoc Biol. 2002;72:101–106. [PubMed] [Google Scholar]
- 13.Miles SA, Conrad SM, Alves RG, Jeronimo SM, Mosser DM. A role for IgG immune complexes during infection with the intracellular pathogen Leishmania. J Exp Med. 2005;201:747–754. doi: 10.1084/jem.20041470. [DOI] [PMC free article] [PubMed] [Google Scholar]
- 14.Mantovani A, Sozzani S, Locati M, Allavena P, Sica A. Macrophage polarization: tumor-associated macrophages as a paradigm for polarized M2 mononuclear phagocytes. Trends Immunol. 2002;23:549–555. doi: 10.1016/s1471-4906(02)02302-5. [DOI] [PubMed] [Google Scholar]
- 15.Frankenberger M, Haussinger K, Ziegler-Heitbrock L. Liposomal methylprednisolone differentially regulates the expression of TNF and IL-10 in human alveolar macrophages. Int Immunopharmacol. 2005;5:289–299. doi: 10.1016/j.intimp.2004.09.033. [DOI] [PubMed] [Google Scholar]
- 16.Mantovani A, Sica A, Sozzani S, Allavena P, Vecchi A, Locati M. The chemokine system in diverse forms of macrophage activation and polarization. Trends Immunol. 2004;25:677–686. doi: 10.1016/j.it.2004.09.015. [DOI] [PubMed] [Google Scholar]
- 17.Biswas SK, Gangi L, Paul S, Schioppa T, Saccani A, Sironi M, Bottazzi B, Doni A, Vincenzo B, Pasqualini F, Vago L, Nebuloni M, Mantovani A, Sica A. A distinct and unique transcriptional program expressed by tumor-associated macrophages (defective NF-κB and enhanced IRF-3/STAT1 activation) Blood. 2006;107:2112–2122. doi: 10.1182/blood-2005-01-0428. [DOI] [PubMed] [Google Scholar]
- 18.Skeen MJ, Miller MA, Shinnick TM, Ziegler HK. Regulation of murine macrophage IL-12 production. Activation of macrophages in vivo, restimulation in vitro, and modulation by other cytokines. J Immunol. 1996;156:1196–1206. [PubMed] [Google Scholar]
- 19.Murphy KM, Heimberger AB, Loh DY. Induction by antigen of intrathymic apoptosis of CD4+CD8+TCRlo thymocytes in vivo. Science. 1990;250:1720–1723. doi: 10.1126/science.2125367. [DOI] [PubMed] [Google Scholar]
- 20.Johnson CR, Kitz D, Little JR. A method for the derivation and continuous propagation of cloned murine bone marrow macrophages. J Immunol Methods. 1983;65:319–332. doi: 10.1016/0022-1759(83)90127-8. [DOI] [PubMed] [Google Scholar]
- 21.Stuehr DJ, Nathan CF. Nitric oxide. A macrophage product responsible for cytostasis and respiratory inhibition in tumor target cells. J Exp Med. 1989;169:1543–1555. doi: 10.1084/jem.169.5.1543. [DOI] [PMC free article] [PubMed] [Google Scholar]
- 22.Corraliza IM, Campo ML, Soler G, Modolell M. Determination of arginase activity in macrophages: a micromethod. J Immunol Methods. 1994;174:231–235. doi: 10.1016/0022-1759(94)90027-2. [DOI] [PubMed] [Google Scholar]
- 23.Anderson CF, Mosser DM. A novel phenotype for an activated macrophage: the type 2 activated macrophage. J Leukoc Biol. 2002;72:101–106. [PubMed] [Google Scholar]
- 24.Schebesch C, Kodelja V, Muller C, Hakij N, Bisson S, Orfanos CE, Goerdt S. Alternatively activated macrophages actively inhibit proliferation of peripheral blood lymphocytes and CD4+ T cells in vitro. Immunology. 1997;92:478–486. doi: 10.1046/j.1365-2567.1997.00371.x. [DOI] [PMC free article] [PubMed] [Google Scholar]
- 25.Kambayashi T, Jacob CO, Strassmann G. IL-4 and IL-13 modulate IL-10 release in endotoxin-stimulated murine peritoneal mononuclear phagocytes. Cell Immunol. 1996;171:153–158. doi: 10.1006/cimm.1996.0186. [DOI] [PubMed] [Google Scholar]
- 26.Stout RD, Jiang C, Matta B, Tietzel I, Watkins SK, Suttles J. Macrophages sequentially change their functional phenotype in response to changes in microenvironmental influences. J Immunol. 2005;175:342–349. doi: 10.4049/jimmunol.175.1.342. [DOI] [PubMed] [Google Scholar]
- 27.Modolell M, Corraliza IM, Link F, Soler G, Eichmann K. Reciprocal regulation of the nitric oxide synthase/arginase balance in mouse bone marrow-derived macrophages by TH1 and TH2 cytokines. Eur J Immunol. 1995;25:1101–1104. doi: 10.1002/eji.1830250436. [DOI] [PubMed] [Google Scholar]
- 28.Holcomb IN, Kabakoff RC, Chan B, Baker TW, Gurney A, Henzel W, Nelson C, Lowman HB, Wright BD, Skelton NJ, Frantz GD, Tumas DB, Peale FV, Jr, Shelton DL, Herbert CC. FIZZ1, a novel cysteine-rich secreted protein associated with pulmonary inflammation, defines a new gene family. EMBO J. 2000;19:4046–4055. doi: 10.1093/emboj/19.15.4046. [DOI] [PMC free article] [PubMed] [Google Scholar]
- 29.Mortarini R, Scarito A, Nonaka D, Zanon M, Bersani I, Montaldi E, Pennacchioli E, Patuzzo R, Santinami M, Anichini A. Constitutive expression and costimulatory function of LIGHT/TNFSF14 on human melanoma cells and melanoma-derived microvesicles. Cancer Res. 2005;65:3428–3436. doi: 10.1158/0008-5472.CAN-04-3239. [DOI] [PubMed] [Google Scholar]
- 30.Chao CC, Jensen R, Dailey MO. Mechanisms of L-selectin regulation by activated T cells. J Immunol. 1997;159:1686–1694. [PubMed] [Google Scholar]
- 31.Lowenthal JW, Zubler RH, Nabholz M, MacDonald HR. Similarities between interleukin-2 receptor number and affinity on activated B and T lymphocytes. Nature. 1985;315:669–672. doi: 10.1038/315669a0. [DOI] [PubMed] [Google Scholar]
- 32.Yokoyama WM, Koning F, Kehn PJ, Pereira GM, Stingl G, Coligan JE, Shevach EM. Characterization of a cell surface-expressed disulfide-linked dimer involved in murine T cell activation. J Immunol. 1988;141:369–376. [PubMed] [Google Scholar]
- 33.Nair MG, Gallagher IJ, Taylor MD, Loke P, Coulson PS, Wilson RA, Maizels RM, Allen JE. Chitinase and Fizz family members are a generalized feature of nematode infection with selective upregulation of Ym1 and Fizz1 by antigen-presenting cells. Infect Immun. 2005;73:385–394. doi: 10.1128/IAI.73.1.385-394.2005. [DOI] [PMC free article] [PubMed] [Google Scholar]
- 34.Gratchev A, Guillot P, Hakiy N, Politz O, Orfanos CE, Schledzewski K, Goerdt S. Alternatively activated macrophages differentially express fibronectin and its splice variants and the extracellular matrix protein βIG-H3. Scand J Immunol. 2001;53:386–392. doi: 10.1046/j.1365-3083.2001.00885.x. [DOI] [PubMed] [Google Scholar]
- 35.Kodelja V, Muller C, Politz O, Hakij N, Orfanos CE, Goerdt S. Alternative macrophage activation-associated CC-chemokine-1, a novel structural homologue of macrophage inflammatory protein-1 αwith a Th2-associated expression pattern. J Immunol. 1998;160:1411–1418. [PubMed] [Google Scholar]
- 36.Willment JA, Lin HH, Reid DM, Taylor PR, Williams DL, Wong SY, Gordon S, Brown GD. Dectin-1 expression and function are enhanced on alternatively activated and GM-CSF-treated macrophages and are negatively regulated by IL-10, dexamethasone, and lipopolysaccharide. J Immunol. 2003;171:4569–4573. doi: 10.4049/jimmunol.171.9.4569. [DOI] [PubMed] [Google Scholar]
- 37.Scotton CJ, Martinez FO, Smelt MJ, Sironi M, Locati M, Mantovani A, Sozzani S. Transcriptional profiling reveals complex regulation of the monocyte IL-1 β system by IL-13. J Immunol. 2005;174:834–845. doi: 10.4049/jimmunol.174.2.834. [DOI] [PubMed] [Google Scholar]
- 38.Brys L, Beschin A, Raes G, Ghassabeh GH, Noel W, Brandt J, Brombacher F, De Baetselier P. Reactive oxygen species and 12/15-lipoxygenase contribute to the antiproliferative capacity of alternatively activated myeloid cells elicited during helminth infection. J Immunol. 2005;174:6095–6104. doi: 10.4049/jimmunol.174.10.6095. [DOI] [PubMed] [Google Scholar]
- 39.Tamada K, Shimozaki K, Chapoval AI, Zhai Y, Su J, Chen SF, Hsieh SL, Nagata S, Ni J, Chen L. LIGHT, a TNF-like molecule, costimulates T cell proliferation and is required for dendritic cell-mediated allogeneic T cell response. J Immunol. 2000;164:4105–4110. doi: 10.4049/jimmunol.164.8.4105. [DOI] [PubMed] [Google Scholar]
- 40.Kwon BS, Tan KB, Ni J, Oh KO, Lee ZH, Kim KK, Kim YJ, Wang S, Gentz R, Yu GL, Harrop J, Lyn SD, Silverman C, Porter TG, Truneh A, Young PR. A newly identified member of the tumor necrosis factor receptor superfamily with a wide tissue distribution and involvement in lymphocyte activation. J Biol Chem. 1997;272:14272–14276. doi: 10.1074/jbc.272.22.14272. [DOI] [PubMed] [Google Scholar]
- 41.Shi G, Luo H, Wan X, Salcedo TW, Zhang J, Wu J. Mouse T cells receive costimulatory signals from LIGHT, a TNF family member. Blood. 2002;100:3279–3286. doi: 10.1182/blood-2002-05-1404. [DOI] [PubMed] [Google Scholar]
- 42.Wan X, Zhang J, Luo H, Shi G, Kapnik E, Kim S, Kanakaraj P, Wu JA. TNF family member LIGHT transduces costimulatory signals into human T cells. J Immunol. 2002;169:6813–6821. doi: 10.4049/jimmunol.169.12.6813. [DOI] [PubMed] [Google Scholar]
- 43.Kihara A, Anada Y, Igarashi Y. Mouse sphingosine kinase isoforms SPHK1a and SPHK1b differ in enzymatic traits including stability, localization, modification, and oligomerization. J Biol Chem. 2006;281:4532–4539. doi: 10.1074/jbc.M510308200. [DOI] [PubMed] [Google Scholar]
- 44.Melendez AJ, Ibrahim FB. Antisense knockdown of sphingosine kinase 1 in human macrophages inhibits C5a receptor-dependent signal transduction, Ca2+ signals, enzyme release, cytokine production, and chemotaxis. J Immunol. 2004;173:1596–1603. doi: 10.4049/jimmunol.173.3.1596. [DOI] [PubMed] [Google Scholar]
- 45.Wu W, Mosteller RD, Broek D. Sphingosine kinase protects lipopolysaccharide-activated macrophages from apoptosis. Mol Cell Biol. 2004;24:7359–7369. doi: 10.1128/MCB.24.17.7359-7369.2004. [DOI] [PMC free article] [PubMed] [Google Scholar]
- 46.Yang J, Castle BE, Hanidu A, Stevens L, Yu Y, Li X, Stearns C, Papov V, Rajotte D, Li J. Sphingosine kinase 1 is a negative regulator of CD4+ Th1 cells. J Immunol. 2005;175:6580–6588. doi: 10.4049/jimmunol.175.10.6580. [DOI] [PubMed] [Google Scholar]


