

Abstract
The electronic properties of Thermus thermophilus CuA in the oxidized form were studied by 1H and 13C NMR spectroscopy. All the 1H and 13C resonances from cysteine and imidazole ligands were observed and assigned in a sequence-specific fashion. The detection of net electron spin density on a peptide moiety is attributed to the presence of a H-bond to a coordinating sulfur atom. This hydrogen-bond is conserved in all natural CuA variants, and is important to maintain the electronic structure of the metal site, rendering the two Cys ligands nonequivalent. The anomalous temperature dependence of the chemical shifts is explained by the presence of a low-lying excited state located about 600 cm-1 above the ground state. The room temperature shifts can be described as the thermal average of a σu* ground state and a πu excited state. These results provide a detailed description of the electronic structure of the CuA site at atomic resolution in solution at physiologically relevant temperature.
Introduction
Cytochrome c Oxidase (CcO) is a membrane-embedded enzymatic complex that catalyzes the reduction of molecular oxygen to water, accepting electrons from reduced cytochrome c molecules and contributing to the generation of a transmembrane proton gradient that is used as energy currency for a variety of cellular mechanisms.1,2 CcO is an integral membrane protein located in the inner mitochondrial membrane of eukaryotic cells and in the membrane of prokaryotic cells. It is composed of several subunits which accommodate a series of cofactors involved in electron transfer from cytochrome c to the catalytic center, and in the chemical reaction itself. The catalytic efficiency of CcO depends on an efficient electron transport from cytochrome c to the reactive heme a3-CuB, buried deep inside the membrane.1,2 Electrons coming from cytochrome c are transferred to a heme group embedded in the membrane by a binuclear copper site (CuA),3-5 that is located on the periplasmic (or intermembrane) side of the CcO.
CuA is a binuclear metal center with two cysteine ligands bridging the copper ions, two terminal histidine residues coordinated through their Nδ atoms, and two weakly coordinated axial ligands provided by a methionine sulfur and a backbone carbonyl (Figure 1A).6 The Cys sulfur atoms together with the copper ions give rise to a highly covalent and rigid Cu2S2 core, where the copper ions are only 2.4-2.6 Å apart.7-10 The high efficiency of the CuA center in shuttling electrons over long distances has been attributed to the high rigidity of this core, which endows it with a low reorganization energy,11,12 and to its particular electronic structure.13,14 The reduced [Cu+1-Cu+1] state is diamagnetic, while the oxidized form [Cu+1.5-Cu+1.5] is a fully delocalized class III mixed-valence pair with two equivalent copper ions as put forward by Kroneck, Antholine and coworkers by EPR before the availability of a crystal structure.15,16 The strong Cu-S bonding has been supported by the large covalence evidenced by XAS studies at the Cu and S edges from the Solomon group;17-22 as well as by ENDOR23-25 and NMR data,26-31 which have revealed a large amount of unpaired spin density onto the Cys residues.
Figure 1.
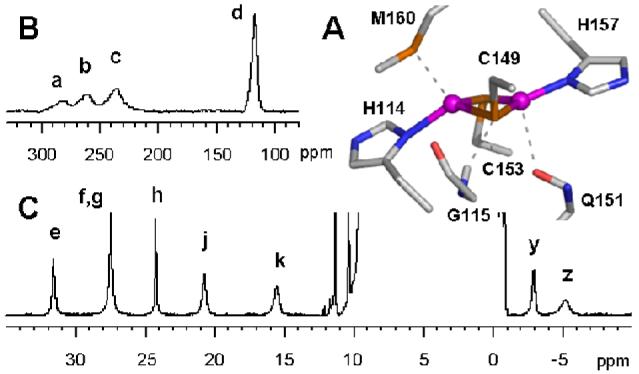
(A) The binuclear CuA center rendered from PDB ID 2CUA.7 (B and C) 1H NMR spectra of unlabeled TtCuA, aimed to detect the paramagnetically-shifted signals a-d (B, recorded with SuperWEFT sequence) and e-z (C, recorded with presaturation of the water signal). Spectra recorded at 600 MHz, 298 K, on a sample at pH 7 with 10% D2O.
All spectroscopic evidence and theoretical calculations support a σu* ground state and a πu level as the first excited state.17,19,32-36 This description is consistent with the short Cu-Cu distance (2.4-2.6 Ǻ) which also allows full valence delocalization in the oxidized state despite the asymmetry of the protein milieu. Instead, a dinuclear copper model complex synthesized by Tolman with a longer Cu-Cu distance (2.92 Ǻ), displays an inversion of these two levels, with the πu becoming the ground state.19 The value of the σu*/πu energy gap in CuA centers has been a matter of debate:33 EPR and MCD spectra are consistent with a value of 5,000 cm-1 while the unusual temperature dependence of the NMR spectra was interpreted as the result of the existence of a thermally-accessible excited state located at 200 - 800 cm-1.27,30,31
In recent years, an emerging concept in biochemistry has arisen from NMR studies: the identification and characterization of excited states that become populated at room temperature.37,38 The availability of these states allows the protein to explore alternative conformations relevant for protein folding, substrate recognition and catalysis. In paramagnetic metalloproteins, the interrogation of the electronic structures of excited states by room temperature spectroscopic techniques has been valuable to account for the existence of low lying excited states in heme systems,39,40 iron-sulfur clusters41 and dinuclear Cu(II) centers.42-44 Notwithstanding, the issue of the excited state in native CuA sites has been rather elusive and debated. Here we report an extensive, unambiguous assignment of the 1H and 13C NMR spectra of the CuA fragment from Thermus thermophilus ba3 oxidase (TtCuA). These data allow us to: (1) calculate the energy gap between the ground and excited states at room temperature and explain the anomalous temperature dependence of the 13C signals; (2) identify these states as those predicted from quantum mechanical calculations; (3) estimate the experimental electron spin density of the thermally-averaged species resulting at room temperature; (4) provide a description of the electron spin density at the σu* and πu states; (5) detect electron spin density delocalized by H-bonding to a sulfur atom of one Cys, which plays an important role in maintaining the electronic structure of the center and makes the two Cys ligands nonequivalent. These findings provide new insights for the understanding of the electronic structure of the CuA site and its possible role in long-range electron transfer events, as well as for the complementary nature of ground state magnetic techniques (such as EPR, ENDOR and MCD) with solution NMR, a room temperature technique.
Materials and Methods
Production of Protein Samples
Unlabeled and uniformly labeled proteins were expressed from pET9ACuAWTT9 (KanR) in E. coli BL21(DE3) growing in either rich LB medium or M9 minimal medium supplemented with labeled or unlabeled ammonium sulphate (1.2 g/L, 99% 15N when labeled) and glucose (4 g/L, 99% 13C when labeled), respectively, according to the desired labeling scheme. Proteins with 13C and 15N labeling at Cys were expressed from the same plasmid in E. coli JM15(DE3)pLysS (CmR) in M9 minimal medium supplemented with unlabeled ammonium sulphate (1.2 g/L) and glucose (4 g/L), doubly-labeled cysteine (15NH213CH(13CH2SH)13COOH), and the 19 remaining unlabeled amino acids as detailed in45,46. Typical yields were about 13 mg/L and 30 mg/L for labeled and unlabeled samples, respectively.
Purification of proteins from cell lysates was done as described elsewhere.31,47 Protein samples for NMR experiments were prepared in 100 mM phosphate buffer (pH 7 unless otherwise noted) with 100 mM KCl in either 10% or 100 % D2O as required for each experiment, and concentrated to 250 - 300 μl of 1 - 2.5 mM protein concentration.
Nuclear Magnetic Resonance Spectroscopy
NMR experiments were carried out on a Bruker Avance II Spectrometer operating at 600.13 MHz (1H frequency). 1H-detected spectra were acquired with a triple-resonance (TXI) probehead. 1H spectra in the 35 / -10 ppm region were observed with a π/2 pulse preceded by presaturation of the water signal, on a spectral window of ca. 48 kHz, and with a total recycle time of ca. 300 ms. 1H spectra aimed at the observation of the broad Hβ signals were acquired with a SuperWEFT pulse sequence48 on a spectral window of ca. 360 kHz, with a total recycle delay of ca. 40 ms and variable intermediate delays. 1H, 13C- and 1H, 15N-HMQC experiments were acquired on spectral widths of ca. 50 kHz in the 1H dimension (1k points) and ca. 100 kHz in the indirect dimension (128 points). The delay for coherence transfer was set to the average T2 of the involved 1H signals, i.e. about 2 ms, and the relaxation delay was set to ca. 30 ms.49 Several experiments were carried out setting the frequency of the heteronucleus at different offsets.
Saturation Transfer Difference (STD) and NOE experiments on the broad signals from Cys’ β protons were performed on samples prepared in 100% D2O buffer, either completely oxidized for NOE experiments or partially reduced for STD experiments (ca. 10% reduced protein, obtained by addition of a suitable substoichometric amount of sodium ascorbate). All these spectra were acquired using the reported experimental scheme,50 irradiating the signal of interest for ca. 50 ms at a power of ca. 5 mW. The relaxation delay was set to ca. 10 ms.
Carbon-13 detected spectra were acquired with a broad-band observe (BBO) probehead tuned at the proper frequency, using an excitation pulse of 6.9 μs at 88.67 W. Inverse gated decoupling was applied during acquisition of 13C spectra. For 13C experiments, the carrier frequency was set to 800, 300, or -500 ppm depending on which signals were being studied at the moment. The spectral window and delays also varied in each experiment, resulting in total recycle times of ca. 35 ms for the acquisition of signals around 800 and -500 ppm, and ca. 300 ms for those near the diamagnetic region. No further signals were detected when the carrier was moved to different frequency offsets.
STD experiments on 13C signals were performed on samples containing ca. 10% reduced protein (obtained by addition of a suitable substoichometric amount of sodium ascorbate). STD spectra were acquired with the same pulse sequence used for protons but adapted to the 13C channel, irradiating during ca. 40 ms at a power of ca. 0.1 - 5 mW. The relaxation delay was set to ca. 10 ms.
Calculation of electron-nuclei coupling constants
The electron-nuclei coupling constant (A/h) for each nucleus can be calculated from the contact shift using the following equation:51,52
| (Eq. 1) |
where γ is the nuclear gyromagnetic ratio, kB is Boltzmann’s constant, g is the average of the g tensor components, μB is the Bohr magneton, S is the electronic spin (1/2 for the oxidized CuA center) and T is the temperature in Kelvin. It should be noted that equation (1) is valid for an isolated spin state.53 This is not the case here and we will use the obtained apparent electron-nuclei coupling constant ((A/h)app) for comparison purposes with similar systems. δcontact is the contact contribution to the chemical shift, which is calculated, in turn, from the observed chemical shift as:
| (Eq. 2) |
In the case of TtCuA, the full assignment of the reduced protein to retrieve the diamagnetic shifts is available (BMRB entry 5819)54, while the pseudocontact shifts can be estimated from EPR data using equation 3:*
| (Eq. 3) |
where μ0 is the vacuum permeability, r is the module of a vector r connecting the nucleus and the averaged coordinates of both copper ions, θ is the angle between the z component of the g tensor and the r vector, and g// and g⊥ are the parallel and perpendicular values of the axial g tensor. The magnetic axes were defined as described by Neese and coworkers35. The other terms were defined in equation 1. The pseudocontact shift proved to be small in all cases (cf. Table 2), as expected.
Table 2.
Analysis of 1H and 13C NMR chemical shifts. Data reported and calculated at 298 K
| Resonance | Signal | δobs (ppm) | δdiamagnetic# (ppm) | δpseudocontact* (ppm) | δcontact* (ppm) | (A/h)app* (MHz) |
|---|---|---|---|---|---|---|
| Cys149 | ||||||
| Cβ | Y | -379.4 | 32.3 | -3.99 | -407.7 | -3.67 |
| Cα | F | 294.6 | 59.9 | -1.38 | 236.1 | 2.12 |
| Hβ | b | 262 | 3.05 | -2.58 | 261.5 | 9.37 |
| Hβ | c | 237 | 3.32 | -2.58 | 236.3 | 8.48 |
| Hα | y | -2.9 | 4.41 | -1.10 | -6.2 | -0.22 |
| CO | I | 151.7 | 176.3 | -1.21 | -23.4 | -0.21 |
| Cys153 | ||||||
| Cβ | Z | -475.3 | 34.5 | -3.4 | -506.4 | -4.56 |
| Cα | A | 880.5 | 56.5 | -1.36 | 825.4 | 7.43 |
| Hβ | a | 283 | 2.89 | -3.26 | 283.4 | 10.15 |
| Hβ | d | 117 | 3.08 | -3.26 | 117.2 | 4.21 |
| Hα | g | 27.55 | 4.54 | -2.6 | 25.6 | 0.92 |
| CO | J | 142.0 | 174.4 | -0.80 | -31.6 | -0.28 |
| His114 | ||||||
| Cε1 | M | 33.9 | 137.9 | -2.06 | -101.9 | -0.92 |
| Cδ2 | C | 353.6 | 120.2 | -0.74 | 234.1 | 2.11 |
| Cγ | E | 312.2 | 135.5 | -1.51 | 178.2 | 1.60 |
| Hδ2 | e | 31.6 | 6.66 | -0.4 | 25.3 | 0.91 |
| Hε2 | h | 24.2 | 11.78 | -0.56 | 13.0 | 0.46 |
| Hε1 | j | 20.7 | 6.97 | -2.19 | 15.9 | 0.57 |
| Gly115 | ||||||
| HN | z | -5.2 | 10.1 | -0.57 | -14.7 | -0.53 |
| His157 | ||||||
| Cε1 | L | 98.4 | 140.6 | -2.23 | -40 | -0.36 |
| Cδ2 | B | 386.2 | 119.0 | -0.86 | 268.1 | 2.41 |
| Cγ | D | 331.2 | 136.5 | -1.75 | 196.4 | 1.77 |
| Hδ2 | f | 27.46 | 7.31 | -0.49 | 20.6 | 0.74 |
| Hε2 | i | 23.2 | 10.0 | -0.61 | 13.8 | 0.49 |
| Hε1 | k | 15.5 | 7.38 | -2.28 | 10.4 | 0.37 |
Taken from the assignment reported for reduced TtCuA in BMRB ID 5819.54
Calculated as indicated in Materials and Methods
Fitting of temperature dependence data
The temperature dependence data were fitted to a two-states model using the program TDFw,40,54 which calculates the contact contribution to the chemical shift for each data point and fits all data at once to the following equation:
| (Eq. 4) |
Fitting the data to this equation yields fk,i, contribution of nucleus k to the contact shift in the state i (i=1 for ground state, i=2 for excited state), and ΔE, the energy gap between the two states.
Results
1H NMR spectra of TtCuA samples produced under various labeling schemes
The 1H NMR spectrum of TtCuA (Figure 1) displays a number of isotropically-shifted signals which can be clustered into two groups on the basis of the extent of the paramagnetic effect they are subject to. The first group includes a set of relatively sharp signals with chemical shifts ranging from 32 to 15 ppm (e - k) and from -3 to -7 ppm (y, z). The second group includes four broad signals with chemical shifts between ca. 300 and 110 ppm (a - d). This spectrum, already reported and partially assigned by Bertini and coworkers,30 exhibits the same pattern of 1H signals observed for all studied CuA-containing proteins.26-31
Based on their NOE patterns and their distinct solvent exchange properties, signals e, f, h, j and k had been unambiguously assigned to specific protons from the imidazole rings of His114 and His157.30 Resonances a-d had been assigned to the β-CH2 moieties of the Cys ligands, based on their large chemical shifts and line widths30 (and later on confirmed by selective deuteration of the Cys ligands).29 Resonance g had been attributed to one of the two α-CH Cys based on the unusual temperature dependence of its chemical shift. The sequence specific assignment of all the identified cysteines’ signals, as well as the identification of the second α-CH Cys, had not been obtained at that time based on the 1H NMR data available. The upfield resonances y and z (the latter slowly exchangeable with solvent) remained unassigned as well.
Figure 2 shows the 35 to -10 ppm region of the 1H NMR spectra of TtCuA samples obtained by using different labeling schemes. As these resonances are relatively sharp, heteronuclear 1H, 13C and 1H, 15N splittings could be measured. The splittings observed for resonances e, f, h, j, and k in the 13C, 15N and 15N labeled samples (Figure 2A and 2B, respectively) provide further confirmation of their assignment. The broadening experienced by signals g and y in the selectively 13C, 15N labeled Cys sample supports the assignment of the former as a Cys Hα (Suppl. Figure S1) and reveals that the latter is also due to a carbon-bound Cys proton, most likely the other Cys Hα.
Figure 2.
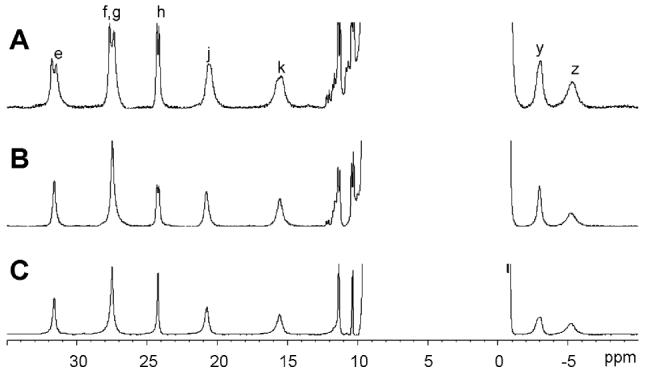
1H NMR spectra of TtCuA uniformly labeled with 13C and 15N (A), uniformly labeled with 15N (B) and doubly-labeled at Cys (C), registered at 298 K.
Direct and Inverse Detection Heteronuclear Experiments and Assignment of 13C NMR signals
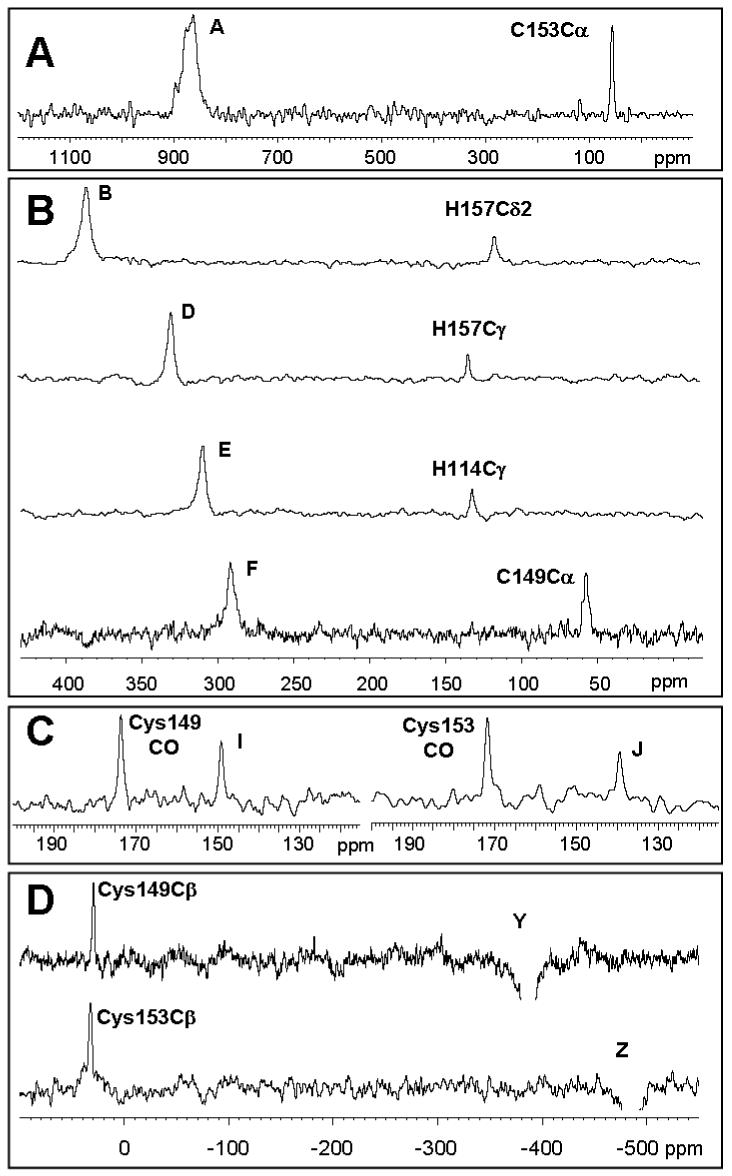
A number of paramagnetically-shifted 13C signals spanning a chemical shift range of 1,400 ppm (from ca. 900 to -500 ppm) were observed in the spectrum recorded with the 13C, 15N-uniformly labeled sample (Figure 3A, B, D). In order to optimize detection of the most downfield (A) and most upfield (Y, Z) shifted resonances, spectra were recorded with frequency offsets located close to the signals of interest, as described in the caption of Figure 3. Instead, resonances in the 400 - 0 ppm regions could be detected with the frequency offset located at 300 ppm.
Figure 3.

13C NMR spectra of TtCuA labeled at Cys (A, B, C) and of uniformly labeled TtCuA (D) recorded at 298 K. The spectrum where signal A is seen (A) was acquired with the offset of the carbon channel set at 800 ppm and processed with 800 Hz line broadening. The spectrum showing signals Y and Z (B) was acquired with the offset at -500 ppm and processed with 1000 Hz of line broadening. Spectra spanning from 400 to -10 ppm (C, D) were acquired with the offset at 300 ppm and processed with 100 Hz line broadening.
Carbon-13 spectra recorded on the 13C, 15N selectively labeled Cys sample revealed the presence of the hyperfine-shifted signals A, F, Y and Z, in addition to a group of eight resonances in the diamagnetic region (Figure 3C), which were not resolved in the spectrum of a fully-labeled sample. Six of these signals were already assigned to 13C nuclei from the Cys ligands in the reduced form.3 Signals I and J remained unassigned at this stage, and may be attributed to signals of the oxidized species.
A 1H, 13C HMQC spectrum performed on the uniformly labeled sample, recorded under conditions tailored to detect the heteronuclear coherences corresponding to paramagnetic signals (Suppl. Figure S2), allowed us to assign signal B to the Cδ2 of His157 (correlating with the proton signal f), signal C to the Cδ2 of His114 (correlating with e) and signal F to the Cys149 Cα (correlating with y). This HMQC also allowed us to resolve the 13C signals L and M which were hidden in the diamagnetic envelope in the 1D 13C NMR spectrum, and to assign them to the His157 Cε1 (L, connected to k) and His114 Cε1 (M, connected to j). These correlations were further verified by recording 1D 1H experiments in which each of the 13C signals was selectively irradiated, and monitoring the collapse of the doublet in the 1H spectrum (Suppl. Figure S3).
In order to complete the assignment of the signals resolved in the 13C spectrum we recorded a series of 1D Saturation Transfer Difference (STD) experiments. Saturation of signal D gives a response in the diamagnetic region at 136.5 ppm, which corresponds to His157Cγ; while saturation of signal E shows transfer to a signal at 135.5 ppm due to His114Cγ. Irradiation of signals A and F resulted in saturation transfer to signals at 56.5 and 59.9 ppm, which correspond to Cys153Cα and Cys149Cα, respectively. Finally, saturation transfer experiments performed on signals Y and Z yielded responses at 32.3 and 34.5 ppm, which arise from Cys149Cβ and Cys153Cβ, respectively. The STD experiments aimed at the assignment of signals I and J were performed on the sample selectively labeled at Cys, and demonstrate that these signals correspond to Cys149CO and J to Cys153CO in the oxidized form, respectively.
This combination of direct and inverse 13C experiments allowed us to complete the assignment of the 13C resonances of the two His and the two Cys residues, including the quaternary carbons from the imidazole rings and those bound to protons giving broad signals such as the Cys’ Cβs. The assignment of all 13C resonances is summarized in Table 1, together with the relaxation times and the temperature dependence of their chemical shifts.
Table 1.
Assignment of 1H, 13C and 15N resonances of oxidized TtCuA. Observed chemical shifts, line widths, and temperature dependence are reported at 298 K
| Signal | δobs (ppm) | Line Width (Hz) | Temperature dependence | Assignment | |
|---|---|---|---|---|---|
| 13C | A | 881 | 3900 | Hyper-Curie | Cys153Cα |
| B | 386.2 | 576 | Hyper-Curie | His157Cδ2 | |
| C | 353.6 | 772 | Hyper-Curie | His114Cδ2 | |
| D | 331.2 | 380 | Curie | His157Cγ | |
| E | 312.2 | 340 | Hypo-Curie | His114Cγ | |
| F | 294.6 | 728 | Anti-Curie | Cys149Cα | |
| I | 151.7 | 103 | Hyper-Curie | Cys149CO | |
| J | 142.0 | 63 | Hyper-Curie | Cys153CO | |
| L | 98.4 | 223 | Hypo-Curie | His157Cε1 | |
| M | 33.9 | ND | ND | His114Cε1 | |
| Y | -379 | 1800 | Hypo-Curie | Cys149Cβ | |
| Z | -475 | 2500 | Hypo-Curie | Cys153Cβ | |
| 1H | a | 283 | 7200 | Hyper-Curie | Cys153Hβ |
| b | 262 | 5300 | Hypo-Curie | Cys149Hβ | |
| c | 237 | 5900 | Hyper-Curie | Cys149Hβ | |
| d | 117 | 3100 | Anti-Curie | Cys153Hβ | |
| e | 31.6 | 114 | Curie | His114Hδ2 | |
| f | 27.46 | ND | Hyper-Curie | His157Hδ2 | |
| g | 27.55 | ND | T-independent | Cys153Hα | |
| h | 24.2 | 52 | Curie | His114Hε2 | |
| i* | 23.2 | 170 | Curie | His157Hε2 | |
| j | 20.7 | 165 | Hyper-Curie | His114Hε1 | |
| k | 15.5 | 210 | Hyper-Curie | His157Hε1 | |
| y | -2.9 | 144 | Hyper-Curie | Cys149Hα | |
| z | -5.2 | 374 | Curie | Gly115HN | |
Signal i is observed at low pH and temperatures.
Sequence-Specific Assignment of 1H Resonances
The 13C saturation transfer experiments described in the previous section reveal that the most downfield shifted signal, A, corresponds to the Cys153Cα, while signal F is due to the Cys149Cα. A cross peak between signals F and y in the HMQC spectrum (Suppl. Figure S2) allows us to unambiguously assign signal y to the Hα of Cys149. Based on its unusual temperature dependence, Bertini et al. tentatively assigned signal g to the Hα of a Cys ligand.30 The absence of any correlation for that signal in the 1H, 13C HMQC spectrum led us to record 13C-filtered 1H experiments on the sample selectively labeled at the Cys residues with the offset of the 13C channel set close to the shifted resonance (Suppl. Figure S4). When the 13C offset was set at 800 ppm (signal A), only signal g was found in the 1H spectrum. Instead, when the 13C offset was located at 300 ppm (signal F), only signal y was detected. These experiments thus permit to assign signal y to Cys149Hα, and to confirm the assignment of resonance g to Cys153Hα.
Assignment of the broad resonances a-d (in the 290 to 115 ppm region, Figure 1) arising from the Hβ protons of the cysteines to either Cys153 or Cys149 could be pursued by using a combined strategy. A series of NOE experiments were performed on these resonances on a fully oxidized sample. These experiments show that signals a and d both present a common NOE with signal g (Cys153Hα), suggesting that signals a and d arise from the β protons of Cys153. Instead, signals b and c share an NOE with signal y (Cys149Hα) (Suppl. Figure S5), allowing us to assign b and c to the Hβs of Cys149. These assignments were further confirmed by carrying out a series of STD 1H experiments on resonances a-d in a sample partially reduced with ascorbate (Suppl. Figure S6), based on the 1H assignments on the reduced protein.
The 1H NMR spectra of oxidized CuA centers present an upfield-shifted signal around -5 to -10 ppm, broader than any other signal in the 35 to -10 ppm range. This resonance exchanges very slowly in D2O, suggesting that it corresponds to a proton involved in a strong hydrogen bond. In order to assign signal z, we performed a STD experiment on a partially reduced sample. This experiment yielded a response at 10.1 ppm (Suppl. Fig. 7), which corresponds to the backbone HN of Gly115 in the reduced protein. Inspection of the TtCuA site (PDB ID 2cua) shows that this HN is involved in a hydrogen bond with the S atom of Cys149, suggesting the presence of unpaired spin density transmitted through hydrogen bonds (Figure 1A).
Temperature dependence of the chemical shifts
A study of the temperature dependence of the chemical shifts was performed on all assigned 1H and 13C signals, working in the temperature range between 278 and 318 K. A fit of chemical shifts vs. inverse temperature for each resonance to a linear equation provides a qualitative way to classify the trends as Curie, hyper-Curie, hypo-Curie or T-independent, depending on the intercept and slope of the δ vs. 1/T plot.39 Almost none of the signals shows Curie behavior and, as pointed out previously,27,30,31 this can be attributed to the presence of a low lying exicted state which is populated at room temperature. The temperature dependence data were fitted to a two-state model using the program TDFw, by Shokhirev and Walker.40 The energy gap between the ground and excited states resulted 600 ± 200 cm-1, with a variability of less than 10% when the calculation was performed by excluding any one of the resonances from the input data, supporting the robustness of the fit. We observed that, when only 1H signals were used as input data, it was hard to achieve convergence, and the resulting parameters were highly variable.
Discussion
The analysis of NMR data arising from nuclei close to paramagnetic centers is of paramount importance as it yields valuable information about its electronic structure, complementing data available from EPR, ENDOR and other spectroscopic techniques.51,55 Usually, one main limitation to such studies is the excessive line broadening experienced by signals arising from nuclei that are too close to the paramagnetic center. Since broadening decreases with the square of the gyromagnetic ratio of the involved nucleus, the use of heteronuclei has been of great help for paramagnetic systems and large proteins.51,56-62 Indeed, 13C direct detection allowed us to observe all the resonances of 13C nuclei from the metal ligands in TtCuA, even for those nuclei which are only two bonds away from the copper ions and contain a high degree of unpaired spin density, such as the Cys Cβs. No hyperfine-shifted 13C resonances corresponding to the weak axial ligands Met160 and Gln151 were observed, in agreement with 1H NMR data.26-31,63
We have shown that STD experiments on 13C spectra are useful to obtain unambiguous assignments of the hyperfine shifted resonances, provided the assignments of the corresponding diamagnetic signals are available. We have also exploited the assignment of paramagnetic 13C resonances to unambiguously assess the identity of paramagnetic 1H signals through 1H, 13C-HMQC and 13C-edited 1H spectra. By using this approach we achieved a full assignment of the paramagnetic 1H and 13C spectra of TtCuA. This includes the sequence-specific assignment of the Cys resonances, despite their extremely broad line widths.
The chemical shifts of resonances assigned to ligand nuclei in the paramagnetic species contain information about the degree of unpaired spin density delocalized onto the observed nuclei.55,64 Table 2 reports the observed chemical shifts, and the calculated apparent hyperfine coupling constant (A/h)app for each nucleus (see Material and Methods). These data further confirm the high degree of delocalization of the electron spin density on the Cys ligands of the TtCuA site. Analysis of the 13C resonances shows sign alternation in the (A/h)app value for the three carbon nuclei in both Cys ligands, revealing the existence of spin polarization. This phenomenon was also observed for the Cys ligands in Fe(II) rubredoxin by Markley and coworkers.56 The 1H and 13C line widths show a good correlation with (A/h)app2, while the correlation with r-6 is poor. This confirms that relaxation is mostly governed by a contact mechanism, as also reported for Cu(II) blue copper proteins.65
The availability of the (A/h)app for all 13C and 1H nuclei from the Cys ligands allows us to estimate the spin density on each residue. Despite spin polarization effects preclude obtaining a precise figure,64 it is evident that Cys153 bears a larger electron spin density compared to Cys149 (Table II). The available high resolution structures of CuA sites reveal some variability in the Cu-S distances (2.25-2.47 Ǻ) within each protein,7,66,67 in agreement with the unusually large Debye-Waller terms from EXAFS data.21 However, none of these techniques is able to provide evidence for a stronger interaction with one particular Cys ligand, as we show here. The finding of net electron spin density on the NH from Gly115 (displaying an (A/h)app of -0.53 MHz), arising from a hydrogen bond between this moiety and the S atom of Cys149, may account for this difference, since the S atom of Cys153 is not involved in any hydrogen bond. Inspection of the reported X-ray structures7,68-70 reveals that this hydrogen bond (between Cys149 and the residue adjacent to the N-terminal His ligand) is conserved in all structurally characterized native CuA centers, including CcOs and N2O reductases, thus implying to be an essential structural feature. This situation resembles the H-bond between a highly conserved Asn residue and the Cys ligand in blue copper proteins. For blue copper proteins, the A/h value for this NH ranges between -0.8 and -1.3 MHz, which has been shown to reflect the electron spin density on the sulfur atom of the Cys residue, on its turn modulated by the interaction with the axial ligand and/or the geometry of the metal center.31,65,71-73 The herein reported value of -0.53 MHz is in agreement with the observation that both Cys ligands in CuA sites bear an electron spin density half of that observed for Cu(II)-bound Cys residues in type I centers.
This conserved hydrogen bond is formed with a peptide NH group, thus it is not possible to remove it by site-directed mutagenesis. However, inspection of the structural data of engineered CuA sites aids in assessing its role. Loop-directed mutagenesis has been employed to engineer a CuA center into azurin74 and into subunit II of E. coli quinol oxidase (CyoA).75 CuA-azurin, which displays the typical spectral features of delocalized mixed-valence CuA centers, preserves this H-bond,66 while the CyoA center shows some degree of valence localization,34 and lacks this H-bond.75 This H-bond is not located in any of the possible electron transfer pathways in which the CuA center is involved, allowing us to discard a possible role of this moiety in the donor-acceptor coupling. Therefore, we propose that this H-bond is important to maintain the electronic structure (and the mixed-valence nature) of the center, possibly by tuning the redox potential of the metal site, as observed in blue copper and iron-sulfur centers.76-78
Previous NMR studies have indicated the nonequivalence of the two His ligands in CuA sites.26-31,63 Analysis of different high resolution crystal structures of native and engineered CuA centers led Lu and coworkers to propose that the copper-axial ligand distances determine the orientation of the His imidazole rings and therefore the His nonequivalence.66 Now we provide evidence that the Cys ligands are also non equivalent. This piece of evidence cannot be derived from other spectroscopies which cannot distinguish each Cys-Cu bond.
The sequence-specific assignment of all Cys resonances allows us to analyze the angular dependence of their chemical shifts, which are expected to reflect the electron spin density on the sulfur atoms.79,80 The (A/h)app values observed for the four Cys Hβs should follow a sine-squared or cosine-squared relationship with the S-S-Cβ-Hβ dihedral angles, which is not the case here. As already discussed by Salgado, Canters and coworkers, this apparent disagreement can be explained by assuming that NMR is monitoring a temperature-averaged population of two states.27 Here we have resorted to the temperature dependence of the chemical shifts to retrieve information on the excited state,40 based on the complete and unambiguous assignment of the 1H and 13C resonances. In particular, inclusion of the sharper 13C signals in the fit allows a robust data analysis. This resulted in an energy gap of 600 ± 200 cm-1 between the ground state and a temperature-accessible excited state, in agreement with previous estimates.27 From this value, a population of 2 - 12.5% is expected for the excited state at room temperature, and 3.2-15.5% at the growth temperature of Thermus thermophilus (341 K).
The σ*u and πu states differ by the involvement of dx2-y2 and dxy orbitals from the copper ions, respectively (Figure 5).27 Thus, the angular dependence of the A/h values with the S-S-Cβ-Hβ dihedral angles should follow a sine-squared dependence for the σ*u state, and a cosine-squared dependence for the πu level. Analysis of the A/h values estimated for the ground state and the excited state for the different 1H and 13C resonances (Suppl. Table 1) confirms that the room temperature electronic structure of the CuA center is a thermal average of a σ*u ground state and a πu excited state, and accounts for the anomalous temperature dependence of the hyperfine shifts. For instance, in Cys149, the sulfur px orbital in the ground state lays almost perpendicular to the Cβ-Cα bond, while in the excited state this bond and the contributing sulfur py orbital are almost collinear. Therefore, the 13C nucleus (signal F) in the πu level is expected to experience a much larger electron spin density than in the σ*u state, thus higher temperatures lead to higher δcon shifts, inducing a markedly anti-Curie behavior. For the Cα of Cys153 (signal A), the reversal situation is met, resulting in a hyper-Curie behavior. The same reasoning applies to the 1H resonances if we consider the sequence-specific assignment here reported. The chemical shifts of the β 13C resonances should not be affected by this angular component, in agreement with the similar A/h values estimated for the ground and excited state. Overall, these data unequivocally confirm that the excited state populated at room temperature is a πu.
Figure 5. Schematic representation of the AO involved in the σ*u and πu states.

The d orbitals from the copper ions and the p orbitals from the S atoms are shown. Labels correspond to NMR resonances, as detailed in Table 1.
Neese and coworkers provided the first experimental evidence of a σ*u ground state for CuA sites,34,35 later supported by further spectroscopic data and theoretical calculations.17,19,33 Solomon and coworkers have proposed that this state is stabilized by the protein environment, resulting in a short Cu-Cu distance (2.4-2.6 Ǻ).33 Instead, the mixed valence compound synthesized by the Tolman group displays a πu ground state, dictated by its longer Cu-Cu distance (3.0 Ǻ).19 Solomon has recently proposed that the thermal equilibrium between the σ*u and πu levels which accounts for the NMR data takes place along an almost flat energy surface, where the Cu-Cu distance is expected to undergo a variation of 0.5 Ǻ.33 The observation of a single NMR line for all 1H and 13C resonances in all CuA sites at different magnetic fields suggests that the equilibrium between these two states is fast on the NMR time scale. The chemical shift differences estimated for 1H nuclei in both states are as high as 2,000 ppm (Suppl. Table 1), which suggests a lower limit of 1.2×10⁶ s-1 for the exchange rate. These rates (despite small for vibrational frequencies) seem unlikely for a change in the Cu-Cu distance of 0.5 Ǻ. We therefore favor an alternative interpretation: different theoretical calculations have revealed that small changes in the Cu-Cu distance in CuA sites strongly affects the energy gap between these two levels.19,36,81 A slightly longer Cu-Cu distance (2.6-2.7 Ǻ), which may be achieved at room temperature, is consistent with a σ*u / πu energy gap close to the value here determined. EXAFS data have revealed a significant increase in the Cu-Cu Debye-Waller terms in spectra recorded at higher temperatures,21 in agreement with this proposal. Therefore, EPR and NMR data can be reconciled by assuming a decrease in this energy difference from 3,500-5,000 cm-1 at cryogenic temperatures to a value of 600 cm-1 at room temperature, induced by a minor geometric change in the Cu2S2 core.
Recent NMR studies37,38 have highlighted the role of thermally populated (from 0.5 to 10%), “invisible” excited states of proteins at room temperature, which may play a role in enzyme catalysis, ligand binding and protein folding. The precise characterization of a low-lying excited state which contributes to the electronic structure of the CuA site suggests that this state may also play a role in electron transfer.
Supplementary Material
Figure 4.
Saturation Transfer Difference spectra obtained by irradiation of 13C resonances A (panel A), B, D, E, F (panel B), Y and Z (panel D) on a fully-labeled sample, and I and J (panel C) on a sample labeled at the cysteine residues. Experiments performed at 298 K.
Acknowledgements
LAA and GRL thank CONICET for doctoral and postdoctoral fellowships, respectively. AJV is a staff member from CONICET and an HHMI International Research Scholar. This work was supported by the US National Institutes of Health (R01-GM068682) and Agencia Nacional de Promoción Científica y Tecnológica (PICT2002-01-11625) grants to AJV. This work has been supported in part by the EC contracts EU-NMR (n° 026145) and SPINE II (n° 031220) and by Ente Cassa di Risparmio di Firenze. The Bruker Avance II 600 MHz NMR spectrometer at Rosario was purchased with funds from ANPCyT (PME2003-0026) and CONICET. We thank Prof. John Markley for kindly providing us the E. coli JM15 (DE3) pLysS cells and Prof. Ivano Bertini for the stimulating discussions.
Footnotes
Strictly speaking it would be appropiate to use the principal components of the molecular susceptibility tensor χ instead of the components of the g tensor; however, this approximation is acceptable for null or small spin-orbit coupling.
References
- 1.Ferguson-Miller S, Babcock GT. Chem. Rev. 1996;96:2889–2907. doi: 10.1021/cr950051s. [DOI] [PubMed] [Google Scholar]
- 2.Wikstrom M. Biochim. Biophys. Acta. 2004;1655:241–247. doi: 10.1016/j.bbabio.2003.07.013. [DOI] [PubMed] [Google Scholar]
- 3.Muresanu L, Pristovsek P, Lohr F, Maneg O, Mukrasch MD, Ruterjans H, Ludwig B, Lucke C. J Biol. Chem. 2006;281:14503–14513. doi: 10.1074/jbc.M601108200. [DOI] [PubMed] [Google Scholar]
- 4.Maneg O, Ludwig B, Malatesta F. J. Biol. Chem. 2003;278:46734–46740. doi: 10.1074/jbc.M307594200. [DOI] [PubMed] [Google Scholar]
- 5.Abriata LA, Banci L, Bertini I, Ciofi-Baffoni S, Gkazonis P, Spyroulias GA, Vila AJ, Wang S. Nat. Chem. Biol. 2008;4:599–601. doi: 10.1038/nchembio.110. [DOI] [PMC free article] [PubMed] [Google Scholar]
- 6.Beinert H. Eur. J. Biochem. 1997;245:521–532. doi: 10.1111/j.1432-1033.1997.t01-1-00521.x. [DOI] [PubMed] [Google Scholar]
- 7.Williams PA, Blackburn NJ, Sanders D, Bellamy H, Stura EA, Fee JA, McRee DE. Nat Struct Biol. 1999;6:509–516. doi: 10.1038/9274. [DOI] [PubMed] [Google Scholar]
- 8.Soulimane T, Buse G, Bourenkov GP, Bartunik HD, Huber R, Than ME. EMBO J. 2000;19:1766–1776. doi: 10.1093/emboj/19.8.1766. [DOI] [PMC free article] [PubMed] [Google Scholar]
- 9.Tsukihara T, Aoyama H, Yamashita E, Tomizaki T, Yamaguchi H, Shinzawa-Itoh K, Nakashima R, Yaono R, Yoshikawa S. Science. 1996;272:1136–1144. doi: 10.1126/science.272.5265.1136. [DOI] [PubMed] [Google Scholar]
- 10.Iwata S, Ostermeier C, Ludwig B, Michel H. Nature. 1995;376:660–669. doi: 10.1038/376660a0. [DOI] [PubMed] [Google Scholar]
- 11.Farver O, Hwang HJ, Lu Y, Pecht I. J Phys. Chem B. 2007;111:6690–6694. doi: 10.1021/jp0672555. [DOI] [PubMed] [Google Scholar]
- 12.Farver O, Lu Y, Ang MC, Pecht I. Proc. Natl. Acad. Sci. U. S. A. 1999;96:899–902. doi: 10.1073/pnas.96.3.899. [DOI] [PMC free article] [PubMed] [Google Scholar]
- 13.Solomon EI, Xie X, Dey A. Chem. Soc. Rev. 2008;37:623–638. doi: 10.1039/b714577m. [DOI] [PubMed] [Google Scholar]
- 14.Randall DW, Gamelin DR, LaCroix LB, Solomon EI. J. Biol. Inorg. Chem. 2000;5:16–29. doi: 10.1007/s007750050003. [DOI] [PubMed] [Google Scholar]
- 15.Kroneck PM, Antholine WE, Kastrau DH, Buse G, Steffens GC, Zumft WG. FEBS Lett. 1990;268:274–276. doi: 10.1016/0014-5793(90)81026-k. [DOI] [PubMed] [Google Scholar]
- 16.Kroneck PMH, Antholine WE, Riester J, Zumft WG. FEBS Lett. 1988;242:70–74. doi: 10.1016/0014-5793(88)80987-6. [DOI] [PubMed] [Google Scholar]
- 17.de Beer S, Markus M, Wang H, Wang H, Cramer SP, Lu Y, Tolman WB, Hedman B, Hodgson KO, Solomon EI. J. Am. Chem. Soc. 2001;123:5757–5767. doi: 10.1021/ja004109i. [DOI] [PubMed] [Google Scholar]
- 18.Antholine WE, Kastrau DHW, Steffens GCM, Buse G, Zumft WG, Kroneck PMH. Eur. J. Biochem. 1992;209:875–881. doi: 10.1111/j.1432-1033.1992.tb17360.x. [DOI] [PubMed] [Google Scholar]
- 19.Gamelin DR, Randall DW, Hay MT, Houser RP, Mulder TC, Canters GW, De Vries S, Tolman WB, Solomon EI. J. Am. Chem. Soc. 1998;120:5246–5263. [Google Scholar]
- 20.Williams KR, Gamelin DR, LaCroix LB, Houser RP, Tolman WB, Mulder TC, De Vries S, Hedman B, Hodgson KO, Solomon EI. J. Am. Chem. Soc. 1997;119:613–614. [Google Scholar]
- 21.Blackburn NJ, De Vries S, Barr ME, Houser RP, Tolman WB, Sanders D, Fee JA. J.Am.Chem.Soc. 1997;119:6135–6143. [Google Scholar]
- 22.Blackburn NJ, Barr ME, Woodruff WH, van der Oost J, De Vries S. Biochemistry. 1994;33:10401–10407. doi: 10.1021/bi00200a022. [DOI] [PubMed] [Google Scholar]
- 23.Gurbiel RJ, Fann YC, Surerus KK, Werst MM, Musser SM, Doan PE, Chan SI, Fee JA, Hoffman BM. J. Am. Chem. Soc. 1993;115:10888–10894. [Google Scholar]
- 24.Epel B, Slutter CS, Neese F, Kroneck PM, Zumft WG, Pecht I, Farver O, Lu Y, Goldfarb D. J. Am. Chem Soc. 2002;124:8152–8162. doi: 10.1021/ja012514j. [DOI] [PubMed] [Google Scholar]
- 25.Slutter CE, Gromov I, Epel B, Pecht I, Richards JH, Goldfarb D. J. Am. Chem. Soc. 2001;123:5325–5332. doi: 10.1021/ja003924v. [DOI] [PubMed] [Google Scholar]
- 26.Holz RC, Alvarez ML, Zumft WG, Dooley DM. Biochemistry. 1999;38:11164–11171. doi: 10.1021/bi990595e. [DOI] [PubMed] [Google Scholar]
- 27.Salgado J, Warmerdam GC, Bubacco L, Canters GW. Biochemistry. 1998;37:7378–7389. doi: 10.1021/bi9728598. [DOI] [PubMed] [Google Scholar]
- 28.Dennison C, Berg A, Canters GW. Biochemistry. 1997;36:3262–3269. doi: 10.1021/bi961960u. [DOI] [PubMed] [Google Scholar]
- 29.Luchinat C, Soriano A, Djinovic K, Saraste M, Malmström BG, Bertini I. J. Am. Chem. Soc. 1997;119:11023–11027. [Google Scholar]
- 30.Bertini I, Bren KL, Clemente A, Fee JA, Gray HB, Luchinat C, Malmström BG, Richards JH, Sanders D, Slutter CE. J. Am. Chem. Soc. 1996;118:11658–11659. [Google Scholar]
- 31.Fernandez CO, Cricco JA, Slutter CE, Richards JH, Gray HB, Vila AJ. J. Am. Chem. Soc. 2001;123:11678–11685. doi: 10.1021/ja0162515. [DOI] [PubMed] [Google Scholar]
- 32.Xie X, Gorelsky SI, Sarangi R, Garner DK, Hwang HJ, Hodgson KO, Hedman B, Lu Y, Solomon EI. J. Am. Chem. Soc. 2008;130:5194–5205. doi: 10.1021/ja7102668. [DOI] [PubMed] [Google Scholar]
- 33.Gorelsky SI, Xie X, Chen Y, Fee JA, Solomon EI. J. Am. Chem. Soc. 2006;128:16452–16453. doi: 10.1021/ja067583i. [DOI] [PubMed] [Google Scholar]
- 34.Farrar JA, Neese F, Lappalainen P, Kroneck PMH, Saraste M, Zumft WG, Thompson AJ. J. Am. Chem. Soc. 1996;118:11501–11514. [Google Scholar]
- 35.Neese F, Zumft WG, Antholine WA, Kroneck PMH. J. Am. Chem. Soc. 1996;118:8692–8699. [Google Scholar]
- 36.Olsson MH, Ryde U. J. Am. Chem Soc. 2001;123:7866–7876. doi: 10.1021/ja010315u. [DOI] [PubMed] [Google Scholar]
- 37.Korzhnev DM, Kay LE. Acc. Chem. Res. 2008;41:442–451. doi: 10.1021/ar700189y. [DOI] [PubMed] [Google Scholar]
- 38.Boehr DD, McElheny D, Dyson HJ, Wright PE. Science. 2006;313:1638–1642. doi: 10.1126/science.1130258. [DOI] [PubMed] [Google Scholar]
- 39.Banci L, Bertini I, Luchinat C, Pierattelli R, Shokhirev NV, Walker FA. J. Am. Chem. Soc. 1998;120:8472–8279. [Google Scholar]
- 40.Shokhirev NV, Walker FA. J. Phys. Chem. 1995;99:17795–17804. [Google Scholar]
- 41.Banci L, Bertini I, Luchinat C. Struct. Bonding. 1990;72:113–135. [Google Scholar]
- 42.Tepper AW, Bubacco L, Canters GW. Chemistry. 2006;12:7668–7675. doi: 10.1002/chem.200501494. [DOI] [PubMed] [Google Scholar]
- 43.Bubacco L, Salgado J, Tepper AW, Vijgenboom E, Canters GW. FEBS Lett. 1999;442:215–220. doi: 10.1016/s0014-5793(98)01662-7. [DOI] [PubMed] [Google Scholar]
- 44.Murthy NN, Karlin KD, Bertini I, Luchinat C. J.Am.Chem.Soc. 1997;119:2156–2162. [Google Scholar]
- 45.Cheng H, Westler WM, Xia B, Oh B-H, Markley JL. Arch.Biochem.Biophys. 1995;316:619–634. doi: 10.1006/abbi.1995.1082. [DOI] [PubMed] [Google Scholar]
- 46.Bertini I, Jonsson B-H, Luchinat C, Pierattelli R, Vila AJ. J. Magn. Reson., Series B. 1994;104:230–239. doi: 10.1006/jmrb.1994.1080. [DOI] [PubMed] [Google Scholar]
- 47.Slutter CE, Sanders D, Wittung P, Malmström BG, Aasa R, Richards JH, Gray HB, Fee JA. Biochemistry. 1996;35:3387–3395. doi: 10.1021/bi9525839. [DOI] [PubMed] [Google Scholar]
- 48.Inubushi T, Becker ED. J. Magn. Reson. 1983;51:128–133. [Google Scholar]
- 49.Banci L, Bertini I, Pierattelli R, Vila AJ. Inorg. Chem. 1994;33:4338–4343. [Google Scholar]
- 50.Banci L, Bertini I, Luchinat C, Piccioli M, Scozzafava A, Turano P. Inorg. Chem. 1989;28:4650–4656. [Google Scholar]
- 51.Bertini I, Luchinat C. NMR of Paramagnetic Substances. Elsevier; Amsterdam: 1996. [Google Scholar]
- 52.McConnell HM, Chesnut DB. J. Chem. Phys. 1958;28:107–117. [Google Scholar]
- 53.Kurland RJ, McGarvey BR. J. Magn. Reson. 1970;2:286–301. [Google Scholar]
- 54.Mukrasch MD, Lucke C, Lohr F, Maneg O, Ludwig B, Ruterjans H. J. Biomol. NMR. 2004;28:297–298. doi: 10.1023/B:JNMR.0000013687.83263.b5. [DOI] [PubMed] [Google Scholar]
- 55.Bertini I, Turano P, Vila AJ. Chem. Rev. 1993;93:2833–2932. [Google Scholar]
- 56.Machonkin TE, Westler WM, Markley JL. Inorg. Chem. 2005;44:779–797. doi: 10.1021/ic048624j. [DOI] [PubMed] [Google Scholar]
- 57.Xia B, Wilkens SJ, Westler WM, Markley JL. J. Am. Chem Soc. 1998;120:4893–4894. [Google Scholar]
- 58.Xia B, Westler WM, Cheng H, Meyer J, Moulis J-M, Markley JL. J. Am. Chem. Soc. 1995;117:5347–5350. [Google Scholar]
- 59.Bermel W, Bertini I, Felli IC, Kummerle R, Pierattelli R. J. Am. Chem. Soc. 2003;125:16423–16429. doi: 10.1021/ja037676p. [DOI] [PubMed] [Google Scholar]
- 60.Bertini I, Felli IC, Luchinat C, Parigi G, Pierattelli R. Chembiochem. 2007;8:1422–1429. doi: 10.1002/cbic.200700006. [DOI] [PubMed] [Google Scholar]
- 61.Bermel W, Bertini I, Felli IC, Matzapetakis M, Pierattelli R, Theil EC, Turano P. J. Magn Reson. 2007;188:301–310. doi: 10.1016/j.jmr.2007.07.004. [DOI] [PubMed] [Google Scholar]
- 62.Bermel W, Bertini I, Felli I, Piccioli M, Pierattelli R. Progr. Nucl. Magn. Reson. Spectrosc. 2006;48:25–45. [Google Scholar]
- 63.Dennison C, Berg A, De Vries S, Canters GW. FEBS Lett. 1996;394:340–344. doi: 10.1016/0014-5793(96)00981-7. [DOI] [PubMed] [Google Scholar]
- 64.Bertini I, Luchinat C. NMR of Paramagnetic Molecules in Biological Systems. Benjamin/Cummings; Menlo Park, CA: 1986. [Google Scholar]
- 65.Bertini I, Ciurli S, Dikiy A, Gasanov R, Luchinat C, Martini G, Safarov N. J. Am. Chem. Soc. 1999;121:2037–2046. [Google Scholar]
- 66.Robinson H, Ang MC, Gao YG, Hay MT, Lu Y, Wang AH. Biochemistry. 1999;38:5677–5683. doi: 10.1021/bi9901634. [DOI] [PubMed] [Google Scholar]
- 67.Brown K, Djinovic-Carugo K, Haltia T, Cabrito I, Saraste M, Moura JJ, Moura I, Tegoni M, Cambillau C. J. Biol. Chem. 2000;275:41133–41136. doi: 10.1074/jbc.M008617200. [DOI] [PubMed] [Google Scholar]
- 68.Iwata S, Ostermeier C, Ludwig B, Michel H. Nature. 1995;376:660–667. doi: 10.1038/376660a0. [DOI] [PubMed] [Google Scholar]
- 69.Qin L, Hiser C, Mulichak A, Garavito RM, Ferguson-Miller S. Proc. Natl. Acad. Sci. U. S. A. 2006;103:16117–16122. doi: 10.1073/pnas.0606149103. [DOI] [PMC free article] [PubMed] [Google Scholar]
- 70.Brown K, Tegoni M, Prudencio M, Pereira AS, Besson S, Moura JJ, Moura I, Cambillau C. Nat. Struct. Biol. 2000;7:191–195. doi: 10.1038/73288. [DOI] [PubMed] [Google Scholar]
- 71.Donaire A, Jimenez B, Fernandez CO, Pierattelli R, Kohzuma T, Moratal JM, Hall JF, Kohzuma T, Hasnain SS, Vila AJ. J. Am. Chem. Soc. 2002 doi: 10.1021/ja0267019. [DOI] [PubMed] [Google Scholar]
- 72.Bertini I, Ciurli S, Dikiy A, Fernandez CO, Luchinat C, Safarov N, Shumilin S, Vila AJ. J. Am. Chem. Soc. 2001;123:2405–2413. doi: 10.1021/ja0033685. [DOI] [PubMed] [Google Scholar]
- 73.Bertini I, Fernandez CO, Karlsson BG, Leckner J, Luchinat C, Malmström BG, Nersissian AM, Pierattelli R, Shipp E, Valentine JS, Vila AJ. J. Am. Chem. Soc. 2000;122:3701–3707. [Google Scholar]
- 74.Hay M, Richards JH, Lu Y. Proc. Natl. Acad. Sci. U. S. A. 1996;93:461–464. doi: 10.1073/pnas.93.1.461. [DOI] [PMC free article] [PubMed] [Google Scholar]
- 75.Wilmanns M, Lappalainen P, Kelly M, Sauer-Eriksson E, Saraste M. Proc. Natl. Acad. Sci. USA. 1995;92:11955–11959. doi: 10.1073/pnas.92.26.11955. [DOI] [PMC free article] [PubMed] [Google Scholar]
- 76.Hoitink CW, Canters GW. J. Biol. Chem. 1992;267:13836–13842. [PubMed] [Google Scholar]
- 77.Dong S, Ybe JA, Hecht MH, Spiro TG. Biochemistry. 1999;38:3379–3385. doi: 10.1021/bi981999u. [DOI] [PubMed] [Google Scholar]
- 78.Dey A, Jenney FE, Jr., Adams MW, Babini E, Takahashi Y, Fukuyama K, Hodgson KO, Hedman B, Solomon EI. Science. 2007;318:1464–1468. doi: 10.1126/science.1147753. [DOI] [PubMed] [Google Scholar]
- 79.Bertini I, Capozzi F, Luchinat C, Piccioli M, Vila AJ. J. Am. Chem. Soc. 1994;116:651–660. [Google Scholar]
- 80.Bertini I, Donaire A, Feinberg BA, Luchinat C, Piccioli M, Yuan H. Eur. J. Biochem. 1995;232:192–205. doi: 10.1111/j.1432-1033.1995.tb20799.x. [DOI] [PubMed] [Google Scholar]
- 81.Neese F. Ph.D. Dissertation University of Konstanz. 1996. Electronic Structure and Spectroscopy of Novel Copper Chromophores in Biology. [Google Scholar]
Associated Data
This section collects any data citations, data availability statements, or supplementary materials included in this article.