Abstract
We have previously shown that properly designed lysine and valine-rich peptides undergo a random coil to β-hairpin transition followed by intermolecular self-assembly into a fibrillar hydrogel network only after the peptide solutions are heated above the intramolecular folding transition temperature. Here we report that these hydrogels also undergo a stiffening transition as they are cooled below a critical temperature only when boric acid is used to buffer the peptide solution. This stiffening transition is characterized by rheology, dynamic light scattering, and small angle neutron scattering. Rheological measurements show that the stiffening transition causes an increase in the hydrogel storage modulus (G′) by as much as 1 order of magnitude and is completely reversible on subsequently raising the temperature. Although this reversible transition exhibits rheological properties that are similar to polyol/borax solutions, the underlying mechanism does not involve hydroxyl–borate complexation. The stiffening transition is mainly caused by the interactions between lysine and boric acid/borate anion and is not driven by the changes in the secondary structure of the β-hairpin peptide. Addition of glucose to boric acid and peptide solution disrupts the stiffening transition due to competitive glucose–borate complexation.
Introduction
Gelation of biomacromolecules in water has been studied extensively because of its importance in the food and petroleum industries1 as well as for biomedical applications such as tissue engineering2 and drug delivery.3 In addition to covalent crosslinking of biomolecules, gelation can also be achieved through temperature changes that induce secondary structure changes followed by intermolecular association and network formation.1 The intermolecular physical association is driven by molecular forces such as hydrogen bonding, hydrophobic, and van der Waals interactions. Gelation of biopolymers, especially polysac-charides, can also be achieved physically via complexation with mono- or multivalent electrolytes that form ionic bridges between the backbones of the chains.4,5
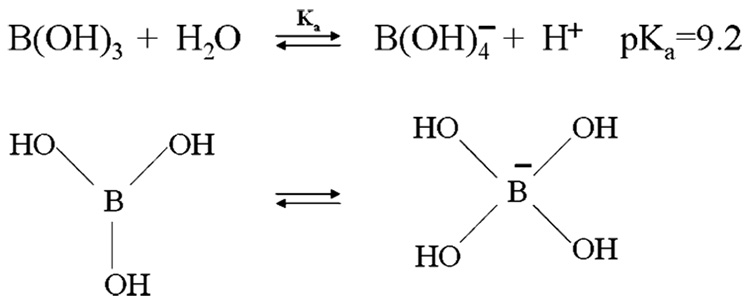
The complexation of borate anions with polysaccharides and polyols in aqueous solutions has been widely studied by rheology,6–12 scattering,13–15 and NMR.16–19 This complexation leads to an increase in the viscosity of the solution due to the formation of physical cross-link points between the hydroxyl groups of the polymer. The industrial and scientific interest in boric acid, B(OH)3 and other related boron containing compounds is diverse ranging from glucose sensors,20,21 supramolecular chemistry,22 and cancer-tumor treatments.23 For example, these molecules have significant roles in some biological processes through complex formation with saccharides, glycoproteins, and proteins.24–27 It has been demonstrated that wounds treated with boric acid solutions exhibit faster healing rates.28 Since 10B, with a 20% natural abundance, has a large neutron absorption cross-section, its related chemical compounds have been used for boron neutron capture therapy (BNCT) for cancer treatments; these compounds are specifically targeted to tumor cells and generate heat after interacting with neutrons to destroy the cell. Boric acid, B(OH)3 with a pKa value of 9.2 and a triganol–planar structure in aqueous solution, is a weak Lewis acid in equilibrium with tetrahedral borate anion B(OH)4−. At low concentrations it is monomeric in aqueous solution but it can also form polyborate species, especially at high concentrations (>0.15 M).29 Figure 1 shows the structures and equilibrium between boric acid and borate anion in aqueous solution. In the studies presented herein, rheological measurements revealed that complexation is favored at basic conditions and, thus, one can assume that borate ion is the reactive species (vide infra). However, some studies have also considered the ability of boric acid to form complexes.11 Since the complexation reaction is exothermic, temperature has drastic effects on the gelation times and viscoelasticity of polymer solutions.6 As discussed later, the rheological behavior of peptide–boric acid solutions shows significant similarities to the borate ion complexation with polyols or polysaccharides.
Figure 1.
Equilibrium between boric acid and borate anion.
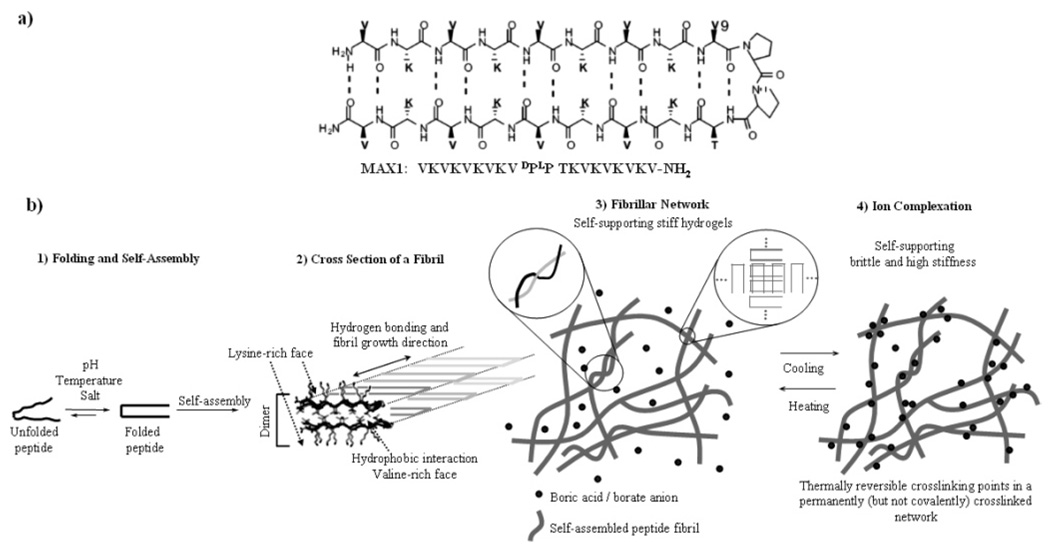
In addition to high molecular weight biomolecules for gel network formation, there has been a recent significant interest in the self-assembly of de-novo-designed, relatively short peptides, not only for materials synthesis such as hydrogels,30–33 templates,34 and coatings,35 but also for model systems to help understand the structure of amyloid-like precipitates that are related to some diseases such as Alzheimer’s.36,37 These amphiphilic peptides can self-assemble via noncovalent interactions into β-sheet rich fibrillar or tubular structures in solution or two-dimensional sheets at interfaces.38–40 We have recently reported that designed peptides known as β-hairpins form hydrogels via self-assembly when the intramolecular randomcoil to β-sheet transition is triggered by pH,41 temperature,42 salt,43 or light.44 For example, the structure of MAX1, a well studied peptide in our labs, and its self-assembly mechanism is given in Figure 2. The peptide is composed of two strands of alternating valine and lysine amino acids flanking a tetrapeptide turn sequence (VDPLPT). Temperature can be used as a folding trigger for MAX 1, and, thus, an intermolecular self-assembly trigger, at basic conditions (~pH 9). When the temperature is raised above the folding transition, hydrophobic interactions drive β-hairpin folding and intermolecular self-assembly into fibrillar nanostructures as shown in Figure 2.15 The fibril cross-section, which is dictated by the strand length of the molecules and is, therefore, monodisperse in diameter,41,43,45 consists of a bilayer of folded peptide with lysines on the periphery exposed to solvent and collapsed hydrophobic valine faces constituting the fibril cores. A network of these fibrillar nanostructures is eventually formed from permanent, but noncovalent, cross-links due to both fibril entanglements as well as self-assembled cross-links where defects in the packing of the valine faces of opposing folded hairpins allow the formation of daughter fibrils that branch from parent fibrils. If the pH of the MAX1 solution is not altered, decreasing the temperature below the original folding transition of the peptide does not induce unfolding and dissolution of the peptide network structure (see Figure 3, vide infra). Moreover, rheological measurements demonstrate that the modulus of the hydrogel is not affected while cooling; the material still preserves its self-supporting, solid-like elastic properties at low temperatures.
Figure 2.
(a) 20 residue primary sequence and proposed β-hairpin secondary structure of MAX1. (b) Conformationally unordered (random-coil) peptide and proposed folding/intermolecular self-assembly pathway of MAX1. The intramolecular folding event is triggered via application of a stimulus resulting in MAX1 folding and consequent self-assembly into β-sheet-rich fibrillar structures. The long axis of the fibrils corresponds to the hydrogen-bonding, β-sheet formation direction. The cross-section of the fibrils are formed via hydrophobic collapse of the valine-rich, hydrophobic face of the folded peptide, and the surface of the fibrils that is exposed to water is covered by lysine residues. Depending on the solution conditions (peptide concentration, ionic strength, pH, temperature) network structure, and, thus, the stiffness of the hydrogels, can be controllably varied. The stiffness of the network arises from physical cross-link points that are permanent in nature. These cross-links can be formed by simple entanglements between the fibrils and as well as by self-assembled cross-links where defects in the packing of the valine faces of opposing folded hairpins allow the formation of daughter fibrils that branch from parent fibrils. The stiffening of the network on cooling occurs with the presence of boric acid in the hydrogel. Below a critical temperature boric acid/borate anions serve as additional physical cross-link points within the network.
Figure 3.
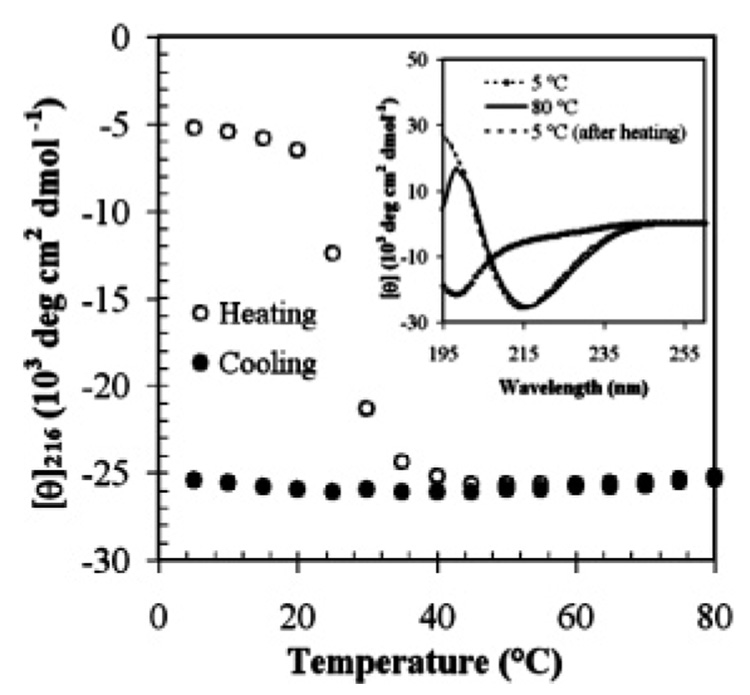
Temperature-dependent CD measurements of 0.08 wt % MAX1 solution at pH 9.1 with 125 mM boric acid and 10 mM NaCl. [θ]216 monitored between 5 and 80 °C while heating (○) and cooling (●). 10 min equilibration time was used at each temperature step. Inset: Spectra at 5 °C, warmed to 80 °C, and then cooled back to 5 °C.
We have discovered that the inertness of gel stiffness relative to temperature no longer exists when boric acid is used as a buffer salt in MAX1 solutions. In this report a new type of transition is introduced for the β-hairpin hydrogels that is accessible through complexation of boric acid/borate anion with the fibrillar network. We have discovered that when boric acid is used as a buffer-salt, the hydrogel goes through a reversible stiffening transition below a critical temperature without exhibiting detectable short or long range changes in the network structure. Importantly, this lack of structural change on stiffening of the fibrillar hydrogel network implies that boric acid/borate species locally complex with lysine-coated fibrils to increase the overall stiffness of the network. The increase in the stiffness and transition temperature can be varied by pH, boric acid concentration, and ionic strength and provides tunable control over network rigidity with temperature.
Experimental Section
Sample Preparation
The synthesis of the β-hairpins is described elsewhere.41 The preparation of peptide solutions involves two steps; the homogeneous dissolution of the peptide in water and subsequent adjustment of the solution conditions to desired pH, salt concentration and temperature. For example, for 0.5 wt % MAX1 solution at pH 9 with 125 mM boric acid and 10 mM NaCl, 1 mg of lyophilized peptide was first completely dissolved in 100 µL of cold (~5 °C) water with gentle mixing. A 100 µL amount of cold (~ 5 °C) buffer solution containing 250 mM boric acid and 20 mM NaCl, was subsequently added to the peptide solution followed by gentle pipet mixing. The resulting solution is kept at ~5 °C (using an ice-bath) until intramolecular folding, and consequent intermolecular self-assembly, is initiated by raising the temperature.
Circular Dichroism
CD spectra were collected using a Jasco J-810 spectropolarimeter. Wavelength scans were collected between 190 and 260 nm. Random coil to β-sheet transitions were monitored by collecting a series of wavelength scans with time. Mean residue ellipticity [θ] was calculated from the equation, [θ] = θobs/(10 × l × c × n) where θobs is the measured ellipticity (millidegrees), l is the path length of the cell (cm), c is the concentration (molar), and n is the number of residues. Temperature scans were performed with 5 °C increments and 10 min equilibration time at each temperature.
Infrared Spectroscopy
IR spectra were taken on a Nicolet Magna-IR 860 spectrometer. The spectrometer was operated at 1 cm−1 resolution, and the spectrum recorded was an average of 100 scans. Measurements were taken employing a zinc-selenide flow cell. The temperature of the cell was controlled between 5 and 40 °C using a water bath. For FTIR measurements, the peptide was first dissolved in 0.1 M HCl and then lyophilized to exchange the TFA counterions with Cl. Then MAX1 × nHCl was deuterated by dissolving in D2O and subsequent lyophilization.
Rheology
Dynamic rheological experiments were performed on a TA AR-2000 rheometer. In all experiments, a 25 mm diameter parallel plate geometry and 0.5 mm gap distance were used. The dynamic time and frequency sweep experiments were performed within the linear viscoelastic regime. Gels for rheological experiments were prepared in the rheometer as follows. The lyophilized peptide was dissolved in cold DI water and cold buffer solution and then loaded into the rheometer, which was also set to 5 °C. After the gap was set, the temperature of the rheometer was adjusted to the desired temperature by a Peltier element, mounted as the bottom plate, to trigger the folding and self-assembly. The evaporation of water from the hydrogel was avoided by covering the sides of the plate with low viscosity mineral oil. Control experiments were performed to ensure that the measurements were unaffected by the added oil. Heating-induced gelation and cooling-induced stiffening tests were performed with a solvent trap mounted around the bottom and top plates without the use of a mineral oil. No changes were observed in both transition temperatures.
Small-Angle Neutron Scattering
SANS experiments were performed on the NG3 30 m beamline, at the National Center for Neutron Research, National Institute of Standards and Technology, Gaithersburg, MD. The neutron beam was monochromated to 6 Å with a velocity selector having a wavelength spread of Δλ/λ = 0.15. The resulting data were corrected for detector background electronic noise and background radiation, detector inhomogeneity, empty cell scattering and buffer scattering. Intensities were normalized to an absolute scale relative to main-beam transmission measurements through the sample. Peptides were first dissolved in D2O and lyophilized to exchange hydrogen atoms with deuterium. The peptide was then dissolved in D2O and buffer salt-D2O solution was added to adjust the pH and salt concentration. After gentle mixing for about 10 s, the peptide solution was transferred into the sample cells by a syringe. The cells were made of quartz with 0.1 cm path length. The samples were kept at least 2 h at room temperature before the measurements.
Dynamic Light Scattering
DLS measurements were performed on a Brookhaven laser light scattering system using BI-9000AT type digital autocorrelator, goniometer, and solid-state laser with a wavelength of 532 nm. The measurements were performed at 90°. 200 channels were used with variable channel spacing. The temperature of the sample chamber was controlled with a circulating water bath. To get rid of dust from the lyophilized peptide, it was first dissolved in water, filtered, and then the filtered buffer solution was added to the peptide solution. The peptide concentration for the measurements was chosen as 0.1 wt % to be able to probe the dynamics of the self-assembled peptidic network structure. When higher peptide concentrations (>0.5 wt %) are used the system becomes highly nonergodic, and the decay function cannot be observed. The intensity-time correlation function (ITCF), C(τ) = 〈I(0)I(τ)〉 / 〈I(0)〉2, of the peptide solution was measured first at 40 °C (above the peptide folding and self-assembly transition) and then at 10 °C (below the stiffening transition).
Results and Discussion
Thermally Irreversible Folding Behavior of MAX1
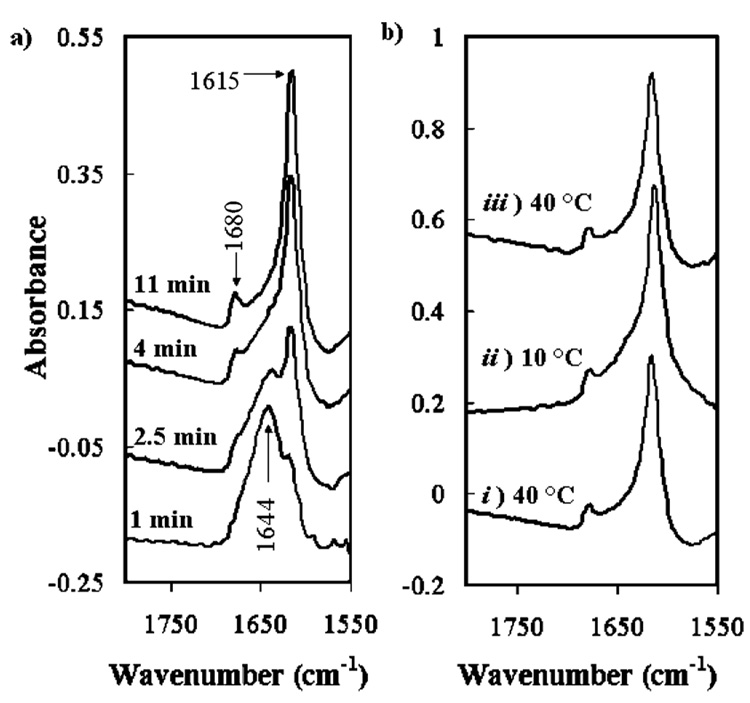
The stiffening transition of MAX1 hydrogel on cooling when in the presence of boric acid is related to ion complexation (vide infra). Therefore, it is crucial to demonstrate that this effect is not related to, or induced by, changes in the conformation of the peptide. Figure 3 shows the changes in the molar ellipticity at 216 nm ([θ]216) of 0.08 wt % (0.25 mM) MAX1 aqueous solution at pH 9.1 with 125 mM boric acid, heating from 5 to 80 °C and cooling back to 5 °C. Initially at 5 °C, below the intramolecular folding and consequent intermolecular self-assembly transition temperature, the peptide is in random coil conformation as indicated by a characteristic minimum at approximately 196 nm (Figure 3 inset). By monitoring [θ]216, the characteristic minimum exhibited by β-sheet structure in the CD spectrum, one can observe the random coil to β-sheet folding transition of MAX1 to be around 25 °C. Above 40 °C [θ]216 values remain constant indicating that the transition is complete. As the solution is cooled from 80 to 5 °C, the [θ]216 values do not change. It can be seen that the full wavelength spectrum at 5 °C (Figure 3 inset), measured after cooling the solution from 80 °C, is very similar to the spectrum at 80 °C; they both exhibit minima at 216 nm. Thus, CD data reveal that at this solution condition the folding and β-sheet transition of MAX1 is triggered with increasing temperature and is irreversible on cooling down to 5 °C. The irreversible folding of MAX1 at pH 9 is also supported by FTIR measurements. Figure 4a shows the change in absorbance with time at 40 °C for 0.5 wt % MAX1 solution at pH 9. The first scan shows a pronounced peak at 1644 cm−1, which corresponds to the amide I band, and suggests that MAX1 is in a disordered conformation. As the folding and consequent self-assembly proceeds this band shifts to 1615 cm−1 due to β-sheet formation. In addition, at 1680 cm−1 a relatively weaker band is observed in the β-sheet rich hydrogel that some have attributed to antiparallel β-sheet formation and/or β-turn structure.46 The solution was cooled to 10 °C and heated back to 40 °C to investigate reversibility (Figure 4b). The spectrum at 10 °C looks identical to the spectra at 40 °C. These results are in accordance with CD measurements and show that MAX1 has a thermally irreversible β-sheet transition at pH 9 solution conditions.
Figure 4.
FTIR spectra for 0.5 wt % MAX1 at pH 9 (125 mM boric acid) (a) Kinetics of peptide folding/self-assembly measured at 40 °C. (b) β-sheet formation is irreversible; peptide solution was heated to (i) 40 °C to induce folding/self-assembly then, it was cooled to (ii) 10 °C and it was again heated back to (iii) 40 °C, showing practically identical FTIR scans.
Stiffening Transition Observed by Rheology and DLS
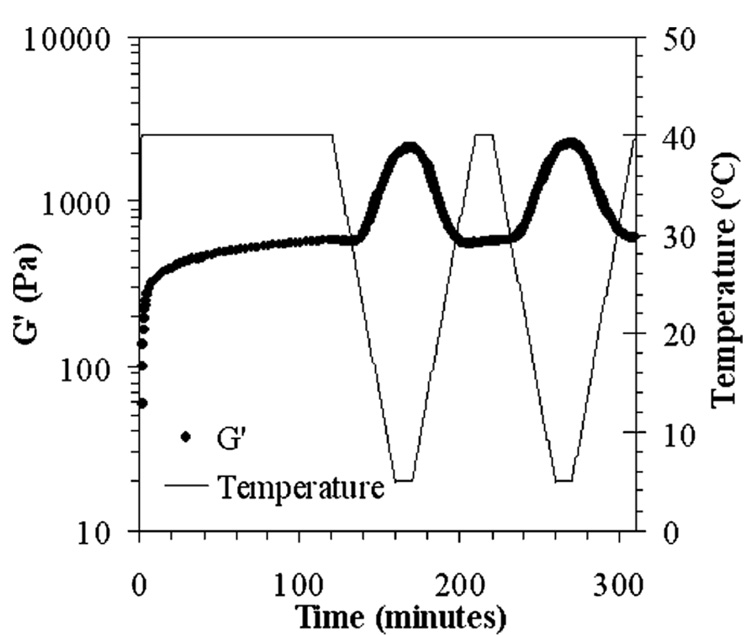
CD and FTIR measurements (Figure 3 and Figure 4) reveal that when a β-sheet rich, dilute MAX1 solution is cooled below the intramolecular folding transition, secondary structure is not affected. When a similar cooling process is employed in the rheometer on a β-sheet rich hydrogel, an interesting behavior is observed. Figure 5 shows the change of G′ with temperature during dynamic time sweep measurements for 0.5 wt % MAX1 solution at pH 9.1 with 125 mM boric acid. When the temperature is initially and suddenly increased from 5 to 40 °C, G′ immediately increases due to peptide folding and hydrogel network self-assembly and eventually plateaus at ~600 Pa after 2 h. When the hydrogel temperature is subsequently decreased from 40 to 5 °C with a rate of 1 °C/min, the original stiffness of the gel does not change until a critical temperature, or stiffening transition, is reached (~21 °C) when G′ begins to increase eventually reaching 2000 Pa at 5 °C. This low-temperature stiffening transition is reversible; the stiffness of the hydrogel decreases as the temperature is increased back to 40 °C and reaches its initial G′ value at 40 °C. As can be seen from Figure 5, one more temperature cycle was subsequently applied, and G′ exhibited the same behavior indicating that this hydrogel stiffening process is repeatable and reproducible.
Figure 5.
Dynamic time sweep measurements (6 rad/s, 0.2% strain) for 0.5 wt % MAX1 at pH 9.1 with 125 mM boric acid and 10 mM NaCl. Gelation was monitored for 2 h at 40 °C and then, 2 thermal cycles were employed with a rate of 1 °C/min between 40 and 5 °C.
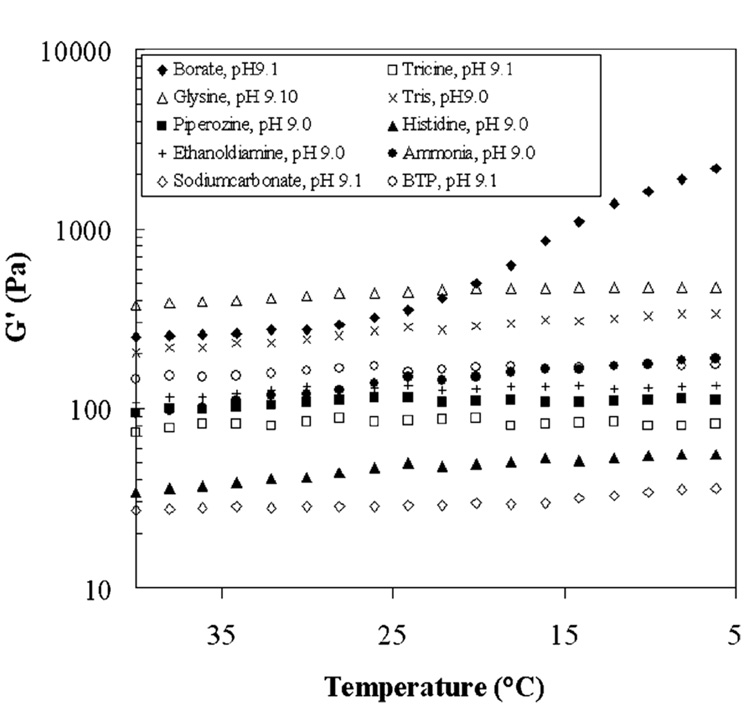
Similar rheological experiments were performed with nine other buffers at different pH and ionic strength. Examples of rheological tests on some of the peptide solutions with different buffers are shown in Figure 6. At 40 °C elasticity of the hydrogels varied significantly with different buffers, depending on the pH, ionic strength, and buffering capacity. There are continuous, however slight, increases in G′ values for almost all hydrogels on cooling. No other buffer produces the hydrogel reversible stiffening transition observed with borate buffer. Therefore, these results strongly suggest that the stiffening of the hydrogels on cooling is directly related to interaction of self-assembled peptides with boric acid or borate anion. To our knowledge, this type of reversible stiffening transition has not been reported for any peptide-based hydrogel.
Figure 6.
Dynamic temperature sweep measurements (6 rad/s, 0.2% strain) for 0.5 wt % MAX1 hydrogels with different buffers. Hydrogels were first formed at 40 °C and were cooled to 5 °C with a rate of 1 °C/min.
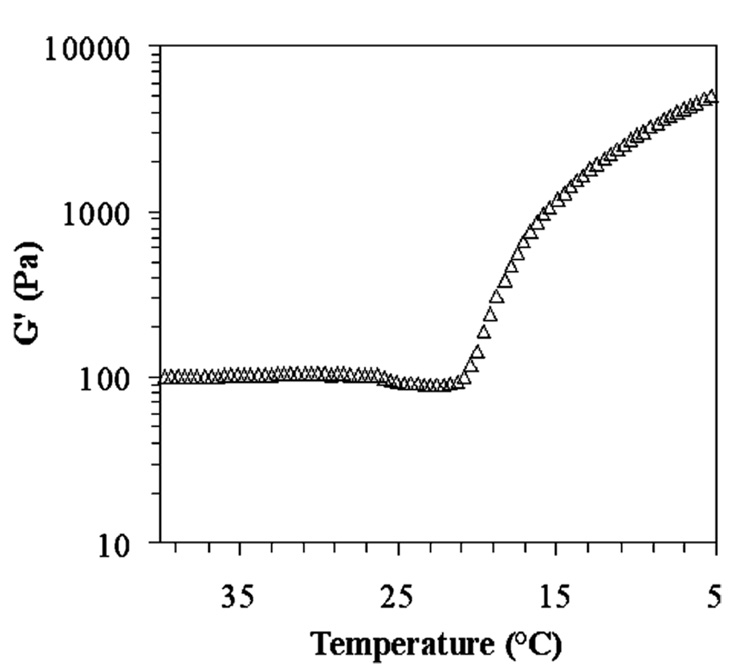
Rheological experiments show that boric acid/borate peptide complexation is kinetically fast, reversible, and occurs at lower temperatures. Reports that have studied the complexation of borate anions with hydroxyl group-containing macromolecules show similar rheological behavior. The only hydroxyl group present in MAX1 is on the threonine residue that is located in the turn region. We have synthesized a control β-hairpin by replacing the threonine residue in the turn with a gylcine residue to test if the stiffening transition is affected with the removal of the OH group. Figure 7 shows temperature sweep data for this control peptide (VK)4VDPLPG(KV)4 at pH 9. The 0.5 wt % peptide solution with borate buffer was kept at 40 °C to first form the hydrogel and was subsequently cooled down to 5 °C. The results show that the stiffening transition is not affected by OH removal; the hydrogel with G′ values around 100 Pa at 40 °C stiffens to around 5000 Pa at 5 °C. This experiment eliminates the possibility of exclusive hydroxyl group complexation causing stiffening of the network. This suggests that the gel stiffening transition is related to specific interactions between the lysine side chains of the fibrillar peptide network and boric acid and/or borate ion. Since boric acid and borate anion have three and four interaction sites per molecule, respectively, they can act as a physical crosslinker between lysine side-chains of the β-hairpin peptides. This physical crosslinking due to complexation can introduce two stiffening effects in the self-assembled peptide fibrils. First, in addition to the interfibril cross-link points that already exist from the original hydrogel self-assembly, additional interfibril junction points may be forming due to complexation of lysine side chains on the periphery of neighboring fibrils with the same boron-containing molecule, especially in the vicinity of the existing cross-link points due to the close proximity of neighboring fibrils. Second, the complexation can also occur across the surface of individual fibrils by forming junctions between lysine residues. Since the surface of the fibril will be covered with such an interaction, the locking of neighboring lysine residues via complexation along the surface of individual fibrils may increase the fibril stiffness and, thus, increase the network stiffness.
Figure 7.
Dynamic temperature sweep for 0.5 wt % MAX1 peptide with modified turn sequence, VDPLPG, at pH 9 with 125 mM boric acid and 10 mM NaCl. The hydrogel was formed at 40 °C and it was cooled to 5 °C with a rate of 1 °C/min.
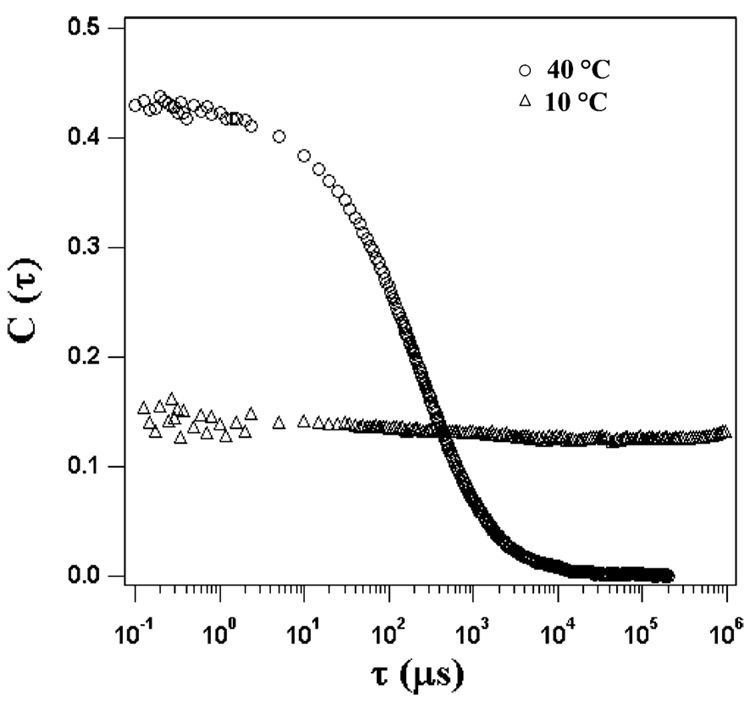
In addition to significant changes in the network stiffness observed rheologically, the complexation at low temperature is also clearly indicated by a significant change in the dynamics of the self-assembled peptide network as observed by DLS measurements. Figure 8 shows the intensity-time correlation functions (ITCF) of 0.1 wt % MAX1 solution (pH 9, 125 mM boric acid,10 mM NaCl) at 10 and 40 °C. The solution was first kept at 40 °C to induce the folding and self-assembly process. The ITCF at 40 °C shows the presence of large assembled structures with a relaxation time around τ ≈ 10 µs. As the temperature is decreased to 10 °C, the ITCF becomes flat and an exponential decay cannot be observed within the studied time scale. At both temperatures the initial amplitude of ITCF is significantly less than 1 suggesting that the system is nonergodic even at these low concentrations due to cross-links between fibrils.47,48 This effect becomes more pronounced at 10 °C; the initial amplitude of the ITCF further deviates from unity. Since the self-assembled fibrillar structures are highly crosslinked with a high polydispersity in length, no quantitative analysis of the light scattering data has been made. However, the results in Figure 8 qualitatively show that the dynamics of the fibrillar assemblies are quenched at lower temperature due to complexation and, therefore, are in agreement with the increases observed in the rigidity of the hydrogels. Although some change in the ITCF is expected at low temperatures due to a decrease in thermal energy, such a dramatic decrease in the dynamics of the fibrillar particles and increase in the nonergodic behavior as shown in Figure 8 can only be achieved via formation of new physical cross-link points and/or local stiffening of individual fibrils via complexation favored at low temperatures.
Figure 8.
ITCFs of 0.1 wt % MAX1 solution at pH 9.1 with 125 mM boric acid and 10 mM NaCl at 40 and 10 °C.
Viscoelasticity and Network Structure below the Stiffening Transition
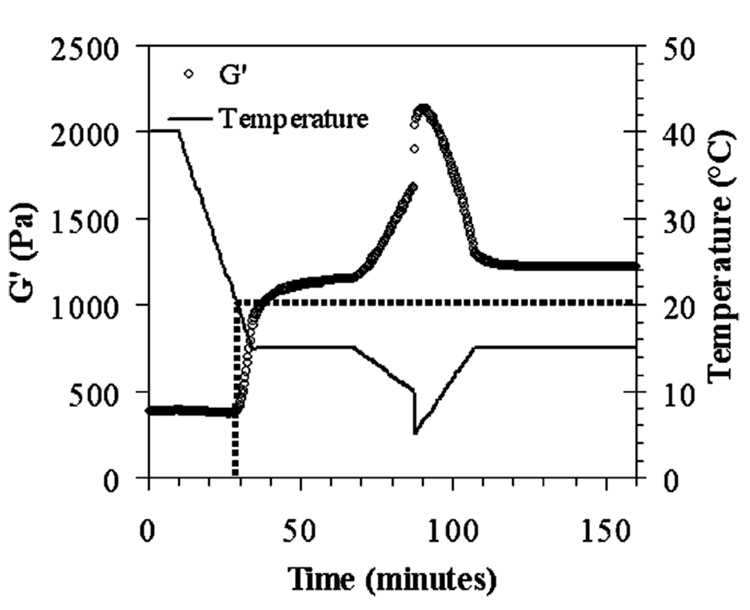
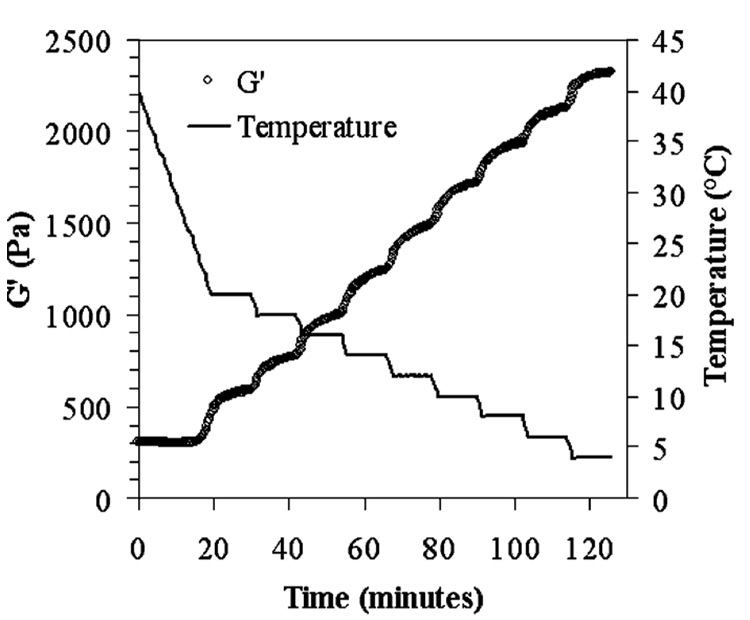
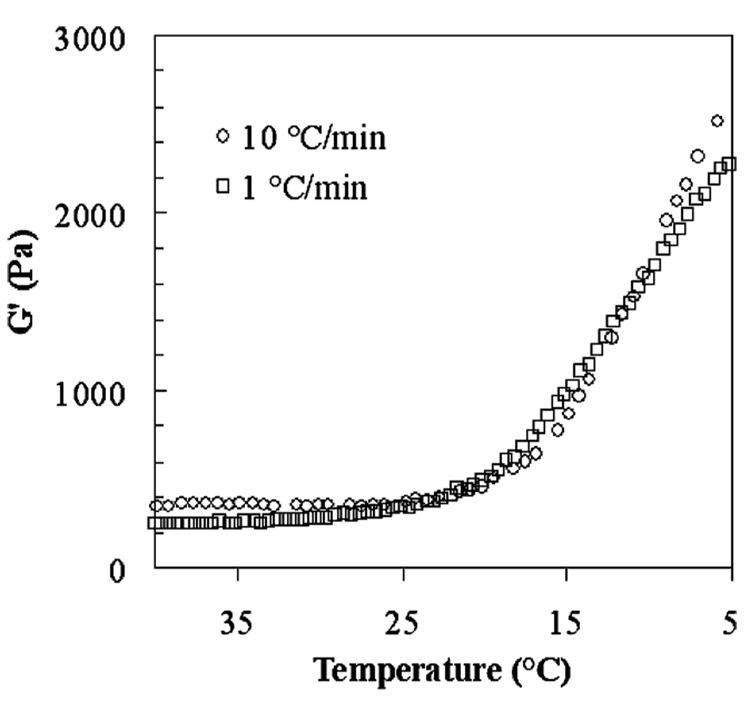
To investigate the changes in the rigidity of the hydrogels below the stiffening transition, a complex temperature history was employed as shown in Figure 9. First, to trigger folding and self-assembly to initially form hydrogel with G′ = 450 Pa, MAX1 solution was kept in the rheometer at 40 °C (not shown). After stable hydrogel was formed, the temperature was decreased to 15 °C with a rate of 1 °C/min. At approximately 21 °C the G′ starts to increase. When the hydrogel was kept at 15 °C the G′ reached a plateau of approximately 1200 Pa. Below the stiffening transition at ~21 °C G′ is strongly related to the changes in temperature. For instance, a sequential gradual drop in temperature from 15 to 10 °C then sudden drop in temperature from 10 to 5 °C cause a gradual increase then sudden increase in the stiffness of the hydrogel, respectively, to a final G′ of ~2200 Pa. In addition, after a number of thermal steps, when the hydrogel was again equilibrated at 15 °C (t = 120 min), G′ reached similar values that existed at 15 °C prior to the thermal processes. The dependence of G′ on the temperature below the stiffening transition was also investigated by employing step changes and equilibration periods, as shown in Figure 10. First, the gelation was triggered at 40 °C and then the hydrogel was cooled to 20 °C with a 1 °C/min rate. The temperature was further decreased from 20 to 4 °C with 2° increments, and at each step the temperature was kept constant for 10 min. Figure 10 shows that the trend in G′ follows the temperature curve; at every temperature increment G′ increased accordingly reaching a plateau within the equilibration time. In addition, the stiffening process of the hydrogels is not affected by the cooling rates. Figure 11 shows that both the transition temperature and G′ values of the hydrogels are very similar during both 1 °C/min and 10 °C/min cooling rates. All these results strongly suggest that below the stiffening transition temperature the number and/or the strength of the interactions increase with decreasing temperature and are responsive.
Figure 9.
Dynamic time sweep measurements (6 rad/s, 0.2% strain) of 0.5 wt % MAX1 at pH 9.1 with 125 mM boric acid and 10 mM NaCl with variable temperature (hydrogel was initially formed at 40 °C).
Figure 10.
Dynamic time sweep measurements (6 rad/s, 0.2% strain) of 0.5 wt % MAX1 at pH 9.1 with 125 mM boric acid and 10 mM NaCl. The changes in G′ (storage modulus) below the transition temperature were followed during stepwise decreases in temperature.
Figure 11.
Effect of rate of cooling, 1 °C/min and 10 °C/min, on the stiffening transitions for 0.5 wt % MAX1, pH9, 125 mM boric acid and 10 mM NaCl.
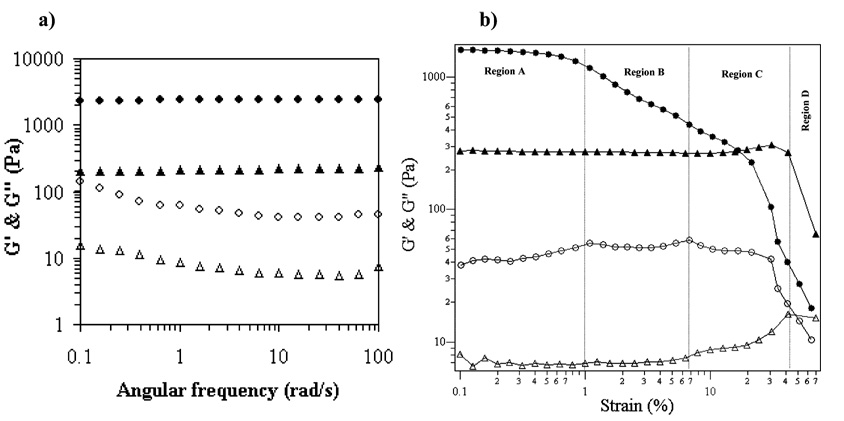
Figure 12 shows frequency and strain sweep rheology experiments for the hydrogels measured above and below the stiffening transition. The frequency sweep data shows that in both states the hydrogel G′ values are an order of magnitude greater than the corresponding G″ values and insensitive to frequency with crossover points between G′ and G″ not existent within the studied frequency range. As expected, the stiffness of the hydrogel is higher at 5 °C compared to that of 40 °C. Therefore, MAX1 hydrogels exhibit a soft-solid behavior both before and after the complexation-induced stiffening transition. The extent of the linear regime in both states was studied via strain sweep experiments at a constant frequency, 6 rad/s. At 40 °C, the linear regime extends up to 40% strain (regions A through C). Immediately before entering the nonlinear regime slight increases in both G′ and G″ are observed (region C), which can be attributed to the strain-hardening effect.49 When the hydrogel is cooled below the stiffening transition, new features arise in the strain sweep measurements. First, at 5 °C the nonlinear regime is entered around 1.0% strain, an order of magnitude smaller compared to that of the gel at 40 °C. This transition is also indicated by a small local maximum in G″ alues. As the strain is increased further (region B) another maximum in G″ appears around the point where strain-hardening is observed for the hydrogel at 40 °C. In region C, the nonlinear deformation effect increases and the hydrogel is ruptured around 30%. The decrease in the linear regime suggests that the hydrogel becomes more brittle below the stiffening transition. The additional cross-link points and/or stiffer fibrils that are introduced via cooling can be broken at small strain values as observed in region A with a further increase in the strain magnitude resulting in steady softening as observed in region B (Figure 12b). Importantly, the G′ values in region C for both 5 and 40 °C are similar. Therefore, the cross-link points that are formed at 40 °C during the initial self-assembly and gelation process are not affected at 5 °C and can still withstand up to around 40% strain. The differences in the rheology data at these two temperatures emphasize that there are two types of cross-links present below the stiffening transition; those formed during cooling-induced boric acid/borate complexation that are weaker and different in nature to those that are formed during the initial peptide folding and self-assembly process.
Figure 12.
(a) Frequency sweep (0.2% strain) and (b) Strain sweep (6 rad/s) of 0.5 wt % MAX1 at pH 9.1 with 125 mM boric acid at 40 °C (G′:▲, G″:Δ) and 5 °C (G′: ●, G″: ○).
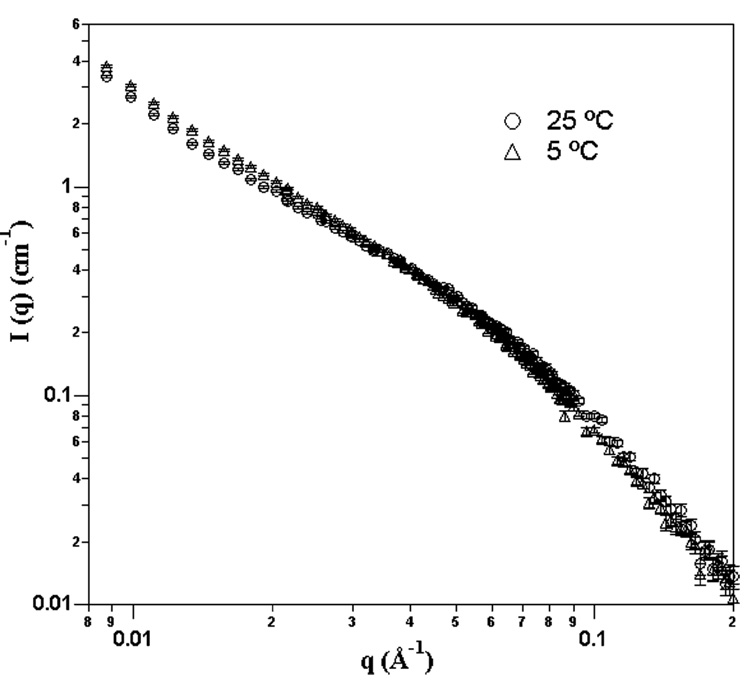
SANS measurements were performed to probe the differences in the nanostructure and network structure of the hydrogels above and below the stiffening transition. SANS data for 1 wt % MAX1 hydrogel at pH 9 with 125 mM boric acid above (25 °C) and below (5 °C) the stiffening temperature (~20 °C) are given in Figure 13. The features of both SANS spectra are very similar at all values of scattering vector q = (4π/λ)sinθ where θ is the scattering angle. Therefore, it can be concluded that the complexation does not induce any changes in the local network density or nanostructure, even though DLS measurements showed that the dynamics change significantly after complexation.
Figure 13.
SANS spectra of 1 wt % MAX1 solution at pH 9 with 125 mM boric acid at 25 and 5 °C.
The putative lysine-based complexation occurring in this system that underlies the gel stiffening transition is not unprecedented. In fact, studies in the literature have focused on the complexation and hydrogen-bonding capability of boric acid/borate ion and boronic acid with lysine residues or other amine containing amino acids for a variety of biological systems.25–27,50,51 For example, Taler et al. investigated the hydrogen bonding of borate ion with lysine using 1H and 11B NMR as a model system for studying the binding of phosphate ions to cytochrome c, a protein that has many lysine residues on its surface.52–54 Their studies showed that borate ion formed hydrogen bonds with the lysine amine nitrogen and also formed salt bridges between other residues. In addition to biological systems, others have shown that the hydrogen-bonding capability of boric acid with amines, such as melamine, can be used in supramolecular chemistry.55 Cheruzel et al. studied the cocrystallization of a polyimidazole compound with boric acid and showed that the boric acid hydrogen atoms form strong hydrogen bonds with nitrogen atoms of imidazole rings.22 It has also been shown that boron can form adducts with nitrogen.56–58 When amine groups are adjacent to boronic acids, a complex is formed between boron and nitrogen that alters the pKa of the acid. This type of complex has been investigated for developing glucose sensors that can operate at physiological pH conditions.21,59,60 These studies suggest that the boric acid/borate complexation with MAX1 may involve the side chains of lysines presented in MAX1.
All of these possible interactions are local and can introduce either additional interfibrillar physical cross-links or additional intrafibrillar stiffness into the fibrillar network. Our rheological experiments demonstrate that G′ values are directly responsive with temperature and that the stiffening process is reversible. The reversible stiffening transitions observed by rheology suggests that there are no long-range structural changes in the network structure. SANS data also support this idea of no significant structural changes occurring on stiffening. In addition, no turbidity is observed on cooling the solutions. Therefore, the stiffening of the hydrogel must be achieved by the introduction of new interfibrillar and intrafibrillar complexation points that are dynamic and reversible with temperature and that do not disrupt the original network structure.
Effect of Glucose on the Stiffening Transition
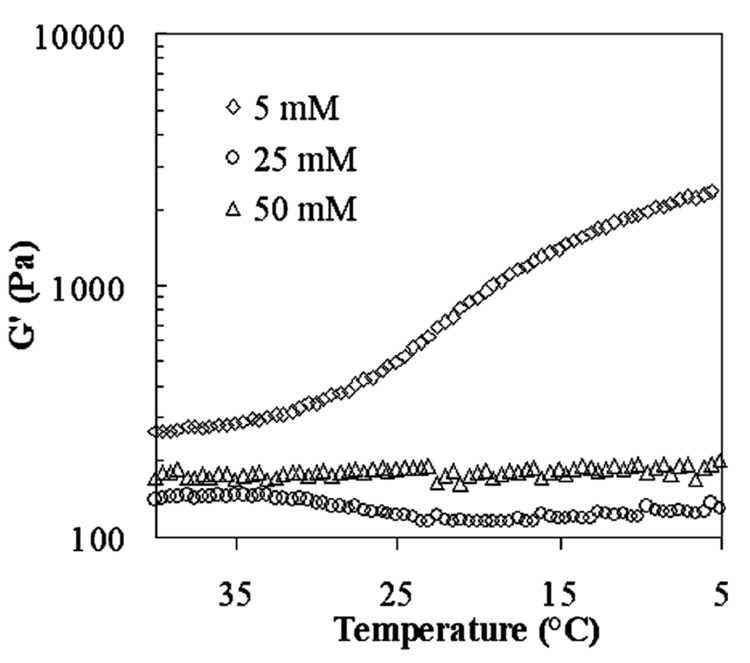
Borate anions form complexes with diols and sugars, and there are many reports in the literature that have studied the equilibrium complexation constants of various compounds.16,18,61,62 It is expected that if glucose is added to MAX1-boric acid solution the complexation of borate ions with glucose will be in competition with the complexation of boric acid/borate ion with the peptide. This competition might affect the stiffening transition. To test this hypothesis, rheological experiments were performed on glucose containing MAX1 solutions. The mere presence of glucose in the solution during initial peptide self-assembly resulted in slight decreases in the rigidity of the MAX1 hydrogels. It is known that sugars and polyols affect protein denaturation transitions by enhancing hydrophobic interactions.63–65 Therefore, the folding transitions or the self-assembly kinetics of the β-hairpins may be affected by the presence of glucose. However, despite all these possible effects, 0.5 wt % MAX1 solutions still form hydrogels (G′ ~ 200 Pa) after 30 min indicating that the self-assembly and initial network formation is still achieved in the presence of glucose. Figure 14 shows temperature sweep measurements for 0.5 wt % MAX1 hydrogels preformed with 125 mM boric acid and 5, 25, and 50 mM glucose. It can be seen that the hydrogel stiffening transition is still observed for 5 mM glucose solution. However, the hydrogel stiffening transition is not observed with 25 and 50 mM glucose. These findings suggest that when enough glucose is present in the hydrogel the stiffening transition is not observed. This effect is probably due to consumption of significant amounts borate anion in glucose complexation.
Figure 14.
Effect of glucose concentration on stiffening transition. Temperature sweep measurements for 0.5 wt % MAX1, pH 9, 125 mM boric acid with 5, 25, and 50 mM glucose concentration.
Conclusions
The reversible stiffening transition of β-hairpin hydrogels that is caused by boric acid/borate anion peptide complexation has been studied. The stiffness of the hydrogels can increase more than 1 order of magnitude due to this complexation on cooling. Below the stiffening transition the rigidity of the hydrogel is very responsive to changes in temperature. Although the dynamics of the fibrillar network are significantly slowed down by this complexation, SANS experiments reveal that the network structure is not changing which suggests that the complexation affects network stiffness via other local mechanisms. In the literature, possible interactions have been proposed between boron/boric-acid/borate and nitrogen/oxygen/hydrogen. Here, it is shown that the well-known hydroxyl–borate interaction is not responsible for the abrupt increase in the modulus of the MAX1 hydrogels. The results suggest that interaction between boric-acid/borate-anion and lysine residues drive this stiffening transition. It is proposed that the increase in G′ may be driven by both (1) the introduction of new, physical, interfibrillar cross-link points to the hydrogel network originally formed during initial self-assembly and (2) the increase in the stiffness of individual fibrils due to decoration of boric acid/borate anions on the lysine-rich surface of the fibrils. The stiffening transition temperature can be increased from 7 to 30 °C by increasing boric acid concentration from 70 to 200 mM (see the Supporting Information). It is also found that the cooling rate does not alter the stiffening temperature significantly. The pH dependence of the complexation shows that the stiffening transition is observed only when MAX1 is in self-assembled state; when MAX1 is not folded, and thus not assembled into fibrillar structures, cooling the peptide solution does not alter its liquid-like behavior. When glucose is present in MAX1-boric acid solution, although initial gelation on heating is achieved, the stiffening transition is not observed due to glucose–borate complexation. Although the exact mechanism of the gel stiffening process is not yet fully understood, the boric-acid/borate-anion complexation provides tunability of both rigidity and stiffening temperature of peptide hydrogels on cooling.
Acknowledgment
We acknowledge financial support from the National Institutes of Health RO1 016386-01
Footnotes
Supporting Information Available: Rheological experiments on the effects on boric acid concentration and pH on the stiffening transitions of MAX1 hydrogels. This material is available free of charge via the Internet at http://pubs.acs.org.
References and Notes
- 1.Nijenhuis KT. Thermoreversible Networks. Vol. 130. Berlin 33: Springer-Verlag Berlin; 1997. Thermoreversible networks - Viscoelastic properties and structure of gels. [Google Scholar]
- 2.Lee KY, Mooney DJ. Chem. ReV. 2001;101:1869. doi: 10.1021/cr000108x. [DOI] [PubMed] [Google Scholar]
- 3.Jeong B, Bae YH, Lee DS, Kim SW. Nature. 1997;388:860. doi: 10.1038/42218. [DOI] [PubMed] [Google Scholar]
- 4.Miyoshi E, Takaya T, Nishinari K. Thermochim. Acta. 1995;267:269. [Google Scholar]
- 5.Miyoshi E, Takaya T, Nishinari K. Food Hydrocolloids. 1994;8:505. [Google Scholar]
- 6.Fang YP, Takahashi R, Nishinari K. Biomacromolecules. 2004;5:126. doi: 10.1021/bm034261n. [DOI] [PubMed] [Google Scholar]
- 7.Grisel M, Muller G. Macromolecules. 1998;31:4277. [Google Scholar]
- 8.Kesavan S, Prudhomme RK. Macromolecules. 1992;25:2026. [Google Scholar]
- 9.Pezron E, Leibler L, Ricard A, Audebert R. Macromolecules. 1988;21:1126. [Google Scholar]
- 10.Power DJ, Rodd AB, Paterson L, Boger DV. J. Rheol. 1998;42:1021. [Google Scholar]
- 11.Rietjens M, Steenbergen PA. Eur. J. Inorg. Chem. 2005:1162. [Google Scholar]
- 12.Tayal A, Pai VB, Khan SA. Macromolecules. 1999;32:5567. [Google Scholar]
- 13.Chen CY, Yu TL. Polymer. 1997;38:2019. [Google Scholar]
- 14.Lin HL, Yu TL, Cheng CH. Colloid Polym. Sci. 2000;278:187. [Google Scholar]
- 15.Shibayama M, Kurokawa H, Nomura S, Muthukumar M, Stein RS, Roy S. Polymer. 1992;33:2883. [Google Scholar]
- 16.Bishop M, Shahid N, Yang JZ, Barron AR. Dalton Trans. 2004:2621. doi: 10.1039/b406952h. [DOI] [PubMed] [Google Scholar]
- 17.Miyazaki Y, Yoshimura K, Miura Y, Sakashita H, Ishimaru K. Polyhedron. 2003;22:909. [Google Scholar]
- 18.Pezron E, Leibler L, Ricard A, Lafuma F, Audebert R. Macromolecules. 1989;22:1169. [Google Scholar]
- 19.Wilson ME, Najdi S, Krochta JM, Hsieh YL, Kurth MJ. Macromolecules. 1998;31:4486. [Google Scholar]
- 20.Cordes DB, Gamsey S, Sharrett Z, Miller A, Thoniyot P, Wessling RA, Singaram B. Langmuir. 2005;21:6540. doi: 10.1021/la050219x. [DOI] [PubMed] [Google Scholar]
- 21.Hisamitsu I, Kataoka K, Okano T, Sakurai Y. Pharm. Res. 1997;14:289. doi: 10.1023/a:1012033718302. [DOI] [PubMed] [Google Scholar]
- 22.Cheruzel LE, Mashuta MS, Buchanan RM. Chem. Commun. 2005:2223. doi: 10.1039/b419040h. [DOI] [PubMed] [Google Scholar]
- 23.Barth RF, Soloway AH, Fairchild RG. Cancer Res. 1990;50:1061. [PubMed] [Google Scholar]
- 24.Barranco WT, Eckhert CD. Cancer Lett. 2004;216:21. doi: 10.1016/j.canlet.2004.06.001. [DOI] [PubMed] [Google Scholar]
- 25.London RE, Gabel SA. Biochemistry. 2002;41:5963. doi: 10.1021/bi025583z. [DOI] [PubMed] [Google Scholar]
- 26.Nicola G, Peddi S, Stefanova M, Nicholas RA, Gutheil WG, Davies C. Biochemistry. 2005;44:8207. doi: 10.1021/bi0473004. [DOI] [PubMed] [Google Scholar]
- 27.Transue TR, Krahn JM, Gabel SA, DeRose EF, London RE. Biochemistry. 2004;43:2829. doi: 10.1021/bi035782y. [DOI] [PubMed] [Google Scholar]
- 28.Benderdour M, Hess K, Gadet MD, Dousset B, Nabet P, Belleville F. Biochem. Biophys. Res. Commun. 1997;234:263. doi: 10.1006/bbrc.1997.6621. [DOI] [PubMed] [Google Scholar]
- 29.Salentine CG. Inorg. Chem. 1983;22:3920. [Google Scholar]
- 30.Aggeli A, Bell M, Boden N, Keen JN, Knowles PF, McLeish TCB, Pitkeathly M, Radford SE. Nature. 1997;386:259. doi: 10.1038/386259a0. [DOI] [PubMed] [Google Scholar]
- 31.Caplan MR, Moore PN, Zhang SG, Kamm RD, Lauffenburger DA. Biomacromolecules. 2000;1:627. doi: 10.1021/bm005586w. [DOI] [PubMed] [Google Scholar]
- 32.Caplan MR, Schwartzfarb EM, Zhang SG, Kamm RD, Lauffenburger DA. Biomaterials. 2002;23:219. doi: 10.1016/s0142-9612(01)00099-0. [DOI] [PubMed] [Google Scholar]
- 33.Caplan MR, Schwartzfarb EM, Zhang SG, Kamm RD, Lauffenburger DA. J. Biomater. Sci., Polym. Ed. 2002;13:225. doi: 10.1163/156856202320176493. [DOI] [PubMed] [Google Scholar]
- 34.Scheibel T, Parthasarathy R, Sawicki G, Lin XM, Jaeger H, Lindquist SL. Proc. Natl. Acad. Sci. U.S.A. 2003;100:4527. doi: 10.1073/pnas.0431081100. [DOI] [PMC free article] [PubMed] [Google Scholar]
- 35.Brown CL, Aksay IA, Saville DA, Hecht MH. J. Am. Chem. Soc. 2002;124:6846. doi: 10.1021/ja0261271. [DOI] [PubMed] [Google Scholar]
- 36.Burkoth TS, Benzinger TLS, Urban V, Morgan DM, Gregory DM, Thiyagarajan P, Botto RE, Meredith SC, Lynn DG. J. Am. Chem. Soc. 2000;122:7883. [Google Scholar]
- 37.West MW, Wang WX, Patterson J, Mancias JD, Beasley JR, Hecht MH. Proc. Natl. Acad. Sci. U.S.A. 1999;96:11211. doi: 10.1073/pnas.96.20.11211. [DOI] [PMC free article] [PubMed] [Google Scholar]
- 38.Colfer S, Kelly JW, Powers ET. Langmuir. 2003;19:1312. [Google Scholar]
- 39.Gazit E. FASEB J. 2002;16:77. doi: 10.1096/fj.01-0442hyp. [DOI] [PubMed] [Google Scholar]
- 40.Ghadiri MR, Granja JR, Buehler LK. Nature. 1994;369:301. doi: 10.1038/369301a0. [DOI] [PubMed] [Google Scholar]
- 41.Schneider JP, Pochan DJ, Ozbas B, Rajagopal K, Pakstis L, Kretsinger J. J. Am. Chem. Soc. 2002;124:15030. doi: 10.1021/ja027993g. [DOI] [PubMed] [Google Scholar]
- 42.Pochan DJ, Schneider JP, Kretsinger J, Ozbas B, Rajagopal K, Haines L. J. Am. Chem. Soc. 2003;125:11802. doi: 10.1021/ja0353154. [DOI] [PubMed] [Google Scholar]
- 43.Ozbas B, Kretsinger J, Rajagopal K, Schneider JP, Pochan DJ. Macromolecules. 2004;37:7331. [Google Scholar]
- 44.Kretsinger JK, Haines LA, Ozbas B, Pochan DJ, Schneider JP. Biomaterials. 2005;26:5177. doi: 10.1016/j.biomaterials.2005.01.029. [DOI] [PubMed] [Google Scholar]
- 45.Ozbas B, Rajagopal K, Schneider JP, Pochan DJ. Phys. Rev. Lett. 2004;93 doi: 10.1103/PhysRevLett.93.268106. [DOI] [PubMed] [Google Scholar]
- 46.Surewicz WK, Mantsch HH, Chapman D. Biochemistry. 1993;32:389. doi: 10.1021/bi00053a001. [DOI] [PubMed] [Google Scholar]
- 47.Okamoto M, Norisuye T, Shibayama M. Macromolecules. 2001;34:8496. [Google Scholar]
- 48.Takata S, Norisuye T, Tanaka N, Shibayama M. Macromolecules. 2000;33:5470. [Google Scholar]
- 49.Xu JY, Tseng Y, Wirtz D. J. Biol. Chem. 2000;275:35886. doi: 10.1074/jbc.M002377200. [DOI] [PubMed] [Google Scholar]
- 50.Chen X, Schauder S, Potier N, Van Dorsselaer A, Pelczer I, Bassler BL, Hughson FM. Nature. 2002;415:545. doi: 10.1038/415545a. [DOI] [PubMed] [Google Scholar]
- 51.Tsilikounas E, Kettner CA, Bachovchin WW. Biochemistry. 1992;31:12839. doi: 10.1021/bi00166a019. [DOI] [PubMed] [Google Scholar]
- 52.Taler G, Eliav U, Navon G. J. Magn. Reson. 1999;141:228. doi: 10.1006/jmre.1999.1853. [DOI] [PubMed] [Google Scholar]
- 53.Taler G, Navon G, Becker OM. Biophys. J. 1998;75:2461. doi: 10.1016/S0006-3495(98)77690-8. [DOI] [PMC free article] [PubMed] [Google Scholar]
- 54.Taler G, Schejter A, Navon G. Inorg. Chim. Acta. 1998;273:388. [Google Scholar]
- 55.Roy A, Choudhury A, Rao CNR. J. Mol. Struct. 2002;613:661. [Google Scholar]
- 56.Franzen S, Ni WJ, Wang BH. J. Phys. Chem. B. 2003;107:12942. [Google Scholar]
- 57.Gallop PM, Paz MA, Henson E. Science. 1982;217:166. doi: 10.1126/science.6178158. [DOI] [PubMed] [Google Scholar]
- 58.Otsuka H, Uchimura E, Koshino H, Okano T, Kataoka K. J. Am. Chem. Soc. 2003;125:3493. doi: 10.1021/ja021303r. [DOI] [PubMed] [Google Scholar]
- 59.Shiomori K, Ivanov AE, Galaev IY, Kawano Y, Mattiasson B. Macromol. Chem. Phys. 2004;205:227. [Google Scholar]
- 60.Wiskur SL, Lavigne JJ, Ait-Haddou H, Lynch V, Chiu YH, Canary JW, Anslyn EV. Org. Lett. 2001;3:1311. doi: 10.1021/ol0156805. [DOI] [PubMed] [Google Scholar]
- 61.Conner JM, Bulgrin VC. J. Inorg. Nucl. Chem. 1967;29:1953. [Google Scholar]
- 62.Pollak V, Mlynek J. Carbohydr. Res. 1993;241:279. [Google Scholar]
- 63.Back JF, Oakenfull D, Smith MB. Biochemistry. 1979;18:5191. doi: 10.1021/bi00590a025. [DOI] [PubMed] [Google Scholar]
- 64.Chronakis IS. J. Agric. Food Chem. 2001;49:888. doi: 10.1021/jf0005059. [DOI] [PubMed] [Google Scholar]
- 65.Dierckx S, Huyghebaert A. Food Hydrocolloids. 2002;16:489. [Google Scholar]


