

Abstract
Motivation: Significant efforts have been made to acquire data under different conditions and to construct static networks that can explain various gene regulation mechanisms. However, gene regulatory networks are dynamic and condition-specific; under different conditions, networks exhibit different regulation patterns accompanied by different transcriptional network topologies. Thus, an investigation on the topological changes in transcriptional networks can facilitate the understanding of cell development or provide novel insights into the pathophysiology of certain diseases, and help identify the key genetic players that could serve as biomarkers or drug targets.
Results: Here, we report a differential dependency network (DDN) analysis to detect statistically significant topological changes in the transcriptional networks between two biological conditions. We propose a local dependency model to represent the local structures of a network by a set of conditional probabilities. We develop an efficient learning algorithm to learn the local dependency model using the Lasso technique. A permutation test is subsequently performed to estimate the statistical significance of each learned local structure. In testing on a simulation dataset, the proposed algorithm accurately detected all the genes with network topological changes. The method was then applied to the estrogen-dependent T-47D estrogen receptor-positive (ER+) breast cancer cell line datasets and human and mouse embryonic stem cell datasets. In both experiments using real microarray datasets, the proposed method produced biologically meaningful results. We expect DDN to emerge as an important bioinformatics tool in transcriptional network analyses. While we focus specifically on transcriptional networks, the DDN method we introduce here is generally applicable to other biological networks with similar characteristics.
Availability: The DDN MATLAB toolbox and experiment data are available at http://www.cbil.ece.vt.edu/software.htm.
Contact: yuewang@vt.edu
Supplementary information: Supplementary data are available at Bioinformatics online.
1 INTRODUCTION
Recent advances in high-throughput genomic technologies provide ample opportunities to study cellular activities at the individual gene expression and network levels, while also presenting new challenges for data analysis (Clarke et al., 2008). Discovering the mechanisms that orchestrate the activities of genes and proteins in cells remains one of the key goals of systems biology studies (Kitano, 2002). Several approaches have been proposed to model genetic regulatory networks (Li et al., 2008), such as Bayesian networks (Friedman, 2004; Friedman et al., 2000; Husmeier, 2003), probabilistic Boolean networks (Shmulevich et al., 2002), state–space models (Rangel et al., 2004) and network component analysis (Liao et al., 2003). These methods attempt to construct a static network that can explain various gene regulation programs.
However, genetic regulatory networks are context-specific and dynamic in nature (Beyer et al., 2007; Clarke et al., 2008). Under different conditions, different regulatory components and mechanisms are activated and the topology of the underlying gene regulatory network changes accordingly. For example, in response to diverse conditions in the yeast, transcription factors alter their interactions and rewire the signaling networks (Luscombe et al., 2004). While the inference of transcriptional networks using data from composite conditions could sometimes be contradictory due to changes in the underlying topology, most network learning algorithms assume an invariant network topology (Friedman et al., 2000; Rangel et al., 2004; Shmulevich et al., 2002). Therefore, some methods have been presented to learn condition-specific transcriptional networks in yeast (Kim et al., 2006; Segal et al., 2003). It is important to focus on and examine the topological changes in transcriptional networks between disease and normal conditions or under different stages of cell development. For example, a deviation from normal regulatory network topology may reveal the mechanism of pathogenesis (Hood et al., 2004), and the genes that undergo the most network topological changes may serve as biomarkers or drug targets.
Several methods have been proposed to utilize network topology information to carry out various bioinformatics tasks. Liu et al. (2006) introduced a topology-based cancer classification method, where correlation networks were first constructed and later used to perform classification. Fuller et al. (2007) developed weighted gene co-expression network analysis strategies, via single network analysis and differential network analysis, to identify physiologically relevant modules. Qiu et al. (2005, 2007) proposed an ensemble dependence model to detect the dependence changes of gene clusters between cancer and normal conditions for cancer classification, and further extended the dependence model to dependence networks. Wei and Li (2007) introduced a Markov random field model for network-based analysis of genomic data that utilizes the known pathway structures to identify differentially expressed genes and sub-networks.
In this article, we propose a differential dependency network (DDN) analysis to model and detect the statistically significant topological changes in transcriptional networks between two conditions. We use local dependency models to characterize the dependencies of genes in the network and represent local network structures. Local dependency models decompose the whole network into a series of local networks, which serve as the basic elements of the network used for statistical testing. Unlike other dependency models that consider only pairwise relationships (Choi et al., 2005; Fuller et al., 2007; Kostka and Spang, 2004; Watson, 2006) or binding triples (Qiu et al., 2007), the local dependency models select the number of dependent variables automatically by the Lasso method (Tibshirani, 1996), and thereby learn the local network structures. Subsequently, we perform permutation tests on the local dependency models under two conditions and assign the P-values to the local structures. It may seem straightforward to construct an entire network under each condition and compare the differences between the two networks (Fuller et al., 2007; Qiu et al., 2007). However, in realistic applications this approach runs into the difficulty that the network structure learning can be inconsistent with a limited number of data samples. The detection procedure proposed here assures the statistical significance of the detected network topological changes by performing a permutation test on individual local structures. We also pinpoint ‘hot spots’ in the network where the genes exhibit network topological changes between two conditions above a given significance level. Lastly, we extract and visualize the DDN, i.e. the sub-network showing significant topological changes. We demonstrate the usefulness of the proposed method on both simulated and real microarray data. Tested on a simulation dataset, the proposed algorithm accurately captured the genes with network topological changes. When applied to the estrogen-dependent T-47D estrogen receptor-positive (ER+) breast cancer cell line datasets and human and mouse embryonic stem cell (ESC) datasets, the DDN analysis obtained biological meaningful and promising results.
2 METHODS
2.1 Local dependency models
Given a set of random variables X={X1,X2,…,XM}, a dependency network for X is modeled by a set of local conditional probability distributions, one for each node given its parents, denoted as Zi, which satisfies
| (1) |
where X−i={X1,X2,…,Xi−1,Xi+1,…,XM} and Zi⊆X−i. P(Xi|Zi) also represents the local structure of node Xi, i.e. the relationship of node Xi and its parents Zi on the graph (Heckerman et al., 2000).
Inspired by this formulation, we propose a local dependency model to describe the dependencies of genes in a transcriptional network. Unlike a conventional dependency network approach, where there is only one conditional probability distribution for each node given its parents, our local dependency model allows more than one conditional probability distributions for each node. Mathematically, suppose there are M genes in the network of interest, and the dependencies of gene i on other genes are formulated by a set of conditional probabilities,
| (2) |
where Zi,1,Zi,2,…,Zi,si are some subsets of X−i and si is the number of conditional probabilities for random variable Xi. We use Xi to refer both to the expressions of gene i and to its corresponding node on the graph. This modification is primarily based on the following considerations. First, our goal is not to construct the entire network that represents the full joint distribution of all variables, rather we wish to model the local structures for further statistical testing. Second, many genes are highly correlated and the data points are very limited when extracting most biological networks. Through our experiments, we found that the conventional approach misses some meaningful dependency connections in data-sparse situations. For example, regulator genes R1 and R2 have the same target gene A, and the expression patterns of R1, R2 and A are highly correlated. When the data points are few, the standard approach may only select one of the dependencies, for instance, gene A on gene R1, even though the dependency of gene A on gene R2 is only slightly less significant than the dependency of gene A on gene R1. However, the dependencies of gene A on genes R1 and R2 are both important, and we want to keep the rich structural information for later step to assess the topological changes. Therefore, to retain more meaningful local structure information, instead of selecting ‘the best’ local structure, we select a set of ‘sufficiently good’ local structures for further statistical testing. We achieve this goal by allowing each node to be modeled by more than one conditional probability distribution.
2.2 Local structure learning
The conditional probability distributions in Equation (2) can be inferred by regression methods. In our approach, we consider a linear regression model in which the variable Xi is predicted by a linear function of Zi
| (3) |
where Zi∈{Zi,1,Zi,2,…,Zi,si} is a column vector of random variables, β is a column vector of unknown parameters. The random error ɛi is independent of Zi and is assumed to have normal distribution N(0,σi2). The local conditional probability P(Xi|Zi) is given by
| (4) |
Learning the structure of the local dependency model requires the selection of a Zi that shows good predictability of Xi. Given a predefined maximum size of Zi, K, we examine all CM−1K combinations of the elements in X−i with size K. K can be empirically set to a positive integer between 1 and M−1. When K=1, the proposed local dependency model only considers pairwise relationships. When K=M−1, the proposed local dependency model is equivalent to standard dependency networks as described in Equation (1) (Heckerman et al., 2000).
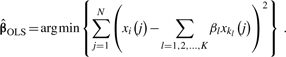
Suppose one K-combination of X−i is {Xk1,Xk2,…,XkK}, where k1,k2,…,kK∈{1,2,…,i−1,i+1,…,M}, and there are N expression samples. Lower case letter xi(j) denotes the j-th sample value taken by the variable Xi, j=1,2,…,N. We perform a L1 constrained regression of Xi on Zi={Xk1,Xk2,…,XkK}
| (5) |
Equation (5) is known as the Lasso estimator (Tibshirani, 1996), which minimizes L2 norm loss with constraint on the L1 norm of β. The nature of L1 constraint tends to make some coefficients in  exactly zero, and hence it automatically selects a subset of features and leads to a simpler model that avoids overfitting the data, and therefore usually has better generalization performance. The parameter t≥0 controls the amount of shrinkage that is applied to the estimates. In our software implementation, parameter t is determined by 5-fold cross-validation. Solving Equation (5) is a convex optimization problem, and can be solved very efficiently. We adopt the least angle regression (LARS) method to solve this problem. The detailed procedure of LARS can be found in Efron et al. (2004).
We also use a prescreening strategy to release the computational burden. We first regress Xi on Zi={Xk1,Xk2,…,XkK}, using the ordinary least square method
 |
(6) |
If the corresponding mean square error (MSE) is above a predetermined threshold T, which means Xi cannot be accurately predicted by the subset {Xk1,Xk2,…,XkK}, the subset {Xk1,Xk2,…,XkK} will be discarded. If the MSE is below T, we will then perform the L1 constrained regression of Xi.
We perform the above prescreening and local structure learning with the Lasso on each of K-combinations of X−i, and obtain predictor sets Zi,1,Zi,2,…,Zi,si and the conditional probability distributions 𝒫i={P(Xi|Zi,1),P(Xi|Zi,2),…,P(Xi|Zi,si)} for node Xi.
To measure how well variables Zi can predict Xi, or how well the local dependency model fits gene expression microarray data, we further introduce the definition of coefficient of determination (COD)
| (7) |
where var{·} is the estimate of the variance of the random variable and fXi|Zi (·) is the best function in a given function class that minimizes the residual variance. COD has been successfully used in non-linear signal processing and probabilistic Boolean network inference (Shmulevich et al., 2002). Here we only use linear functions, and var{Xi−fXi|Zi(Zi)} is an estimate of σi2 in Equation (4).
2.3 Detection of statistically significant topological changes
To detect the statistically significant network topological changes between two experimental conditions, we assume there are M genes in the network of interest, and N1 samples from condition 1 and N2 samples from condition 2. We further denote the datasets from two conditions by D(m)=[x(m)(1),x(m)(2),…,x(m)(Nm)], where superscript (m) indicates condition m, m= 1, 2. The bold face lower case letter x(m)(j) denotes the column vector [x1(m)(j),x2(m)(j),…,xM(m)(j)]T, where lower case letter xi(m)(j) denotes the j-th sample value taken by variable Xi under condition m.
By applying the learning procedure to datasets D(1) and D(2), respectively, we obtain 𝒫i(1)={P(Xi|Zi,1(1)),P(Xi|Zi,2(1)),…,P(Xi|Zi,si(1)(1))} under condition 1 and 𝒫i(2)={P(Xi|Zi,1(2)),P(Xi|Zi,2(2)),…,P(Xi|Zi,si(2)(2))} under condition 2 for each node i, i=1,2,…,M. Then we take the union of the local structures learned under two conditions
| (8) |
for further statistical testing.
For each conditional probability distribution in 𝒫i, i=1,2,…,M, for instance, P(Xi|Zi)∈𝒫i, we perform a permutation test to assess how significantly it is different between two conditions. Given samples {[xi(1)(j(1)),zi(1)(j(1))]T, j(1)=1,2,…,N1} under the first condition and {[xi(2)(j(2)),zi(2)(j(2))]T, j(2)=1,2,…,N2} under the second condition, we calculate COD(1) and COD(2), using Equation (7). A test statistic  is defined by the absolute difference of the coefficients of determination under two conditions
| (9) |
We want to test the null hypothesis, H0, of no difference between P(1)(Xi|Zi) and P(2)(Xi|Zi). We first combine {[xi(1)(j(1)),zi(1)(j(1))]T, j(1)=1,2,…,N1} and {[xi(2)(j(2)),zi(2)(j(2))]T,j(2)=1,2,…,N2}, and then randomly permute samples from two conditions and divide the data into two sets of N1 and N2 samples, respectively. We perform the above procedure B times, where B is set to 5000 in our software implementation, and calculate  , b=1,2,…,B according to Equation (9). An estimate of the achieved significance level (ASL) of the test is
| (10) |
where the random variable  is generated by permutation and
  denotes the indicator function, which takes 1 when
  and 0 otherwise. The smaller the value of ASL, the stronger the evidence against H0 is. Equation (10) also is an estimate of the P-value. The detailed permutation procedure is described in Efron and Tibshirani (1993). This detection procedure is performed on every local structure in 𝒫i, i=1,2,…,M, and each local structure is assigned a P-value.
2.4 Identification of the ‘hot spots’ in the network and extraction of the DDN
Given a user-defined P-value cutoff, we obtain a set of statistically significant differential local structures. The nodes in these differential local structures are identified as ‘hot spots’ in the network, which are the genes undergoing topological changes defined by a specified significance level. These genes may correspond to the genes in disease- or process-related pathways.
DDN is the focused sub-network that exhibits the topological changes. We consider a connection to exist from each element in Zi to Xi under one specific condition if the variance of P(Xi|Zi) is below the user-defined threshold T for that condition (see Supplementary Material for discussions on the selection of T). We use different colors to represent connections appearing under different conditions. DDN provides a way to visualize the topological changes, and when applied to disease studies, DDN extracts and focuses on the disease-related pathways that may contribute to the understanding of the mechanism of the disease.
3 RESULTS
3.1 A simulation experiment
We first used the software SynTReN (Van den Bulcke et al., 2006) to generate one simulation dataset of a sub-network drawn from an existing signaling network in Saccharomyces cerevisiae. Then we changed part of network topology and used SynTReN to generate another dataset according to this modified network. The network topology under two conditions is shown in Figure 1. The network contains 20 nodes that represent 20 genes. The black lines indicate the regulatory relationships that exist under both conditions. The red and green lines are the regulatory relationships that only exist under conditions 1 and 2, respectively. The sub-network comprised of nodes MBP1_SWI6, CLB5, CLB6, PHO2, FLO1, FLO10 and TRP4 and green and red lines is the DDN that our algorithm tries to identify from expression data.
Fig. 1.

The network topology under two conditions in the simulation study. Nodes in the network represent genes. Lines in the network indicate regulatory relationships between genes. The black lines are the regulatory relationships that exist under both conditions. The red and green lines represent the regulatory relationships that only exist under conditions 1 and 2, respectively. The DDN between the two conditions is the sub-network comprised of nodes MBP1_SWI6, CLB5, CLB6, PHO2, FLO1, FLO10 and TRP4 and green and red lines.
The parameters for our algorithm are: threshold T is 0.25, P-value cutoff is 0.01 and the maximum size of Zi, K, is 2. Table 1 presents the ‘hot spots’ identified by the DDN analysis. Table 1 also shows the fold-changes of individual genes (after base 2 logarithm), and P-values of t-tests of individual genes. Our algorithm picked up all genes involved in topological changes, including some genes that did not show a significant difference in fold-change or t-tests, such as CLB6, FLO1 and MBP1_SWI6. This indicates that our algorithm can successfully detect these interesting genes using their topological information, even though the means of their expressions did not change substantially between the two conditions. Therefore, this method is able to identify biomarkers that cannot be picked up by traditional gene ranking methods, providing a complimentary approach for biomarker identification problem.
Table 1.
‘Hot spots’ identified by DDN analysis in simulation study
| Gene | Fold change | P-value | Gene | Fold change | P-value |
|---|---|---|---|---|---|
| (t-test) | (t-test) | ||||
| CLB5 | 8.92E-01 | 6.92E-043 | MBP1_SWI6 | 3.74E-02 | 4.58E-001 |
| CLB6 | 4.79E-02 | 2.00E-001 | PHO2 | 1.54E-01 | 1.34E-005 |
| FLO1 | −5.04E-02 | 4.44E−001 | SWI4 | −1.23E-01 | 3.64E-007 |
| FLO10 | 7.73E-01 | 3.52E-024 | TRP4 | 8.26E-02 | 1.00E-002 |
Figure 2 shows the DDN between the two conditions extracted by the proposed algorithm. The DDN shows network topological changes and the genes involved therein. The red lines in Figure 2 represent the connections that exist only under condition 1, and the green lines represent the connections that exist only under condition 2. Compared with the known network topology shown in Figure 1, the proposed algorithm correctly identified and extracted all the nodes with topology changes and 9 of 10 differential connections, with only the connection between PHO2 and TRP4 under condition 1 falsely missed, and the connection between PHO2 and SWI4 under condition 1 and the connection between MBP1_SWI6 and SWI4 under condition 2 falsely detected.
Fig. 2.

The DDN extracted by the proposed algorithm in the simulation study. The red lines represent the connections (dependencies) that only exist under condition 1, and the green lines represent the connections (dependencies) that only exist under condition 2. The proposed DDN analysis successfully detected 9 of 10 connections that are different between two conditions and all the genes involved in the network topology changes. The connections between PHO2 and SWI4 under condition 1 (red) and between MBP_SWI6 and SWI4 under condition 2 (green) were falsely detected and the connection between PHO2 and TRP4 under condition 1 (red) was falsely missed.
3.2 Breast cancer dataset analysis
We applied our method to the dataset from an ER+ breast cancer cell study by Lin et al. (2004). In that dataset, the estrogen-dependent T-47D ER+ breast cancer cell line was treated with 17β-estradiol (E2) and with E2 in combination with the pure anti-estrogen ICI 182 780 (ICI, Faslodex, Fulvestrant). Samples were then harvested on an hourly basis for the first 8 h (0–8 h) and bi-hourly for the next 16 h (10–24 h) for a total of 16 time points under each condition. Experiments were performed on microarrays generated by spotting the Compugen 19 K human oligo library, made by Sigma-Genosys, on poly-L-lysine-coated glass slides.
Here we are interested in the cellular response to the drug ICI, which inhibits E2 signaling through the ER (Howell, 2006). We first selected 55 genes that are reported in the literature to be relevant to breast cancer and responsiveness to ICI (for example, Kuo, 2007; Riggins et al., 2005, 2007). We then applied our DDN analysis to the data under two conditions (E2 versus E2+ICI). The parameters in our algorithm are: threshold T is 0.25, P-value cutoff is 0.01 and K is 2.
Table 2 lists the genes that exhibit significant topological changes in the network identified by DDN analysis. The DDN under these two conditions is shown in Figure 3. The genes identified by the proposed algorithm and their expression results (Table 2) are consistent with published data. For example, XBP1 and BCL2 show strongly decreased expression in response to E2+ICI relative to E2 alone, and both of these genes are known to be induced by E2 (Gompel et al., 2000; Tozlu et al., 2006; Wang et al., 2004).
Table 2.
‘Hot spots’ identified by DDN analysis in breast cancer study (see Supplementary Material for gene annotations)
| Gene | Fold change | P-value (t-test) | Gene | Fold change | P-value (t-test) |
|---|---|---|---|---|---|
| ABCB11 | 2.05E-01 | 8.48E-01 | ESR2 | −3.72E-01 | 8.74E-01 |
| AKT1 | −4.02E+00 | 3.92E-01 | F12 | 4.10E+00 | 3.81E-01 |
| BCAR3 | −4.92E-01 | 9.37E-01 | HOXA10 | 4.14E+00 | 7.89E-01 |
| BCL2 | −2.46E+00 | 2.62E−01 | MAPK1 | −1.35E+00 | 6.09E-01 |
| BIK | −2.75E+00 | 7.52E-01 | MAPK13 | 2.81E+00 | 5.01E-01 |
| BIRC1 | 5.98E-01 | 8.67E-01 | MAPK14 | −1.12E-01 | 9.35E-01 |
| BIRC3 | 2.66E+00 | 5.60E-01 | MAPK3 | 2.42E-01 | 9.67E-01 |
| CAV3 | 4.12E+00 | 7.92E-01 | MAPK4 | 1.55E+00 | 4.84E-01 |
| CGA | 4.19E+00 | 7.00E-01 | MAPK8 | −6.73E+00 | 1.65E-01 |
| COX7A2L | 3.94E+00 | 2.32E-01 | NFKB1 | 3.91E-02 | 9.88E-01 |
| EBAG9 | 2.04E+00 | 6.76E-01 | NFKB2 | −9.15E-02 | 6.92E-01 |
Fig. 3.

DDN between breast cancer cell line treated with E2 and cell line treated with E2+ICI. The red lines represent the connections that exist only in breast cancer cell line treated with E2, and the green lines represent the connections that exist only in breast cancer cell line treated with E2+ICI.
In Figure 3, there are 18 red connections in the DDN, which implies that these connections exist only under E2 condition and disappear after the addition of ICI. Since ICI 182 780 is an ER antagonist, which works both by downregulating and by degrading the ER-alpha, it is plausible that these connections disappear because ICI is blocking or inactivating their connections. For example, as a transcription factor, XBP1 can directly regulate gene expression through binding to its response element (Iwakoshi et al., 2003), or it can act as a co-regulator of other transcription factors, most notably ER-alpha, to enhance their transcriptional activity (Ding et al., 2003; Fang et al., 2004). Because BCL2 contains response elements for both ER-alpha and XBP1 (Gomez et al., 2007; Somai et al., 2003), the connection between XBP1 and BCL2 in the DDN may either be direct or involve ER-alpha as a latent variable, or intervening gene. In direct support of this predicted edge, we have shown that constitutive overexpression of XBP1 in a different breast cancer cell line (MCF-7) led to significantly increased mRNA and protein expression of both ER-alpha and BCL2 and functionally conferred antiestrogen resistance and estrogen-independence (Gomez et al., 2007).
Novel relationships between these genes identified by our DDN analysis will also serve as useful guidance for future studies. For example, BCAR3 is a well-established effector of cell motility, estrogen independence and antiestrogen resistance in ER+breast cancer cell lines (Felekkis et al., 2005; Riggins et al., 2003; Schrecengost et al., 2007; Van Agthoven et al., 2006). Expression of NFKB2 and its activator BCL3 are also associated with estrogen independence in breast cancer cell lines (Pratt et al., 2003), and these nuclear factor κ B subunits appear to be selectively activated in clinical breast cancer (Pratt et al., 2003). However, there is no experimental evidence linking BCAR3 with NFKB2, so the suggestion that these two genes exhibit differential dependence under E2-treated conditions (Fig. 3) provides a starting point for biological studies of their relationship.
Additional relationships that may be completely new to breast cancer are also identified by this method. For example, MAPK8 (also known as JNK1) has been shown to be activated by BIRC1 (also known as NAIP) during its inhibition of caspase-mediated cell death (Sanna et al., 2002). In chronic fatigue syndrome, growth factor receptor signaling can activate MAPK4, which via Ras and/or PI3K can subsequently increase AKT1 activity (Englebienne and Meirleir, 2002). And finally, in B cells from patients with chronic lymphocytic leukemia NFKB1 (p50) homodimers are able to stimulate transcription from the BCL2 promoter through binding to another member of the BCL family (BCL3) (Viatour et al., 2003).
3.3 Human and mouse ESC analysis
ESCs can either maintain their pluripotency by self-renewal or undergo differentiation. The molecular mechanisms controlling ESC self-renewal and differentiation are complex and poorly understood (Sun et al., 2006; Zhan, 2008). ESCs harvested from different species show common characteristics, yet significant differences exist. Thus, cross-species analysis may help to distinguish between fundamental and species-specific mechanisms regulating ESC development (Sun et al., 2007; Zhan et al., 2005). Network biology can provide a new avenue for exploring ESC biology (Barabasi and Oltvai, 2004). Here, we used our new algorithm to conduct a human–mouse comparative analysis of ESCs, identifying evolutionarily divergent sub-networks. We focused our analysis on the cell cycle, a critical process for controlling cell development. In this study, 58 cell-cycle genes were selected for the DDN analysis. The 58 genes are the core components of the cell cycle machinery, and are orthologous between human and mouse cells. The expression profile data for these genes were determined from 18 samples from human ESCs and their earliest differentiation counterparts, embryoid bodies (EBs) and 18 samples from mouse ESCs and EBs, so that our inferred networks were directly related to ESC differentiation. The human ESC and EB expression data were determined from BG01, BG02 and BG03 cell lines in our previous studies using Illumina's BeadArrays (Liu et al., 2006), and from H1 (Sato et al., 2003) and HES2 (E-MEXP-303 of the ArrayExpress database) cell lines using Affymetrix chips. The mouse ESC and EB expression data were determined from V6.5 (GSE3231 of GEO database), R1 (GSE2972) and J1 (GSE3749) cell lines, based on Affymetrix chips. The final datasets contained 9 ESC and 9 EB (14-day differentiated) samples from human and mouse cells, respectively. In the network analysis, we set K to 1, and threshold T to 0.2 and P-value cutoff to 0.01.
Figure 4 shows DDN of the cell cycle between human and mouse cells (see Supplementary Material for gene annotations). The red lines represent the gene connections in human, and the green lines represent the connections in mouse. As shown, CDC25C, DUSP1 and BUB1 exhibit high connectivity on the network of human cells. On the other hand, PLK1, CDK2AP1, CDC20, TFDP1 and CDC5L showed a high connectivity on the network of mouse cells. These results suggest evolutionary divergence across species during ESC development and may provide clues for insights into species-specific mechanism of the cell cycle in controlling ESC self-renewal and differentiation.
Fig. 4.

DDN between human and mouse ES/EB cells. The red lines represent the connections that exist only in human ES/EB cells, and the green lines represent the connections that exist only in mouse ES/EB cells.
4 DISCUSSIONS
In this article, we propose a systematic approach to detect the statistically significant changes in transcriptional networks between two different experimental conditions. We tested our algorithm on simulation data, breast cancer data and ESC data. From the simulation study, we see that the proposed algorithm can capture the topological changes efficiently and accurately, even when the fold change of the expression values of each gene is not statistically significant. This approach utilizes the network structure information and provides an alternative way for biomarker identification. In addition, as knowledge of cellular networks accumulates, many biological databases will expand to contain more useful information. The proposed approach is an open framework, into which biological knowledge in specific applications can be easily incorporated as the local structure learning constraints.
The high level of correlation among genes is a common feature of microarray data. Therefore, we propose a local dependency model that allows multiple predictor sets for each node. Accordingly, a local structure learning algorithm is also represented. Lasso is used to select features for the predictor sets (Tibshirani, 1996), an approach that has been successfully applied to variable selection and graph structure learning (Meinshausen and Buhlmann, 2006). In the linear Gaussian case, under certain conditions, it is proved that the probability of estimating the correct neighborhood converges exponentially to 1, and as a consequence it is possible to obtain a consistent estimation of the full edge set (Meinshausen and Buhlmann, 2006). However, in microarray data, the so-called irrepresentable condition (Zhao and Yu, 2006) or the neighborhood stability assumption (Meinshausen and Buhlmann, 2006) can easily be violated in the presence of highly correlated genes. Some modified algorithms have been proposed to deal with the highly correlated cases, for example, elastic net (Zou and Hastie, 2005) and network-constrained regularization (Li and Li, 2008), both of which tend to group highly correlated predictors in the regression process. However, these two approaches are not suitable for our problem, because the grouping of highly correlated variables can be different under two conditions and this makes the later statistical testing problematic. The local structure learning algorithm proposed here attempts to alleviate the effects of the highly correlated gene expression data and to preserve local structure information for further statistical testing.
Some issues are worth further exploration. In this article, only linear relationships are considered. How non-linear relationships should be modeled efficiently and correctly, remains a difficult problem. Second, since many cellular reactions take place in the genome, transcriptome and proteome, it is essential to construct pathways by integrating data from heterogeneous sources.
In sum, this article presents a new approach to extract knowledge of a biological network by emphasizing the dynamic nature of cellular networks and utilizing a network's structural information. It also provides an alternative and promising approach to identify possible biomarkers and drug targets.
Funding: National Institutes of Health (CA109872, EB000830, CA096483, CA86323 and NS29525, partial); Department of Defense Breast Cancer Research Program BC030280. IRP/NIA/NIH (to H.L. and M.Z.).
Conflict of Interest: none declared.
Supplementary Material
REFERENCES
- Barabasi AL, Oltvai ZN. Network biology: understanding the cell's functional organization. Nat. Rev. Genet. 2004;5:101–113. doi: 10.1038/nrg1272. [DOI] [PubMed] [Google Scholar]
- Beyer A, et al. Integrating physical and genetic maps: from genomes to interaction networks. Nat. Rev. Genet. 2007;8:699–710. doi: 10.1038/nrg2144. [DOI] [PMC free article] [PubMed] [Google Scholar]
- Choi JK, et al. Differential coexpression analysis using microarray data and its application to human cancer. Bioinformatics. 2005;21:4348–4355. doi: 10.1093/bioinformatics/bti722. [DOI] [PubMed] [Google Scholar]
- Clarke R, et al. The properties of high-dimensional data spaces: implications for exploring gene and protein expression data. Nat. Rev. Cancer. 2008;8:37–49. doi: 10.1038/nrc2294. [DOI] [PMC free article] [PubMed] [Google Scholar]
- Ding LH, et al. Ligand-independent activation of estrogen receptor alpha by XBP-1. Nucleic Acids Res. 2003;31:5266–5274. doi: 10.1093/nar/gkg731. [DOI] [PMC free article] [PubMed] [Google Scholar]
- Efron B, Tibshirani R. An Introduction to the Bootstrap. New York: Chapman & Hall; 1993. [Google Scholar]
- Efron B, et al. Least angle regression. Ann. Stat. 2004;32:407–451. [Google Scholar]
- Englebienne P, Meirleir K. Chronic Fatigue Syndrome: A Biological Approach. Boca Raton: CRC Press; 2002. [Google Scholar]
- Fang Y, et al. XBP-1 increases ER alpha transcriptional activity through regulation of large-scale chromatin unfolding. Biochem. Biophys. Res. Commun. 2004;323:269–274. doi: 10.1016/j.bbrc.2004.08.100. [DOI] [PubMed] [Google Scholar]
- Felekkis KN, et al. AND-34 activates phosphatidylinositol 3-kinase and induces anti-estrogen resistance in a SH2 and GDP exchange factor-like domain-dependent manner. Mol. Cancer Res. 2005;3:32–41. [PubMed] [Google Scholar]
- Friedman N. Inferring cellular networks using probabilistic graphical models. Science. 2004;303:799–805. doi: 10.1126/science.1094068. [DOI] [PubMed] [Google Scholar]
- Friedman N, et al. Using Bayesian networks to analyze expression data. J. Comput. Biol. 2000;7:601–620. doi: 10.1089/106652700750050961. [DOI] [PubMed] [Google Scholar]
- Fuller TF, et al. Weighted gene coexpression network analysis strategies applied to mouse weight. Mamm. Genome. 2007;18:463–472. doi: 10.1007/s00335-007-9043-3. [DOI] [PMC free article] [PubMed] [Google Scholar]
- Gomez BP, et al. Human X-Box binding protein-1 confers both estrogen independence and antiestrogen resistance in breast cancer cell lines. FASEB J. 2007;21:4013–4027. doi: 10.1096/fj.06-7990com. [DOI] [PubMed] [Google Scholar]
- Gompel A, et al. Hormonal regulation of apoptosis in breast cells and tissues. Steroids. 2000;65:593–598. doi: 10.1016/s0039-128x(00)00172-0. [DOI] [PubMed] [Google Scholar]
- Heckerman D, et al. Dependency networks for inference, collaborative filtering, and data visualization. J. Mach. Learn. Res. 2000;1:49–75. [Google Scholar]
- Hood L, et al. Systems biology and new technologies enable predictive and preventative medicine. Science. 2004;306:640–643. doi: 10.1126/science.1104635. [DOI] [PubMed] [Google Scholar]
- Howell A. Pure oestrogen antagonists for the treatment of advanced breast cancer. Endocr. Relat. Cancer. 2006;13:689–706. doi: 10.1677/erc.1.00846. [DOI] [PubMed] [Google Scholar]
- Husmeier D. Sensitivity and specificity of inferring genetic regulatory interactions from microarray experiments with dynamic Bayesian networks. Bioinformatics. 2003;19:2271–2282. doi: 10.1093/bioinformatics/btg313. [DOI] [PubMed] [Google Scholar]
- Iwakoshi NN, et al. The X-box binding protein-1 transcription factor is required for plasma cell differentiation and the unfolded protein response. Immunol. Rev. 2003;194:29–38. doi: 10.1034/j.1600-065x.2003.00057.x. [DOI] [PubMed] [Google Scholar]
- Kim H, et al. Unraveling condition specific gene transcriptional regulatory networks in Saccharomyces cerevisiae. BMC Bioinformatics. 2006;7:165. doi: 10.1186/1471-2105-7-165. [DOI] [PMC free article] [PubMed] [Google Scholar]
- Kitano H. Systems biology: a brief overview. Science. 2002;295:1662–1664. doi: 10.1126/science.1069492. [DOI] [PubMed] [Google Scholar]
- Kostka D, Spang R. Finding disease specific alterations in the co-expression of genes. Bioinformatics. 2004;20:i194–i199. doi: 10.1093/bioinformatics/bth909. [DOI] [PubMed] [Google Scholar]
- Kuo MT. Breast Cancer Chemosensitivity. Berlin: Springer; 2007. Roles of multidrug resistance genes in breast cancer chemoresistance; pp. 23–30. [DOI] [PubMed] [Google Scholar]
- Li C, Li H. Network-constrained regularization and variable selection for analysis of genomic data. Bioinformatics. 2008;24:1175–1182. doi: 10.1093/bioinformatics/btn081. [DOI] [PubMed] [Google Scholar]
- Li H, et al. Inferring regulatory networks. Front. Biosci. 2008;13:263–275. doi: 10.2741/2677. [DOI] [PubMed] [Google Scholar]
- Liao JC, et al. Network component analysis: Reconstruction of regulatory signals in biological systems. Proc. Natl Acad. Sci. USA. 2003;100:15522–15527. doi: 10.1073/pnas.2136632100. [DOI] [PMC free article] [PubMed] [Google Scholar]
- Lin CY, et al. Discovery of estrogen receptor alpha target genes and response elements in breast tumor cells. Genome Biol. 2004;5:R66. doi: 10.1186/gb-2004-5-9-r66. [DOI] [PMC free article] [PubMed] [Google Scholar]
- Liu CC, et al. Topology-based cancer classification and related pathway mining using microarray data. Nucleic Acids Res. 2006;34:4069–4080. doi: 10.1093/nar/gkl583. [DOI] [PMC free article] [PubMed] [Google Scholar]
- Liu Y, et al. Genome wide profiling of human embryonic stem cells (hESCs), their derivatives and embryonal carcinoma cells to develop base profiles of U.S. Federal government approved hESC lines. BMC Dev. Biol. 2006;6:20. doi: 10.1186/1471-213X-6-20. [DOI] [PMC free article] [PubMed] [Google Scholar]
- Luscombe NM, et al. Genomic analysis of regulatory network dynamics reveals large topological changes. Nature. 2004;431:308–312. doi: 10.1038/nature02782. [DOI] [PubMed] [Google Scholar]
- Meinshausen N, Buhlmann P. High-dimensional graphs and variable selection with the Lasso. Ann. Stat. 2006;34:1436–1462. [Google Scholar]
- Pratt MAC, et al. Estrogen withdrawal-induced NF-kappa B activity and Bcl-3 expression in breast cancer cells: roles in growth and hormone independence. Mol. Cell. Biol. 2003;23:6887–6900. doi: 10.1128/MCB.23.19.6887-6900.2003. [DOI] [PMC free article] [PubMed] [Google Scholar]
- Qiu P, et al. Ensemble dependence model for classification and prediction of cancer and normal gene expression data. Bioinformatics. 2005;21:3114–3121. doi: 10.1093/bioinformatics/bti483. [DOI] [PubMed] [Google Scholar]
- Qiu P, et al. Dependence network modeling for biomarker identification. Bioinformatics. 2007;23:198–206. doi: 10.1093/bioinformatics/btl553. [DOI] [PubMed] [Google Scholar]
- Rangel C, et al. Modeling T-cell activation using gene expression profiling and state-space models. Bioinformatics. 2004;20:1361–1372. doi: 10.1093/bioinformatics/bth093. [DOI] [PubMed] [Google Scholar]
- Riggins RB, et al. Synergistic promotion of c-Src activation and cell migration by Cas and AND-34/BCAR3. J. Biol. Chem. 2003;278:28264–28273. doi: 10.1074/jbc.M303535200. [DOI] [PubMed] [Google Scholar]
- Riggins RB, et al. Vitamins and Hormones - Advances in Research and Applications. Vol. 71. San Diego: Elsevier Academic Press Inc; 2005. Antiestrogens, aromatase inhibitors, and apoptosis in breast cancer; pp. 201–237. [DOI] [PubMed] [Google Scholar]
- Riggins RB, et al. Pathways to tamoxifen resistance. Cancer Lett. 2007;256:1–24. doi: 10.1016/j.canlet.2007.03.016. [DOI] [PMC free article] [PubMed] [Google Scholar]
- Sanna MG, et al. IAP suppression of apoptosis involves distinct mechanisms: the TAK1/JNK1 signaling cascade and caspase inhibition. Mol. Cell. Biol. 2002;22:1754–1766. doi: 10.1128/MCB.22.6.1754-1766.2002. [DOI] [PMC free article] [PubMed] [Google Scholar]
- Sato N, et al. Molecular signature of human embryonic stem cells and its comparison with the mouse. Dev. Biol. 2003;260:404–413. doi: 10.1016/s0012-1606(03)00256-2. [DOI] [PubMed] [Google Scholar]
- Schrecengost RS, et al. Breast cancer antiestrogen resistance-3 expression regulates breast cancer cell migration through promotion of p130(Cas) membrane localization and membrane ruffling. Cancer Res. 2007;67:6174–6182. doi: 10.1158/0008-5472.CAN-06-3455. [DOI] [PMC free article] [PubMed] [Google Scholar]
- Segal E, et al. Module networks: identifying regulatory modules and their condition-specific regulators from gene expression data. Nat. Genet. 2003;34:166–176. doi: 10.1038/ng1165. [DOI] [PubMed] [Google Scholar]
- Shmulevich I, et al. Probabilistic Boolean networks: a rule-based uncertainty model for gene regulatory networks. Bioinformatics. 2002;18:261–274. doi: 10.1093/bioinformatics/18.2.261. [DOI] [PubMed] [Google Scholar]
- Somai S, et al. Antiestrogens are pro-apoptotic in normal human breast epithelial cells. Int. J. Cancer. 2003;105:607–612. doi: 10.1002/ijc.11147. [DOI] [PubMed] [Google Scholar]
- Sun Y, et al. Mechanisms controlling embryonic stem cell self-renewal and differentiation. Crit. Rev. Eukaryot. Gene Expr. 2006;16:211–231. doi: 10.1615/critreveukargeneexpr.v16.i3.20. [DOI] [PubMed] [Google Scholar]
- Sun Y, et al. Cross-species transcriptional profiles establish a functional portrait of embryonic stem cells. Genomics. 2007;89:22–35. doi: 10.1016/j.ygeno.2006.09.010. [DOI] [PMC free article] [PubMed] [Google Scholar]
- Tibshirani R. Regression shrinkage and selection via the Lasso. J. R. Stat. Soc. Ser. B Methodol. 1996;58:267–288. [Google Scholar]
- Tozlu S, et al. Identification of novel genes that co-cluster with estrogen receptor alpha in breast tumor biopsy specimens, using a large-scale real-time reverse transcription-PCR approach. Endocr. Relat. Cancer. 2006;13:1109–1120. doi: 10.1677/erc.1.01120. [DOI] [PubMed] [Google Scholar]
- Van Agthoven T, et al. Functional identification of genes causing estrogen independence. Breast Cancer Res. Treat. 2006;100:S37–S37. doi: 10.1007/s10549-008-9969-5. [DOI] [PubMed] [Google Scholar]
- Van den Bulcke T, et al. SynTReN: a generator of synthetic gene expression data for design and analysis of structure learning algorithms. BMC Bioinformatics. 2006;7:43. doi: 10.1186/1471-2105-7-43. [DOI] [PMC free article] [PubMed] [Google Scholar]
- Viatour P, et al. NF-kappa B2/p100 induces Bcl-2 expression. Leukemia. 2003;17:1349–1356. doi: 10.1038/sj.leu.2402982. [DOI] [PubMed] [Google Scholar]
- Wang DY, et al. Identification of estrogen-responsive genes by complementary deoxyribonucleic acid microarray and characterization of a novel early estrogen-induced gene: EEIG1. Mol. Endocrinol. 2004;18:402–411. doi: 10.1210/me.2003-0202. [DOI] [PubMed] [Google Scholar]
- Watson M. CoXpress: differential co-expression in gene expression data. BMC Bioinformatics. 2006;7:509. doi: 10.1186/1471-2105-7-509. [DOI] [PMC free article] [PubMed] [Google Scholar]
- Wei Z, Li H. A Markov random field model for network-based analysis of genomic data. Bioinformatics. 2007;23:1537–1544. doi: 10.1093/bioinformatics/btm129. [DOI] [PubMed] [Google Scholar]
- Zhan M. Genomic studies to explore self-renewal and differentiation properties of embryonic stem cells. Front Biosci. 2008;13:276–283. doi: 10.2741/2678. [DOI] [PubMed] [Google Scholar]
- Zhan M, et al. Conservation and variation of gene regulation in embryonic stem cells assessed by comparative genomics. Cell Biochem. Biophys. 2005;43:379–405. doi: 10.1385/CBB:43:3:379. [DOI] [PubMed] [Google Scholar]
- Zhao P, Yu B. On model selection consistency of Lasso. J. Mach. Learn. Res. 2006;7:2541–2563. [Google Scholar]
- Zou H, Hastie T. Regularization and variable selection via the elastic net. J. R. Stat. Soc. Ser. B Stat. Methodol. 2005;67:301–320. [Google Scholar]
Associated Data
This section collects any data citations, data availability statements, or supplementary materials included in this article.