Abstract
It is common clinical practice to obtain bone mass measurement at both the hip and spine to evaluate for osteoporosis. With aging, degenerative changes in the lumbar spine may elevate the bone mineral density (BMD) results giving false assurances that the fracture risk at the spine is low. We examined the association of spine osteoarthritis and bone mineral density in 1082 community-dwelling ambulatory older women aged 50–96 years who participated in a 1992–1996 osteoporosis research clinic visit. Bone mineral density (BMD) was measured at the hip, PA and lateral lumbar spine using dual energy x-ray absorptiometry (DXA). Spine osteoarthritis was identified on the PA lumbar spine DXA images by a musculoskeletal radiologist. Forty percent of women had evidence of spine osteoarthritis (OA). Women with spine OA had mean age of 77.4 years (95% CI, 76.5–78.2), were significantly older than women without (mean age 66.8; 95% CI, 65.9–67.7), and were more likely to have prevalent radiographic fractures (14.2% vs. 9.5%, p< 0.05). Age-adjusted BMD at the femoral neck, total hip, PA spine, and lateral spine was significantly higher in women with spine OA. Women with spine OA were more likely to have osteoporosis by WHO classification at the femoral neck and total hip than those without spine OA, but less likely based on the PA spine site (14.4% vs 24.5%). Despite higher BMD levels, women with OA of the lumbar spine had higher prevalence of osteoporosis at the hip and radiographic vertebral fractures. In elderly women 65 years and older who are likely to have spine OA, DXA measurement of the spine may be not useful in assessing fracture risk and DXA of the hip is recommended for identification of osteoporosis.
Key Indexing Terms: Spine osteoarthritis, bone mineral density, osteoporosis, elderly
Introduction
The current standard of care in clinical practice to evaluate for osteoporosis is dual energy x-ray absorptiometry (DXA) of both the hip and PA view of the lumbar spine(1–6). However, scanning both sites in every patient may not be useful. With aging, degenerative changes in the lumbar spine may elevate the bone mineral density (BMD) results giving false assurances that the fracture risk at the spine is low(7). The lateral view of the lumbar spine by DXA may eliminate the posterior elements and degenerative changes that are included in the PA view. But in the clinical setting, lateral spine DXA is not recommended as a measurement site for diagnosis of osteoporosis(3,8).
We examined the association of spine osteoarthritis and bone mineral density in 1082 community-dwelling ambulatory women aged 50–97 years; and compared the PA and lateral lumbar spine BMD in women with and without spine OA.
Methods
From May 1992 to December 1996, 1082 ambulatory white women aged 30–97 years from a geographically defined middle-class community, Rancho Bernardo, California, participated in a study of osteoporosis. The University Human Subjects Committee approved the study and all participants gave informed consent. At the clinic visit, all participants completed a standardized questionnaire that included medical history, health habits, dietary supplements, and medications. Alcohol use was categorized as drinking three or more days per week, and regular exercise was defined as exercise three or more times per week. To validate medication use, the clinic nurse examined all pills and prescriptions brought to the clinic. Height and weight were measured with subjects wearing light clothing and no shoes. As a measure of obesity, body mass index (BMI) was calculated as weight in kilograms divided by the square of height in meters (kg/m2).
Lateral thoracic (T7–T12) and lumbar spine (L1–L4) radiographs were read by one musculoskeletal radiologist for prevalent vertebral fractures using a modified semiquantitative grading scheme(9). Each vertebral level was defined by a fracture/nonfracture dichotomy. Several months after the first reading, 60 radiographs were reread by the same radiologist without knowledge of his first reading, with 95–100% concordance at each vertebral level. The clinical fractures were self-reported and included fractures of hip, spine, wrist, hand, forearm, humerus, clavicle, ribs, pelvis, femoral shaft, knee, tibia, fibula, and foot; 95% of reports for fractures of the hip, wrist, arm, clavicle, and leg were validated by medical records.
Bone mineral density (g/cm2) was measured at the hip, posteroanterior (PA) and lateral lumbar spine by certified radiology technicians using dual energy x-ray absorptiometry (DXA, Hologic QDR-2000, Bedford, MA). Scans were standardized daily against a calibration phantom. The precision error was ≤1.5% for the hip, and ≤1.0% for the spine. Osteoporosis was defined by BMD levels, according to the World Health Organization (WHO) criteria, as ≥ 2.5 standard deviations (SD) below young adult mean (10); and used normative data from NHANES for the hip DXA and Hologic female normals for spine DXA.
Spine OA was classified by a musculoskeletal radiologist’s review of the PA lumbar spine DXA print out images. Spine OA was identified by presence of disc space narrowing with vertebral endplate sclerosis, osteophyte formation at the vertebral body margins, or increased density with osteophytosis. A total of 60 lumbar radiographs were read for the presence of OA by the same radiologist without knowledge of his DXA reading with 100% concordance.
All analyses were performed using the Statistical Analysis System (SAS Institute, Inc., Cary, NC). Age-adjusted differences in proportions were calculated using the Mantel-Haenszel statistic with a two-tailed test of significance (alpha=p≤0.05). Analyses were stratified by the presence of spine OA. All BMD levels were normally distributed making transformations unnecessary. Analysis of covariance was calculated to determine differences in mean BMD levels by spine OA categories while controlling for age, BMI, thyroid hormone and current estrogen use.
Results
Forty percent of women had evidence of osteoarthritis (OA) in the lumbar spine. As shown in Table 1, women with spine OA had mean age of 77.4 years (95% CI, 76.5–78.2) and were significantly older than women without spinal OA (mean age 66.8; 95% CI, 65.9–67.7). Women with spine OA in comparison with those without spine OA were less likely to use current estrogen (38.4% vs. 47.4%, p< 0.05) and were more likely to use thyroid hormone (25.1% vs. 18.7%, p< 0.05).
Table 1.
Characteristics of women by osteoarthritis at PA spine: Rancho Bernardo, CA, 1992–1996.
| OA at PA spine | ||||
|---|---|---|---|---|
| Covariate | No (n=645) | Yes (n=437) | ||
| Mean (se) | (95% CI) | Mean (se) | (95%CI) | |
| Age (yrs) | 66.8 (0.45) | (65.9–67.7) | 77.4 (0.42) | (76.5–78.2) * |
| BMI (kg/m2) | 24.5 (0.16) | (24.2–24.9) | 25.0 (0.20) | (24.6–25.4) |
| (n=402) | (n=270) | |||
| Alcohol use (gm/wk) (not normally distr) | 77.3 (3.40) | (70.6–84.0) | 78.6 (4.45) | (69.9–87.4) |
| (n=356) | (n=292) | |||
| Height loss (in.) (not normally distr) | 1.04 (0.06) | (0.93–1.16) | 1.94 (0.08) | (1.78–2.09) * |
| Percentage | ||||
| Current estrogen use | 47.4 | 38.4* | ||
| Current smoking | 8.6 | 6.2 | ||
| Drink alcohol | 52.8 | 51.8 | ||
| Exercise 3X per week | 66.7 | 69.9 | ||
| Calcium supplements | 44.1 | 48.9 | ||
| Thyroid hormone use | 18.7 | 25.1* | ||
| Oral steroid use | 1.4 | 1.8 | ||
| Thiazide use | 4.5 | 3.7 | ||
| Vertebral Fracture (radiographic) | 9.5 | 14.2* | ||
| Clinical Fracture (any site) | 18.0 | 22.0 | ||
p<.05
Women with spine OA had significantly greater height loss: 2 inches vs.1 inch (p< 0.05). Prevalent radiographic vertebral fractures were present in 14.2% of women with spine OA compared with 9.5% in those without spine OA (p< 0.05). A history of clinical fractures was validated in 22% of women with spine OA and 18% of those without spine OA (p value NS).
As displayed in Figure 1, the prevalence of spine OA was higher with aging. From 50 to 64 years of age, 14% had evidence of spine OA. With each 5-year age grouping, the percentage of spine OA was greater: age 65–69, 25.5%; 70–74, 36.1%, 75–79, 59.5%, and 80+, 66.6%.
Figure 1.
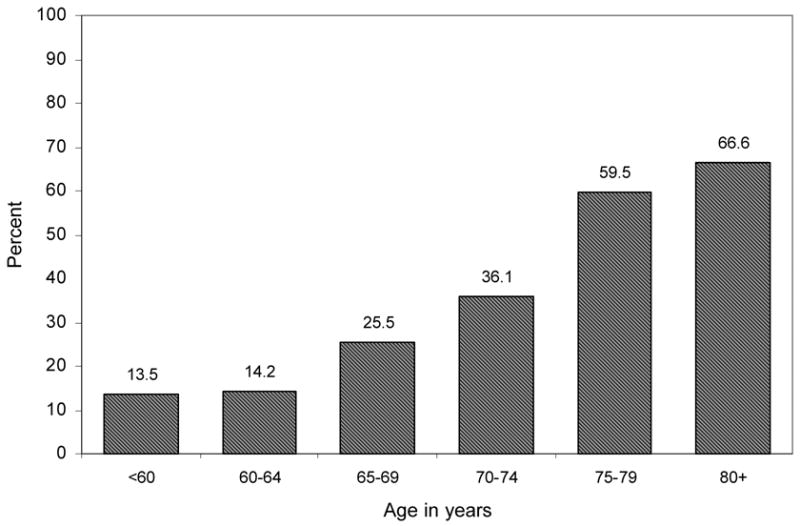
Percentage of women with osteoarthritis at the spine by age: Rancho Bernardo, CA, 1992–1996.
Mean BMD at the femoral neck and total hip unadjusted were lower in women with spine OA in comparison to those without. However after adjusting for age alone, or age, BMI, current estrogen and thyroid hormone use, mean femoral neck BMD and total hip BMD were significantly higher in women with spine OA. At the PA spine and lateral spine, BMDs unadjusted, adjusted for age alone, and age, body mass index, current estrogen and thyroid hormone use were significantly higher at all sites in women with spine OA (Table 2).
Table 2.
Mean BMD by osteoarthritis at PA spine: Rancho Bernardo, CA, 1992–1996.
| Osteoarthritis at spine? | |||||
|---|---|---|---|---|---|
| No (n=645) | Yes (n=437) | ||||
| Site | mean (se) | (95% CI) | mean (se) | (95% CI) | p-value |
| (n=619) | (n=422) | ||||
| Femoral Neck | |||||
| unadjusted | 0.677 (.005) | (0.667–0.687) | 0.649 (.006) | (0.637–0.661) | .0006 |
| age-adjusted | 0.652 (.005) | (0.643–0.661) | 0.686 (.006) | (0.675–0.697) | <.0001 |
| age+estrogen-adjusted | 0.652 (.005) | (0.643–0.661) | 0.686 (.006) | (0.674–0.697) | <.0001 |
| age+est+bmi+thyr-adj* | 0.655 (.004) | (0.646–0.664) | 0.682 (.006) | (0.671–0.693) | .0003 |
| (n=619) | (n=422) | ||||
| Total Hip | |||||
| unadjusted | 0.819 (.006) | (0.808–0.830) | 0.784 (.007) | (0.770–0.798) | .0001 |
| age-adjusted | 0.791 (.005) | (0.780–0.801) | 0.825 (.007) | (0.812–0.838) | .0001 |
| age+estrogen-adjusted | 0.791 (.005) | (0.781–0.801) | 0.825 (.006) | (0.812–0.837) | .0001 |
| age+est+bmi+thyr-adj* | 0.795 (.005) | (0.786–0.805) | 0.819 (.006) | (0.807–0.830) | .0045 |
| (n=615) | (n=437) | ||||
| PA spine | |||||
| unadjusted | 0.917 (.007) | (0.903–0.931) | 1.008 (.008) | (0.991–1.024) | < .0001 |
| age-adjusted | 0.893 (.007) | (0.879–0.907) | 1.042 (.009) | (1.025–1.059) | < .0001 |
| age+estogen-adjusted | 0.893 (.007) | (0.880–0.907) | 1.041 (.008) | (1.024–1.057) | < .0001 |
| age+est+bmi+thyr-adj* | 0.898 (.007) | (0.885–0.911) | 1.034 (.008) | (1.018–1.050) | < .0001 |
| (n=610) | (n=434) | ||||
| Lateral spine | |||||
| unadjusted | 0.603 (.005) | (0.593–0.614) | 0.631 (.006) | (0.619–0.644) | .0007 |
| age-adjusted | 0.580 (.005) | (0.570–0.590) | 0.664 (.006) | (0.652–0.676) | < .0001 |
| age+estogen-adjusted | 0.581 (.005) | (0.571–0.590) | 0.664 (.006) | (0.652–0.675) | < .0001 |
| age+est+bmi+thyr-adj* | 0.582 (.005) | (0.572–0.592) | 0.662 (.006) | (0.650–0.674) | < .0001 |
adjusted for age, body mass index, current estrogen and thyroid hormone use
The prevalence of osteoporosis by measurement site and age is displayed in Figure 2. For the femoral neck and total hip sites, prevalence of osteoporosis is higher with advancing age as expected. However at the PA spine, the prevalence of osteoporosis from 60 to 79 years is flat at approximately 20%.
Figure 2.
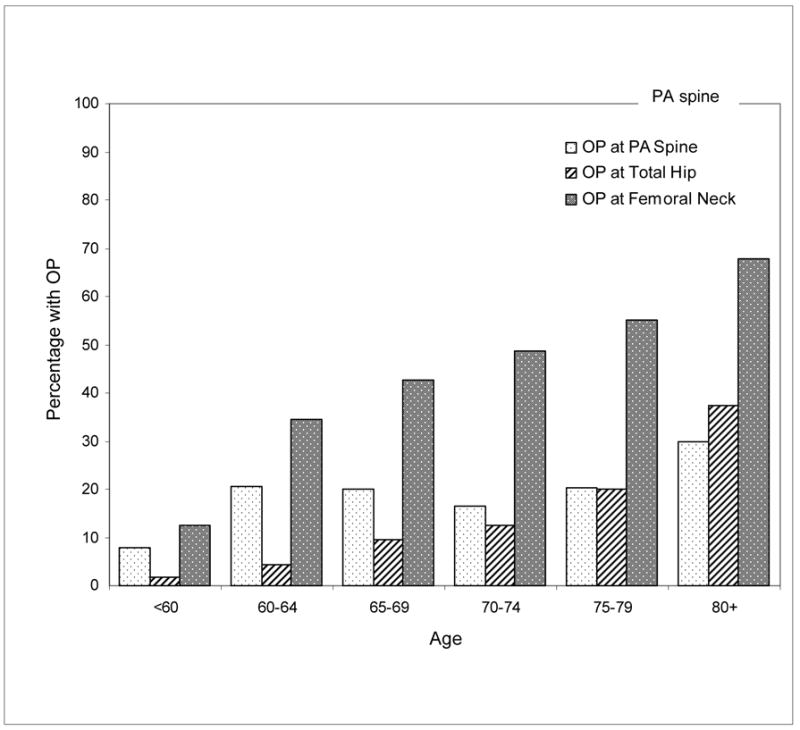
Percentage of women with osteoporosis (OP) based on mean BMD at PA spine, total hip and femoral neck by age: Rancho Bernardo, CA, 1992–1996.
As shown in Figure 3, only 10.9% of women with spine OA were classified as normal at the femoral neck, half (50.7%) were osteoporotic and 38.4% osteopenic. In those without spine OA at the femoral neck, 17.9% were normal, 39.3% osteopenic, and 43.4% osteoporotic. At the total hip 22.5% of women with spine OA had osteoporosis versus 13.9% of women without spine OA. In contrast, 14.4% of women with spine OA had osteoporosis based on the PA spine site versus 24.5% of those without spine OA. If the BMD criteria for osteoporosis was applied to the lateral spine, similar proportions would be identified as osteoporotic: 50.8% women with spine OA and 56.0% women without spine OA.
Figure 3.
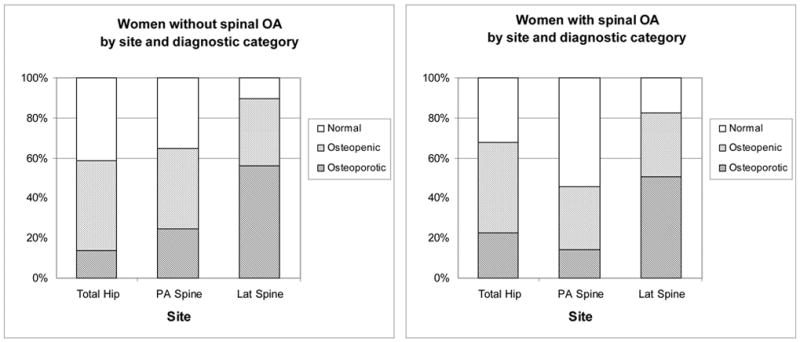
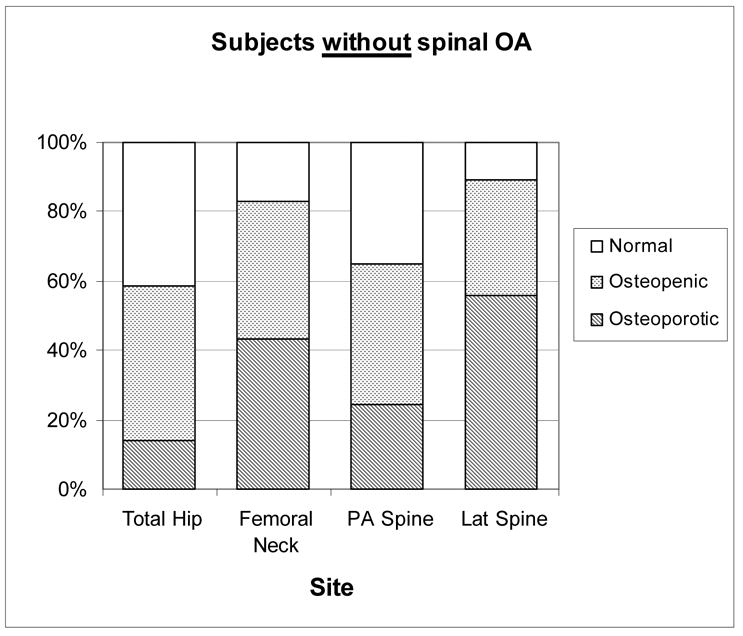
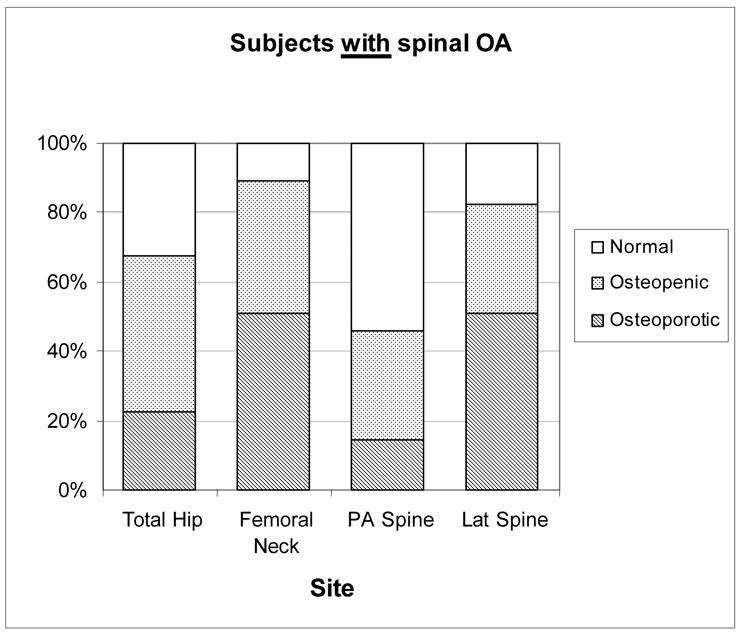
WHO diagnostic category by measurement site in women based on spine OA status: Rancho Bernardo, CA, 1992–1996.
Discussion
Overall, 40% of these community-dwelling women had evidence of spine OA, and 60% or more of those age 70 and older had spine OA. Women with spine OA had more prevalent radiographic vertebral fracture than those without spine OA (14.2% vs. 9.5%, p< 0.05). In addition, 22.5% of women with spine OA had BMD-defined osteoporosis at the hip and 14.4% had BMD-defined osteoporosis at the PA spine. The expected increase in prevalence of osteoporosis at the spine with advancing age was not observed in contrast to the femoral neck and total hip sites. Despite higher BMD levels, women with OA of the lumbar spine had higher prevalence of osteoporosis at the hip and radiographic vertebral fractures.
A meta-analysis done by Marshall and others demonstrated site-specific measurements were the best predictor of fracture at that site(11). Therefore, measurement of the spine would be the best assessment for vertebral fracture risk. Based on the present study in elderly women, use of PA spine BMD would underestimate vertebral fracture risk, therefore the hip site is recommended for fracture risk assessment. The meta-analysis and other studies have also shown the value of hip BMD in prediction of fractures at other sites. To our knowledge, no age cut-off has been recommended for obtaining hip DXA only.
Faulkner and colleagues(12) showed discordance in patient classification using T-scores at different measurement sites. The percent of the population aged 60 with T-scores below −2.5 was 6% at total hip, 14% PA spine and 38% lateral spine. In another study of 120 community-dwelling women (mean age 70 years), Greenspan and others (13) found that osteoporosis varied from about 20% at the total hip to 66% at the lateral lumbar spine. In our study, 54% of the women had T-scores below −2.5 at the lateral spine.
Although the effect of degenerative changes of spine appears to be removed in the spine lateral projection, lateral spine DXA is not routinely performed in clinical practice and there are no established guidelines for diagnosis(3,6,8,14,15). Clearly, a different threshold point would be needed since lateral spine BMD would over estimate the diagnosis of osteoporosis. The WHO criteria used for diagnosis of osteoporosis is applicable for the hip, PA spine, and forearm sites only, not the lateral spine(3,8,10,16). In addition, the accuracy and precision error of the lateral spine measurement of BMD is higher than the posteroanterior measurement and the hip(17).
Previous studies have reported conflicting results about the association between spine OA and osteoporotic fractures(18,19). In the present study, women with spinal OA in contrast to those without had a higher prevalence of vertebral fractures despite having higher multiply-adjusted BMD at the hip and spine. These findings are in agreement with others (18) that spine osteoarthritis does not protect the spine from developing osteoporosis. In contrast, the Chingford study found a reduced risk of fracture in those women with lumbar spine OA, but not those with hip OA, even though they had higher BMD(19).
One limitation of this study is that the analysis was limited to Caucasian women; therefore the findings may not be relevant to men or other ethnic groups. However, these degenerative changes with aging occur in nonwhite ethnic groups and in men are reported to have an even higher prevalence than in white women(20). All degenerative changes were classified as “spinal OA,” although the underlying cause may be due to other causes such as degenerative disc disease. Nevertheless, the resultant effect on spine BMD is the same. The scans were evaluated prior to the Position Development Conferences and the updated 2005 Official Positions of the International Society for Clinical Densitometry.
With aging, degenerative changes in the lumbar spine may elevate BMD results giving false assurances that the fracture risk at the spine is low. These data confirm that PA spine BMD should be interpreted with caution in elderly women, and strongly suggest that the hip BMD measurement site should be the primary site for assessing risk of fracture in women 65 years of age and older. In addition, the clinician should interpret the results of bone density in combination with other risk factors for fractures. Further research is needed to define lateral spine values differentiating between normal, osteopenic, and osteoporosis. In summary, elderly women aged 65 years and older who are likely to have spine OA, DXA measurement of the spine may be not useful in assessing fracture risk and DXA of the hip is recommended for identification of osteoporosis.
Footnotes
Requests for Reprints: Elizabeth Barrett-Connor, MD, Department of Community and Family Medicine, University of California, San Diego, 9500 Gilman Drive, La Jolla, CA 92093-0607.
Grant Support: AG 07181 from the National Institute on Aging.
References
- 1.Diagnosis of osteoporosis in men, premenopausal women, and children. J Clin Densitom. 2004;7(1):17–26. doi: 10.1385/jcd:7:1:17. [DOI] [PubMed] [Google Scholar]
- 2.Indications and reporting for dual-energy x-ray absorptiometry. J Clin Densitom. 2004;7(1):37–44. doi: 10.1385/jcd:7:1:37. [DOI] [PubMed] [Google Scholar]
- 3.Leib ES, Lewiecki EM, Binkley N, Hamdy RC. Official positions of the International Society for Clinical Densitometry. J Clin Densitom. 2004;7(1):1–6. doi: 10.1385/jcd:7:1:1. [DOI] [PubMed] [Google Scholar]
- 4.Lewiecki EM, Kendler DL, Kiebzak GM, Schmeer P, Prince RL, El-Hajj Fuleihan G, Hans D. Special report on the official positions of the International Society for Clinical Densitometry. Osteoporos Int. 2004;15(10):779–84. doi: 10.1007/s00198-004-1677-3. [DOI] [PubMed] [Google Scholar]
- 5.Leib ES, Lenchik L, Bilezikian JP, Maricic MJ, Watts NB. Position statements of the International Society for Clinical Densitometry: methodology. J Clin Densitom. 2002;5(Suppl):S5–10. doi: 10.1385/jcd:5:3s:s05. [DOI] [PubMed] [Google Scholar]
- 6.Khan AA, Brown J, Faulkner K, Kendler D, Lentle B, Leslie W, Miller PD, Nicholson L, Olszynski WP, Watts NB. Standards and guidelines for performing central dual X-ray densitometry from the Canadian Panel of International Society for Clinical Densitometry. J Clin Densitom. 2002;5(4):435–45. doi: 10.1385/jcd:5:4:435. [DOI] [PubMed] [Google Scholar]
- 7.Jones G, Nguyen T, Sambrook PN, Kelly PJ, Eisman JA. A longitudianal study of the effect of spinal degenerative disease on bone density in the elderly. J Rheum. 1995;22(5):932–936. [PubMed] [Google Scholar]
- 8.Lenchik L, Leib ES, Hamdy RC, Binkley NC, Miller PD, Watts NB. Executive summary International Society for Clinical Densitometry position development conference Denver, Colorado July 20–22, 2001. J Clin Densitom. 2002;5(Suppl):S1–3. doi: 10.1385/jcd:5:3s:s01. [DOI] [PubMed] [Google Scholar]
- 9.Genant H, Wu C, Kuijk Cv, Nevitt M. Vertebral fracture assessment using a semi-quantitative technique. J Bone Miner Res. 1993;8:1137–1148. doi: 10.1002/jbmr.5650080915. [DOI] [PubMed] [Google Scholar]
- 10.World Health Organization Study Group. Assessment of fracture risk and its application to screening for postmenopausal osteoporosis. WHO Tech Rep Ser. 1994;843:1–129. [PubMed] [Google Scholar]
- 11.Marshall D, Johnell O, Wedel H. Meta-analysis of how well measures of bone mineral density predict occurrence of osteoporotic fractures. Bmj. 1996;312(7041):1254–9. doi: 10.1136/bmj.312.7041.1254. [DOI] [PMC free article] [PubMed] [Google Scholar]
- 12.Faulkner KG, Stetten Ev, Miller PD. Discordance in patient classification using T-scores. J Clin Densitometry. 1999;2:343–350. doi: 10.1385/jcd:2:3:343. [DOI] [PubMed] [Google Scholar]
- 13.Greenspan SL, Maitland-Ramsey L, Myers E. Classification of osteoporosis in the elderly is dependent on site-specific analysis. Calcif Tissue Int. 1996;58:409–414. doi: 10.1007/BF02509439. [DOI] [PubMed] [Google Scholar]
- 14.Position statement: executive summary. The Writing Group for the International Society for Clinical Densitometry (ISCD) Position Development Conference. J Clin Densitom. 2004;7(1):7–12. doi: 10.1385/jcd:7:1:7. [DOI] [PubMed] [Google Scholar]
- 15.Mazess RB, Barden HS, Eberle RW, Denton MD. Age Changes of Spine Density in Posterior-Anterior and Lateral Projections in Normal Women. Calcif Tissue Int. 1995;56:201–205. doi: 10.1007/BF00298610. [DOI] [PubMed] [Google Scholar]
- 16.Lewiecki EM, Watts NB, McClung MR, Petak SM, Bachrach LK, Shepherd JA, Downs RW., Jr Official positions of the international society for clinical densitometry. J Clin Endocrinol Metab. 2004;89(8):3651–5. doi: 10.1210/jc.2004-0124. [DOI] [PubMed] [Google Scholar]
- 17.Genant HK, Engelke K, Fuerst T, Gluer CC, Grampp S, Harris ST, Jergas M, Lang T, Lu Y, Majumdar S, Mathur A, Takada M. Noninvasive assessment of bone mineral and structure: state of the art. J Bone Miner Res. 1996;11(6):707–30. doi: 10.1002/jbmr.5650110602. [DOI] [PubMed] [Google Scholar]
- 18.Jones G, Nguyen T, Sambrook PN, Lord SR, Kelly PJ, Eisman JA. Osteoarthritis, bone density, postural stability, and osteoporotic fractures: A population-based study. J Rheumatol. 1995;22:921–925. [PubMed] [Google Scholar]
- 19.Arden NK, Griffiths GO, Hart DJ, Doyle DV, Spector TD. The association between osteoarthritis and osteoporotic fracture: the Chingford Study. Brit J of Rheumatol. 1996;35(12):1299–1304. doi: 10.1093/rheumatology/35.12.1299. [DOI] [PubMed] [Google Scholar]
- 20.Liu G, Peacock M, Eilam O, Dorulla G, Braunstein E, Johnston CC. Effect of osteoarthritis in the lumbar spine and hip on bone mineral density and diagnosis of osteoporosis in elderly men and women. Osteoporos Int. 1997;7(6):564–9. doi: 10.1007/BF02652563. [DOI] [PubMed] [Google Scholar]


