Abstract
A simple, cost effective, and noninvasive blood perfusion system is tested in animal models. The system uses a small sensor to measure the heat transfer response to a thermal event (convective cooling) imposed on the tissue surface. Heat flux data are compared with a mathematical model of the tissue to estimate both blood perfusion and thermal contact resistance between the tissue and the probe. The perfusion system was evaluated for repeatability and sensitivity using isolated rat liver and exposed rat kidney tests. Perfusion in the isolated liver tests was varied by controlling the flow of the perfusate into the liver, and the perfusion in the exposed kidney tests was varied by temporarily occluding blood flow through the renal artery and vein. The perfusion estimated by the convective perfusion probe was in good agreement with that of the metered flow of the perfusate into the liver model. The liver tests indicated that the probe can be used to detect small changes in perfusion (0.005 ml/ml/s). The probe qualitatively tracked the changes in the perfusion in the kidney model due to occlusion of the renal artery and vein.
Keywords: blood flow, perfusion measurement, sensors
1 Introduction
Blood perfusion, defined as the blood volume flow through a given volume or mass of tissue (in units of ml/ml/s or ml/100 g/min), represents local blood flow through the capillary network and extracellular spaces in the tissue. It is important for normal tissue physiology, including the transport of oxygen, nutrients, and waste products, and is part of the temperature regulatory system of the body. The changes in blood perfusion are associated with a variety of pathologic processes, including burn and other traumatic wound healing, head traumas, and tumor growth. Measurement of blood perfusion is a valuable medical diagnostic. The ability to measure perfusion is fundamental to an improved understanding of both normal and pathologic physiologies, as well as the diagnosis and management of numerous medical conditions.
2 Background
Both thermal and nonthermal approaches have previously been attempted to measure blood perfusion. Thermal perfusion measurement methods are based on the clearance of thermal energy and usually require the insertion of a probe into the tissue [1-3]. The most common of these methods is the thermal diffusion probe (TDP) [4-7] consisting of a thermistor bead situated at the end of a hypodermic needle. The thermistor is used to both deposit thermal energy into the tissue and measure the temperature response. The power deposition is controlled as a specified function. The main advantage of the thermal diffusion probe is that it provides absolute perfusion measurements. Khot et al. [6] demonstrated that this technique was viable for rabbit pedicle flaps. Also, Kamiya et al. [8] compared the thermal diffusion probe to the hydrogen clearance method and verified that these two methods produced similar perfusion measurements. The biggest limitation is that the probe is invasive and limited to deep tissue. The need for insertion in the tissue is undesirable not only for the discomfort and danger to the patient, but also because of the trauma and disruption of the tissue that is being measured.
Several attempts have been reported to create instruments to thermally measure blood perfusion noninvasively. These generally have used a heater and temperature sensor on the surface of the tissue with some arrangement to minimize heat loss. Patel et al. [9] and Li et al. [10] used thermistor probes covered by insulation, while Walsh and Bowman [11] used a second thermistor on top of the first to act as a guard heater. Castellana et al. [12] used a thin-film resistor placed on the skin surface to provide heat and measure the temperature. Focused ultrasound was used by Anderson and Burnside [13] as the heat source with a thermistor placed on the surface of the tissue to measure the temperature response. Holti and Mitchell [14] used a thermopile between a heated copper piece and a surrounding piece of copper placed on the surface of the skin. They tried to relate the measured temperature difference established after several minutes of heating to the blood perfusion.
The noninvasive thermal techniques have had limited success because of several problems, which are not present for the invasive techniques. The actual heat flux going into the tissue is difficult to determine because losses to the ambient are typically large. The heat losses are small for the invasive probes because they are not exposed to the environment. In addition, the thermal contact resistance between the probe and the tissue surface is important and difficult to determine for the noninvasive probes. Because the invasive probes penetrate into the tissue, thermal contact is not an issue. Moreover, the mathematical modeling is simpler for the invasive probes because spherical symmetry can be assumed.
Imaging perfusion measurement methods include magnetic resonance imaging (MRI), positron emission tomography (PET), and laser Doppler methods. MRI is a noninvasive technique to directly measure blood flow by utilizing arterial blood as an endogenous tracer [15-18]. PET scans require the introduction of a radioactive tracer into the blood supply [19-21]. These methods are limited to deep tissue and generally are inconvenient to use in critical settings, such as during surgery. They are expensive and entail the use of large equipment.
Laser Doppler flowmetry (LDF) is an established surface technique for the real-time measurement of red blood cell motion at the surface of tissue. LDF and laser Doppler imaging (LDI)[22] work by illuminating the tissue with a laser. The perfusion measurement is derived from the product of the mean velocity and the concentration of the red blood cells within the volume of the tissue being measured [22]. Perfusion is measured at the surface of the tissue and is only given as relative values. These systems have been used for monitoring dialysis [23], assessing the extent of burn wounds [24], and assessing transplant rejection [25]. The LDI system is portable but is expensive and relatively bulky.
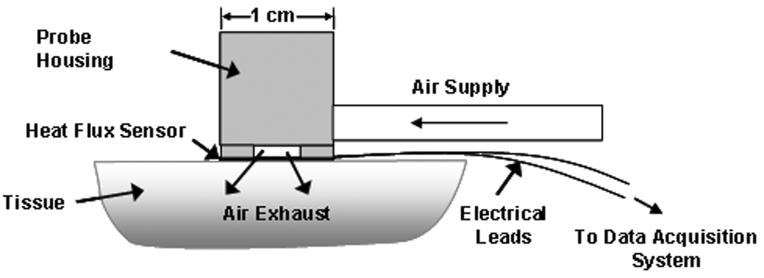
A noninvasive convective blood perfusion probe has been developed at Virginia Tech to provide a small inexpensive system to noninvasively measure perfusion at the surface of the tissue. It was tested on a perfused tissue phantom to quantify the repeatability and sensitivity of the method [26]. It works by imposing a thermal event on the surface of the tissue while the resultant heat flux is measured using a probe instrumented with a small sensor, as illustrated in Fig. 1. Perfusion values are estimated from the heat flux measurements using a mathematical model of the system with a minimization procedure. The current research demonstrates the sensitivity and repeatability of the thermal blood perfusion system using two animal tissue models: an exposed rat kidney and an isolated rat liver.
Fig. 1.
Schematic of convective blood perfusion probe system
3 Design and Operation of the Convective Perfusion Probe
In the convective perfusion probe system, a cooling event is imposed on the tissue surface. The resultant heat flux from the tissue is measured using a heat flux gauge similar to Cardinali [27] but smaller in size. The heat flux generates a temperature difference across the thickness of the heat flux gauge, which appears as a voltage output (E) directly proportional to the heat flux q″
| (1) |
where the constant Sq is the sensitivity factor of the heat flux gauge.
The operation of the convective perfusion probe relies on the 10-15°C temperature elevation of the core body temperature above the usual air-conditioned environment temperature of 20-25°C. When not making a measurement, the sensor is in equilibrium with the surface temperature of the tissue with very little heat flux. The initiation of a measurement occurs when cooling is started by forced convection from an air supply through the probe. This causes the temperature of the sensor to decrease and the heat flux to increase because of the temperature gradient from the tissue. The temperature drop within the tissue is usually no more than 5°C or 10°C and is gradual enough to not be noticeably felt. The time constant for thermally induced vasoconstriction is thought to be about 1 min [28]. Consequently, the thermal event time is limited to 60 s to minimize temperature dependent effects on the perfusion. The heat flux measurements are recorded, along with air, skin surface, and core body temperatures throughout each test. Once the air supply is turned off, the system comes back to equilibrium and is ready for another test. The process is painless and is barely detectable by the skin.
A schematic of the convective perfusion probe in operation is shown in Fig. 2. A 10×10 mm2 heat flux gauge (Vatell Corp., model BF-02, Christiansburg, VA) is mounted to the base of the probe housing. This is a thin thermopile-type sensor, which gives a signal directly proportional to the heat flux. A compressed air supply (~70 kPa) is connected to the housing to provide the cooling air. Although the exact air pressure is not crucial, the stability of the air temperature is. Consequently, the air is passed through a coiled copper tube in a water bath (20-25°C) to maintain it at a constant temperature before entering the probe housing. A thermocouple was mounted inside the probe housing to continuously monitor and record the incoming air temperature. The probe housing was machined in plastic to minimize any thermal influence on the air. The air then flows through a plate with nine holes (0.37 mm diameter) to create high velocity air jets, which impinge onto the sensor with a heat transfer coefficient of approximately 500 W/m2 K, causing a measurable heat flux response from the tissue. The air then exhausts through outlets in the housing. The probe sensor is affixed to the tissue using double-sided tape.
Fig. 2.
Convective blood perfusion probe
4 Modeling and Parameter Estimation
Parameter estimation techniques are used to determine perfusion by minimizing an objective function containing both measured experimental and calculated heat flux data. The calculated heat flux data are obtained from a two-dimensional axisymmetric finite-difference model of the probe and tissue based on the Pennes [29] bioheat equation, neglecting metabolic heat generation.
| (2) |
where T is the temperature, t is the time, ρ is the density, Cp is the specific heat, k is the thermal conductivity, and ω is the blood perfusion. The subscripts t, b, v, and a correspond to tissue, blood, venous, and arterial, respectively. The tissue is assumed to be homogenous and is supplied with arterial blood at the body's core temperature. The blood perfusion is assumed to be uniform, and the thermal properties of the tissue and the blood are assumed to be constant, with values of 0.572 W/m-°C for thermal conductivity and 4.0×10⁶ J/m3-°C for the product of density and specific heat for both the tissue and blood. The metabolic heat generation in most tissues [30] is several orders of magnitude smaller than the rate of thermal energy exchange from perfusion in this problem and can be neglected.
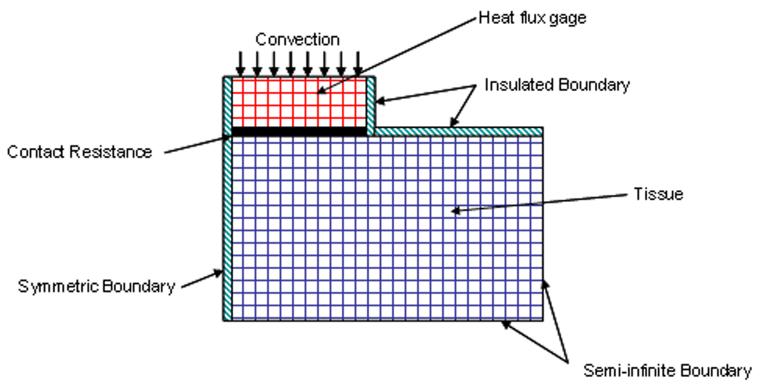
The recorded air, arterial, and tissue temperatures are used as input conditions for the model. By performing sensitivity analysis, it was found that the parameter estimation procedure was highly sensitive to the air temperature measurements. Therefore, air temperature is recorded as a function of time all through the thermal event. The boundary conditions for the model are shown in Fig. 3. All of the surfaces of the tissue have a zero temperature gradient condition except adjacent to the heat flux gauge. Any natural convection effects in the room are two orders of magnitude smaller than the heat flux during a measurement and can be neglected. A thermal contact resistance RC is used between the gauge and the tissue, where q is the heat flux.
| (3) |
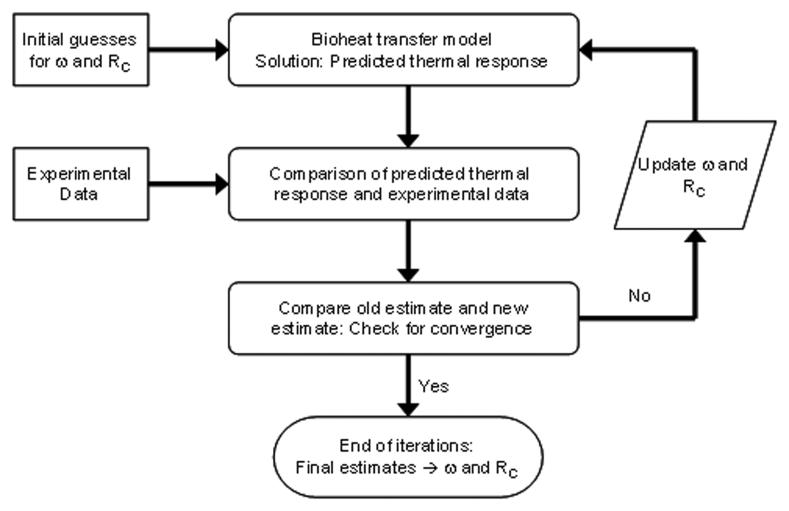
An alternating direction implicit (ADI) method [31] is used to solve the discretized equations for the unknown temperature field and the heat flux through the gauge. The Box-Kanemasu method [32] is used to perform the minimization procedure, as shown in Fig. 4. Note that both the perfusion and the unknown contact resistance at the probe/tissue interface are estimated. An independent estimate of the contact resistance is performed to eliminate the effects of differences in skin contact with the probe. Further details of the perfusion probe model and parameter estimation routine are given by Mudaliar et al. [26].
Fig. 3.
Schematic of finite-difference model of sensor and tissue
Fig. 4.
Estimation method for the blood perfusion ω and thermal contact resistanceRC
5 Data Acquisition Equipment
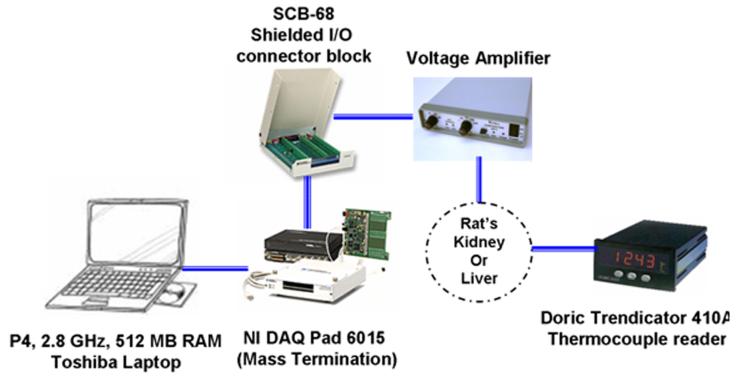
The data acquisition (DAQ) system used to record the heat flux and temperature data required for the estimation procedure is shown in Fig. 5. A P4 2.8 GHz laptop serves as the base. A 16 bit USB multifunction data acquisition system is used to measure the voltage signals from the heat flux sensor and an inlet air thermo-couple. These signals are amplified and passed through an A/D converter. National Instruments LabView 7.1 is used to control the data acquisition process. The other temperatures are measured by using a Doric thermocouple reader.
Fig. 5.
Data acquisition used for liver and kidney test
6 Experimental Methods
To demonstrate the performance of the blood perfusion measurement system, two live animal organ models were chosen. The isolated liver model allows continuous control of the perfusion in the organ with an external pump while still maintaining the viability of the tissue. The organ is necessarily removed from the animal, however. Conversely, the rat kidney model used a live rat with the organ still in place. The blood flow could not be controlled with an external pump. Instead, the artery and vein pair were alternately occluded and opened to provide a change in per-fusion. The exact values were not independently measured as in the case of the liver. Together these models provide the complete desired testing, which would be precisely controlled flow to an organ in the animal.
6.1 Isolated Liver Model
Experiments were performed using male Sprague-Dawley rats (Charles Rivers, Wilmington, MA) weighing 270 g under isoflourane anesthesia at the University of North Carolina, Charlotte. Animals were cared for and treated by protocol approved by National Institute of Health institutional animal use and care guidelines.
Isolation surgery started with a transverse abdominal incision. The portal vein, inferior vena cava, and bile duct were exposed using moist gauze to move the bowel and the duodenum. The bile duct was transected after distal ligation and a polyethylene tube (PE-10, BD-Clay Adams, Sparks, MD) was inserted into the lumen of the bile duct and secured with a circumferential 3-0 silk suture. 1 ml of saline containing 200 U of heparin was injected through the inferior vena cava. The portal vein was canulated using a 14 gauge catheter and was secured with 3-0 silk suture. Then, the inferior vena cava was closed with a 3-0 silk suture. A small incision was made on the suprahepatic vein, close to the heart. A 10 ml syringe filled with cold Krebs-Henseleit buffer solution was used to flush the blood out slowly. A 14 gauge catheter was inserted into the suprahepatic vena cava and tied tightly with a 3-0 silk suture.
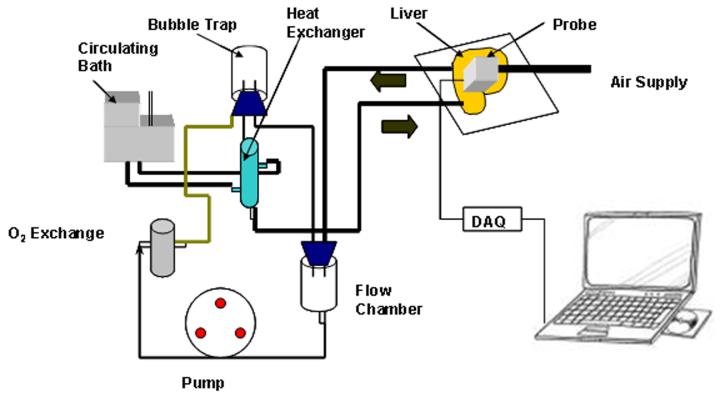
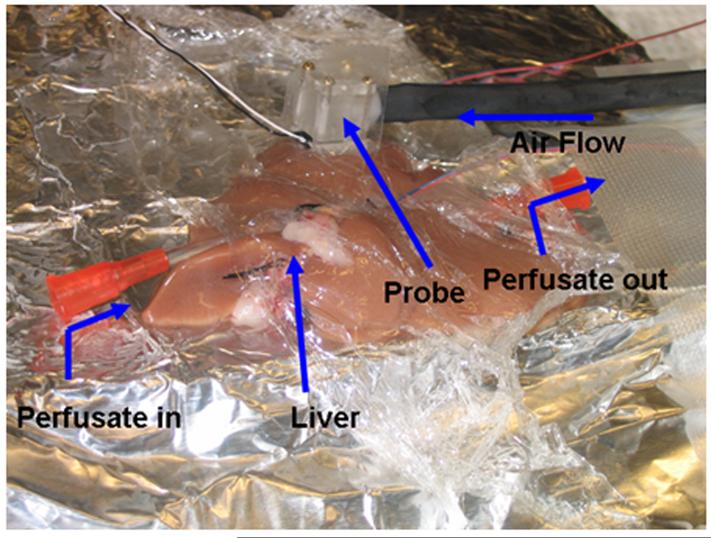
The closed loop experimental arrangement for the liver is show in Fig. 6. It was perfused with Krebs-Henseleit solution at a temperature of 37°C. A peristaltic pump monitored with an inline ultrasound flow transducer controls the flow rate. Inflow and outflow pressures are monitored with pressure transducers (not shown in figure). In order to keep the liver tissue alive, the perfusate passes through a gas exchanger with 95% O2 and 5% CO2 gas. After isolation, the liver was placed on a temperaturecontrolled stage, as shown in Fig. 7. The tissue was covered with clear plastic to prevent it from cooling and drying.
Fig. 6.
Experimental setup for the isolated liver test
Fig. 7.
Probe on isolated liver for perfusion measurements
Tests were conducted at five different flow rates: 0 ml/min, 5 ml/min, 10 ml/min, 15 ml/min, and 20 ml/min with two to four repetitions at each flow rate. Liver temperature was monitored by placing a thermocouple on the tissue to be tested. The perfusate temperature was also recorded for each flow rate. The blood perfusion probe was affixed to the liver with a piece of two-sided tape and was lightly laid on the tissue. The DAQ typically runs for 120 s, the air is bled off through a three way valve for the first 60 s to remove any offset in heat flux. For the next 60 s, the air is forced to impinge on the sensor, eliciting a heat flux response from the tissue.
6.2 Exposed Kidney Model
The rat was anesthetized and maintained with isoflurane in 100% oxygen. The ventral abdomen was clipped from the xiphoid to the pubis and was aseptically prepared for surgery. A sheet of ioban was used to drape the surgical site, and an incision was made from the xiphpoid to the pubis using a number 15 scalpel blade. The left kidney was bluntly dissected and the renal vein and artery were isolated. Blood flow to the kidney was temporarily occluded using a microvascular clamp placed over the renal artery and vein. To reestablish blood flow, the microvascular clamp was removed from the renal artery and vein.
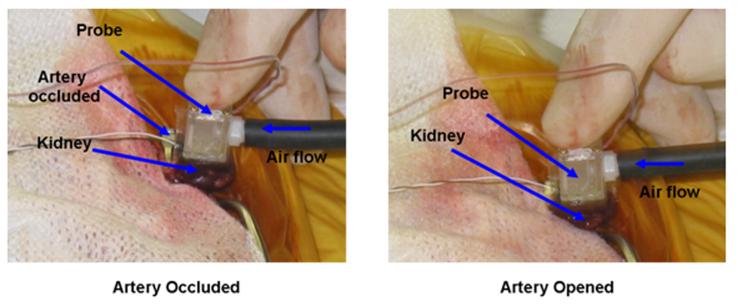
The data acquisition system ran for 120 s for each test. No air is supplied for the first 60 s, which is done to remove any zero offset in the measured heat flux. After 60 s the air supply is switched on initiating the 60 s cooling event. A 2 min break is allowed between each test to re-equilibrate the temperature in the tissue. Clamping both the artery and vein insures that flow both in and out of the tissue is stopped. The first three tests were done without occluding the artery to check the repeatability of the measured heat flux data from the blood perfusion probe. The next six tests were carried out by alternately occluding the artery and opening the artery. Figure 8 shows the probe placed on the kidney with the artery occluded. It was difficult to position the probe in the cavity created to access the kidney. It had to be held in place and often repositioned between individual measurements.
Fig. 8.
Experimental setup for the exposed kidney model
7 Results
7.1 Liver Model
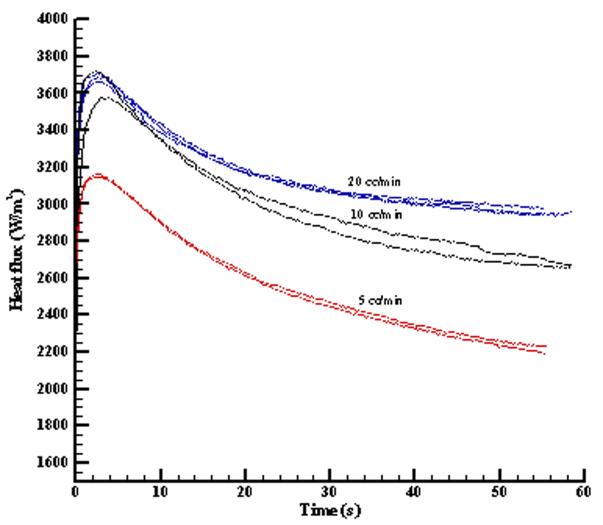
The ex vivo liver model was used to provide a controlled perfusion in the living tissue and to validate the convective perfusion probe sensitivity and repeatability. Samples of the heat flux response during thermal events for perfusate flow rates of 5 cc/min, 10 cc/min, and 20 cc/min are shown in Fig. 9. The curves for the different flow rates are clearly different and the repeatability for the same flow rate is reasonably good. Some of the variability in the level of the heat flux is due to probe placement and surface thermal contact resistance. The initial increase and decrease of the heat flux curve is dominated by the thermal contact resistance and conduction, while the later part is influenced by blood perfusion [26].
Fig. 9.
Repeatability and sensitivity of the blood perfusion probe for the liver model
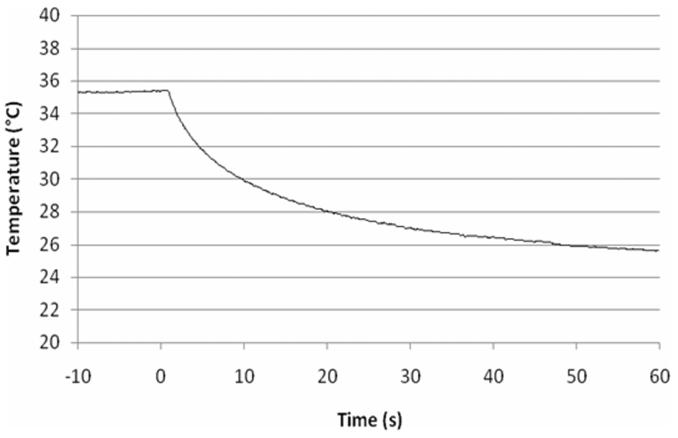
A typical temperature history of the sensor face that is against the surface of the tissue is shown in Fig. 10. The convection is turned on at time 0 s, which causes heat transfer from the tissue with a corresponding drop in temperature. The temperature of the tissue surface will be slightly higher than on the sensor surface, depending on the value of the thermal contact resistance. Because the perfusion is more sensitive to the heat flux curves than the surface temperature curves, the results in Fig. 10 were not used in the parameter estimation.
Fig. 10.
Typical sensor surface temperature history
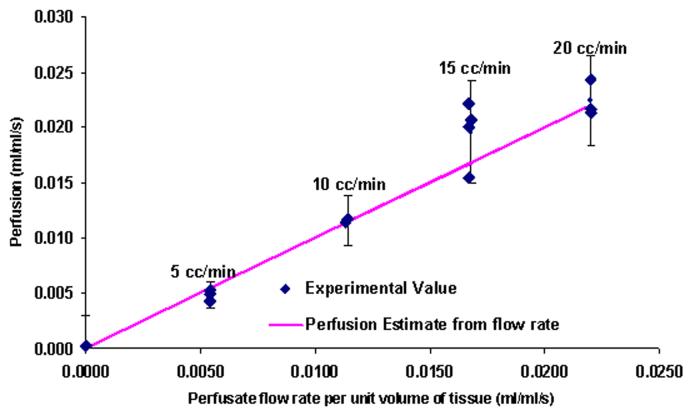
Perfusion estimates were obtained for each of the different flow rates. The results are compared with the average perfusion based on the imposed flow rate and total weight of the liver (15 g) in Fig. 11. The solid line indicates a one-to-one correspondence between the average perfusion values and the perfusion measured by the probe. It was assumed that the probe was large enough to average over multiple lobes of the liver. The 95% confidence intervals for the estimated perfusion from the probe are also shown on the figure. The current parameter estimation routine gives a slight offset in the perfusion values of -0.0087 ml/ml s, which was removed from all of the results. The perfusion estimates from the blood perfusion probe are in excellent agreement with the calculated average perfusion. It is also clear from the plot that the probe can reliably detect a small change in blood perfusion (0.005 ml/ml s). Statistical analysis was carried out to check the dependence of perfusion on the perfusate flow rate. The statistical mean for all the flow rates are different up to perfusion estimates corresponding to 15 cc/min (0.017 ml/ml s). Therefore, it is concluded that the measured perfusion is statistically significant over most of the range. More data sets are required at the higher flow rates.
Fig. 11.
Liver perfusion estimates
Contact resistance was also estimated from the experimental measurements, as shown in Fig. 12. The probe was lightly held onto the tissue by hand during the tests. Consequently, there is considerable variation in the values of the estimated contact resistance. These values are not important themselves, but are necessary for accurate estimates of the perfusion.
Fig. 12.
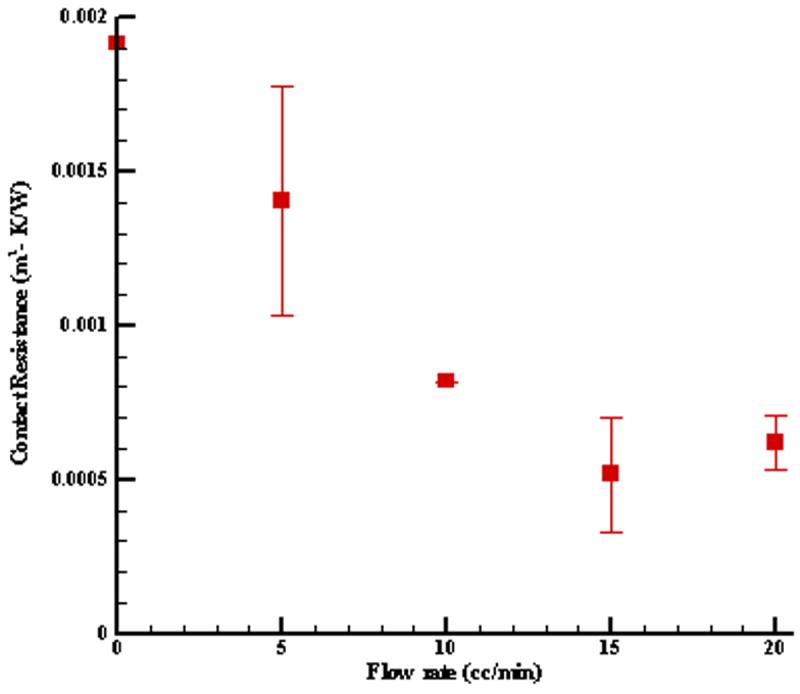
Thermal contact resistance for liver tests
7.2 Kidney Model
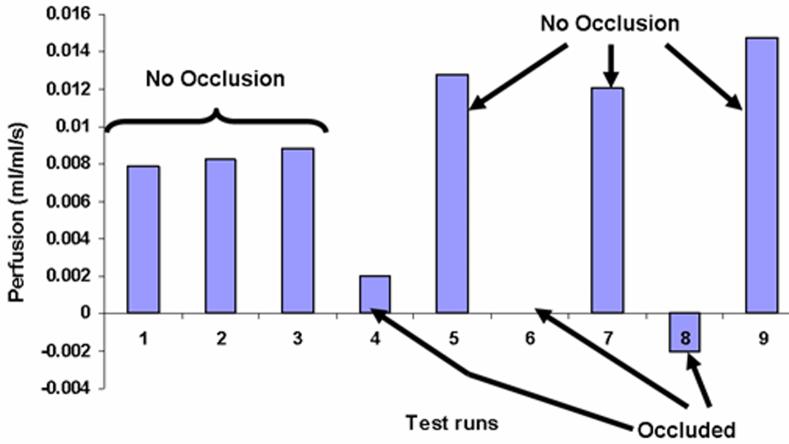
Qualitative tests of the probe were done in vivo using the kidney model. The heat flux response is similar to that of the liver tests. The current numerical model for the probe and tissue gives a slight offset in the perfusion values of -0.00943 ml/ml/s for the kidney based on the occluded tests. This is very close to the value for the liver tests. It was subtracted from all of the perfusion estimates shown in Fig. 13 and results in an average value of zero perfusion for the occluded cases. Table 1 lists the perfusion values and the status of the kidney during the test. The tests are listed in sequential order of measurement. The first three tests show the repeatability of the measurements before the artery was clamped. These are typical perfusion values for body tissue but are lower than the usual values for the highly perfused kidney cortex. Since the present measurements were taken on the surface of the kidney, there are no directly comparable measurements. The tight positioning of the probe in the chest cavity of the rat may inadvertently have pressured the tissue, which could mechanically decrease local perfusion. Moreover, in situ perfusion values at specific locations are known to vary by large amounts over time and position. The intent of the present measurements are to simply demonstrate the effects of occlusion, as shown in Tests 4-9. The perfusion values for the occluded tests drop substantially, as expected. The perfusion values when the artery is reopened are slightly higher than for the three initial tests before occlusion (Tests 1-3). This is a typical perfusion response in tissue following the sudden removal of an occlusion [6]. The blood apparently rushes in when the clamp is removed to replenish the tissue, thereby increasing the blood perfusion in the tissue.
Fig. 13.
Average perfusion estimates for the rat kidney
Table 1.
Perfusion estimates for the kidney tests
| Tests | Artery | Perfusion (ml/ml s) |
|---|---|---|
| 1 | Open | 0.00784 |
| 2 | Open | 0.00825 |
| 3 | Open | 0.00882 |
| 4 | Closed | 0.00198 |
| 5 | Open | 0.01274 |
| 6 | Closed | 0.000 |
| 7 | Open | 0.01203 |
| 8 | Closed | -0.00199 |
| 9 | Open | 0.01478 |
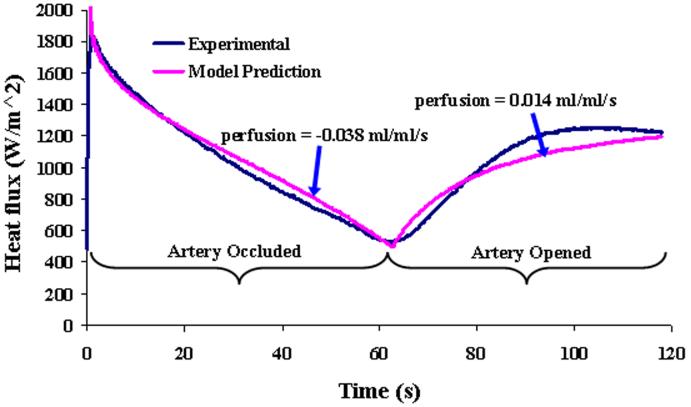
To further demonstrate the effects of perfusion on the heat flux response, a special test is shown in Fig. 14 over a 2 min time span. The artery was occluded for the first 60 s and then the artery was opened for the next 60 s while continuous heat flux measurements were taken. The heat flux for the first 60 s decreases steeply because there is no perfusion due to the occlusion. The heat flux response increases immediately after the occlusion is removed, indicating that the perfusion quickly starts to warm the tissue. The corresponding perfusion estimates and model predictions are also shown for comparison. Although the results do not match as well as the usual 60 s tests, the effects of perfusion are dramatic and are predicted by the model.
Fig. 14.
Heat flux response from the kidney model with artery occlusion followed by opening
8 Conclusions
The performance of the convective perfusion probe was successfully demonstrated on two animal models. The experimental measurements with an isolated liver were in good agreement with the average controlled flow of perfusate into the liver. The convective perfusion probe displayed good repeatability and sensitivity, reliably measuring changes in perfusion of the order of 0.005 ml/ml s. The convective perfusion probe qualitatively assessed the perfusion changes in a rat kidney caused by the occlusion of the renal artery and vein. The repeatability, sensitivity, and good agreement with the animal model results demonstrates that perfusion can be qualitatively and quantitatively measured by the convective perfusion probe.
Acknowledgment
This work has been supported by Grant No. EP03943-01 from the National Institutes of Health.
Footnotes
Contributed by the Bioengineering Division of ASME for publication in the JOURNAL OF BIOMECHANICAL ENGINEERING.
References
- [1].Chato JC. Measurement of Thermal Properties of Biological Materials. In: Shitzer A, Eberhart R, editors. Heat Transfer in Medicine and Biology. Vol. 1. Plenum; New York: 1985. pp. 167–192. Chap. 8. [Google Scholar]
- [2].Bowman H. Estimation of Tissue Blood Flow. In: Shitzer A, Eberhart R, editors. Heat Transfer in Medicine and Biology. Vol. 1. Plenum; New York: 1985. pp. 193–203. Chap. 9. [Google Scholar]
- [3].Kress R, Roemer R. A Comparative Analysis of Thermal Blood Perfusion Measurement Techniques. ASME J. Biomech. Eng. 1987;109(3):218–225. doi: 10.1115/1.3138672. [DOI] [PubMed] [Google Scholar]
- [4].Valvano JW, Allen JT, Bowman HF. The Simultaneous Measurement of Thermal Conductivity, Thermal Diffusivity, and Perfusion in Small Volumes of Tissue. ASME J. Biomech. Eng. 1984;106:192–197. doi: 10.1115/1.3138482. [DOI] [PubMed] [Google Scholar]
- [5].Vajkoczy P, Roth H, Horn P, Lucke T, Taumé C, Hubner U, Martin GT, Zappletal C, Klar E, Schilling L, Schmiedek P. Continuous Monitoring of Regional Cerebral Blood Flow: Experimental and Clinical Validation of a Novel Thermal Diffusion Microprobe. J. Neurosurg. 2000;93:265–274. doi: 10.3171/jns.2000.93.2.0265. [DOI] [PubMed] [Google Scholar]
- [6].Khot MB, Maitz PKM, Phillips BR, Bowman HF, Pribaz JJ, Orgill DP. Thermal Diffusion Probe Analysis of Perfusion Changes in Vascular Occlusions of Rabbit Pedicle Flaps. Plast. Reconstr. Surg. 2005;115:1103–1109. doi: 10.1097/01.prs.0000156546.45229.84. [DOI] [PubMed] [Google Scholar]
- [7].Maitz PKM, Khot MB, Mayer HF, Martin GT, Pribaz JJ, Bowman HF, Orgill DP. Continuous and Real-Time Blood Perfusion Monitoring in Prefabricated Flaps. J. Reconstr Microsurg. 2005;20(1):35–41. doi: 10.1055/s-2004-818048. [DOI] [PubMed] [Google Scholar]
- [8].Kamiya H, Watanabe G, Saito T, Doi T, Tomita S, Ohtake H, Kanamori T. Real-Time and Continuous Monitoring of Myocardial Blood Flow Using a Thermal Diffusion Method. Eur. J. Cardiothorac Surg. 2002;21:748–752. doi: 10.1016/s1010-7940(02)00039-8. [DOI] [PubMed] [Google Scholar]
- [9].Patel PA, Valvano JW, Pearce JA, Prahl SA, Denham CR. A Self-Heated Thermistor Technique to Measure Effective Thermal Properties From the Tissue Surface. ASME J. Biomech. Eng. 1987;109:330–335. doi: 10.1115/1.3138689. [DOI] [PubMed] [Google Scholar]
- [10].Li HJ, Zhang XX, Yi YF. Measurement of Blood Perfusion Using the Temperature Response to Constant Surface Heat Flux. Int. J. Thermophys. 2002;23:1631–1644. [Google Scholar]
- [11].Walsh JT, Jr., Bowman HF. A Non-Invasive Method for Quantifying Tissue Perfusion. In: Spilker RL, editor. Adv. Bioeng. ASME; NY: 1984. pp. 5–6. [Google Scholar]
- [12].Castellana FS, Skalak R, Cho JM, Case RB. Steady State Analysis and Evaluation of New Thermal Sensor for Surface Measurement of Tissue Perfusion. Ann. Biomed. Eng. 1983;11:101–115. doi: 10.1007/BF02367494. [DOI] [PubMed] [Google Scholar]
- [13].Anderson GT, Burnside G. A Noninvasive Technique to Measure Perfusion Using a Focused Ultrasound Heating Source and a Tissue Surface Temperature Measurement. In: Roemer RG, Valvano JW, Hayes L, Anderson GT, editors. Advances in Measuring and Computing Temperatures in Biomedicine: Thermal Tomography Techniques, Bio-Heat Transfer Models. ASME; New York: 1990. pp. 31–35. [Google Scholar]
- [14].Holti G, Mitchell KW. Estimation of the Nutrient Skin Blood Flow Using a Non-Invasive Segmented Thermal Clearance Probe. In: Rolfe EP, editor. Non-Invasive Physiological Measurements. Vol. 1. Academic; London: 1979. pp. 113–123. Chap. 5. [Google Scholar]
- [15].Liu J, Xu LX. Estimation of Blood Perfusion Using Phase Shift in Temperature Response to Sinusoidal Heating at the Skin Surface. IEEE Trans. Biomed. Eng. 1999;46:1037–1043. doi: 10.1109/10.784134. [DOI] [PubMed] [Google Scholar]
- [16].Montet X, Ivancevic MK, Belenger J, Jorge-Costa M, Pochon S, Pechére A, Terrier F, Vallé J. Noninvasive Measurement of Absolute Renal Perfusion by Contrast Medium Enhanced Magnetic Resonance Imaging. Invest. Radiol. 2003;38(9):584–592. doi: 10.1097/01.RLI.0000077127.11949.8c. [DOI] [PubMed] [Google Scholar]
- [17].Vallée JP, Lazeyras F, Khan HG, Terrier F. Absolute Blood Flow Quantification by Dynamic MRI and Gd-DTPA. Eur. Radiol. 2000;10(8):1245–1252. doi: 10.1007/s003300000434. [DOI] [PubMed] [Google Scholar]
- [18].Dias M, Hadgraft J, Glover PM, McDonald PJ. Stray Field Magnetic Resonance Imaging: A Preliminary Study of Skin Hydration. J. Phys. D. 2003;36:364–368. [Google Scholar]
- [19].Schelbert HR. PET Contributions to Understanding Normal and Abnormal Cardiac Perfusion and Metabolism. Ann. Biomed. Eng. 2000;28:922–929. doi: 10.1114/1.1310216. [DOI] [PubMed] [Google Scholar]
- [20].Nuutila P, Kalliokoski K. Use of Positron Emission Tomography in the Assessment of Skeletal Muscle and Tendon Metabolism and Perfusion. Scand. J. Med. Sci. Sports. 2000;10:346–350. doi: 10.1034/j.1600-0838.2000.010006346.x. [DOI] [PubMed] [Google Scholar]
- [21].Boellaard R, Knaapen P, Rijbroek A, Lutersema GJJ, Lammertsma AA. Evaluation of Basis Function and Linear Least Squares Methods for Generating Parametric Blood Flow Images Using 15O-Water and Positron Emission Tomography. Mol. Imaging Biol. 2005;7:273–285. doi: 10.1007/s11307-005-0007-2. [DOI] [PubMed] [Google Scholar]
- [22].Svedman C, Cherry GW, Strigini E, Ryan TJ. Laser Doppler Imaging of Skin Microcirculation. Acta Derm Venereol. 1998;78:114–118. doi: 10.1080/000155598433430. [DOI] [PubMed] [Google Scholar]
- [23].Niwayama J, Sanaka T. Development of a New Method for Monitoring Blood Purification: The Blood Flow Analysis of the Head and Foot by Laser Doppler Blood Flow Meter during Hemodialysis. Hemodialysis International. 2005;9:56–62. doi: 10.1111/j.1492-7535.2005.01118.x. [DOI] [PubMed] [Google Scholar]
- [24].Mileski WJ, Atiles L, Purdue G, Kagan R, Saffle JR, Herndon DN, Heimbach D, Luterman A, Yurt R, Goodwin C, Hunt JL. Serial Measurements Increase the Accuracy of Laser Doppler Assessment of Burn Wounds. J. Burn Care Rehabil. 2003;24:187–191. doi: 10.1097/01.BCR.0000076091.79370.56. [DOI] [PubMed] [Google Scholar]
- [25].Oltean M, Aneman A, Dindelegan G, Molne J, Olausson M, Herlenius G. Monitoring of the Intestinal Mucosal Perfusion Using Laser Doppler Flowmetry After Multivisceral Transplantation. Transplant. Proc. 2005;37:3323–3324. doi: 10.1016/j.transproceed.2005.09.032. [DOI] [PubMed] [Google Scholar]
- [26].Mudaliar AV, Ellis BE, Ricketts PL, Lanz OI, Scott EP, Diller TE. A Phantom Tissue System for the Calibration of Perfusion Measurements. ASME J. Biomech. Eng. 2008;130:051002. doi: 10.1115/1.2948417. [DOI] [PMC free article] [PubMed] [Google Scholar]
- [27].Cardinali AV, Lanz OI, Diller TE, Scott EP. Validation of a Noninvasive Blood Perfusion Measurement System Using a Canine Medial Saphenous Fasciocutaneous Free Tissue Flap Model; Proceedings of the ASME International Mechanical Engineering Congress and Exposition; New Orleans. Nov. 17-22; 2002. Paper No. 32354. [Google Scholar]
- [28].Wissler EH. Mathematical Simulation of Human Thermal Behavior Using Whole Body Models. In: shitzer A, Eberhart RC, editors. Heat Transfer in Medicine and Biology. Vol. 1. Plenum; New York: 1985. pp. 325–373. Chap. 13. [Google Scholar]
- [29].Pennes HH. Analysis of Tissue and Arterial Blood Temperatures the Resting Human Forearm. J. Appl. Physiol. 1948;1:93–122. doi: 10.1152/jappl.1948.1.2.93. [DOI] [PubMed] [Google Scholar]
- [30].Wilson SB, Spence VA. A Tissue Heat Transfer Model Relating Dynamic Skin Temperature Changes to Physiological Parameters. Phys. Med. Biol. 1988;33:895–912. doi: 10.1088/0031-9155/33/8/001. [DOI] [PubMed] [Google Scholar]
- [31].von Rosenberg DU. Methods for Numerical Solution of Partial ferential Equations. Elsevier; New York: 1969. pp. 84–89. [Google Scholar]
- [32].Scott EP, Robinson PS, Diller TE. Development of odologies for the Estimation of Blood Perfusion Using a Minimally Probe. Meas. Sci. Technol. 1998;9(6):888–897. [Google Scholar]


