

Abstract
To develop new and safe approaches to protect and preserve the function of the human corneal endothelium (HCE), we have established an in vitro model of cell loss using an HCE cell line and have examined the potential for hypoxia conditioning to protect HCE from death induced by two ROS generating cytotoxins (tertiary butyl hydroperoxide [tBHP] and paraquat [PQ]). Cell death was assessed by flow cytometric analysis of Annexin-V (An) and propidium iodide (PI) double staining and oligonucleosome production. Mitochondrial membrane potential (MMP) was measured with JC-1 fluorescent dye to determine possible associations between MMP preservation and cell survival. PQ and tBHP both induced HCE cell death in a dose-dependent manner, with 48% and 32% of An+ cells observed with 60 μM tBHP and 500 μM PQ, respectively. In addition, this level of tBHP and PQ resulted in 66% and 49% decreases in MMP, respectively. Hypoxia (0.6% ± 0.1% oxygen) pretreatment (8 hrs) significantly reduced An+ cells caused by 60 μM tBHP to 15%, whereas hypoxia had no effect on the decreased MMP. Hypoxia pretreatments (24 hrs) slightly reduced An+ cells caused by 500 μM PQ to 25% and completely prevented the induced MMP reduction. Conversely, hypoxia posttreatment (24 hrs) resulted in a greater inhibition of cell death than pretreatment and yet failed to prevent the PQ-induced MMP collapse. In conclusion, these results suggest that hypoxia can sufficiently protect HCE cells against cell death caused by tBHP and PQ, although no direct link between hypoxia cell protection and MMP preservation was observed.
Keywords: oxidative stress, mitochondria membrane potential (MMP), Bcl-2, HIF-1α, apoptosis
Introduction
Human corneal endothelium (HCE) is a monolayer cell structure that plays an essential role in corneal nutrient uptake, waste removal, and fluid transport (1). The average adult HCE cell density is approximately 2500 cells/mm2, which gradually decreases with age. When the corneal endothelial cell density reaches approximately 1000 cells/mm2 or less, the fluid transport function is unable to maintain corneal hydration, which then leads to corneal stromal edema, loss of corneal transparency, and finally impaired vision. The precise cause of endothelial cell loss with normal aging is unknown, but there is evidence to suggest that light-induced reactive oxygen species (ROS) formation has an important role (2, 3).
Although it can take over 100 years for HCE cells to reach the decompensation threshold via normal aging, this cell loss can be significantly accelerated by eye surgery (4), transplantation (5), inflammation (6), and abnormal oxidative stress caused by certain eye diseases (7, 8). For example, increased formation of peroxynitrite, an oxidant produced by nitric oxide and superoxide, was detected in corneas with Fuchs’ endothelial dystrophy (9), a disease characterized by an accelerated loss of corneal endothelial cells (7). This loss is associated with an increased incidence of apoptotic cells (10, 11).
Whereas preventing or slowing HCE cell death caused by aging or diseases such as Fuchs’ may require genetic approaches, reducing cell death associated with surgery or corneal transplantation is likely to be more amenable to pharmacologic approaches. For example, antioxidants, including vitamins C and E, were able to reduce the induced oxidative damage in corneal endothelial cells, so that cell death was attenuated in vitro (8). Rather than reducing the formation of ROS, another approach is to condition cells so that they can survive the ROS insult. Adaptation to nonlethal hypoxia has been reported to protect cells against cell death induced by oxidative stress (12, 13). Although the molecular mechanisms are not fully understood, mild levels of hypoxia exposure often lead to upregulation of cell survival genes and signaling pathways (14). During the past few years, a considerable number of studies have investigated the genes or proteins specifically regulated by hypoxia. The hypoxia-inducible factors (HIF) were the first identified family of transcription factors that were rapidly induced by hypoxia through inhibition of their ubiquitin-dependent degradation (15). Recently, the important role of HIF-1α in cellular oxygen sensing was demonstrated by identifying that upregulation of 89% of genes induced by hypoxia is HIF-1α dependent (16). These genes include those involved in energy conservation, increased energy production through glycolysis, and production of growth factors such as vascular endothelial growth factor (VEGF), all of which function to enhance cell survival. In the eye, hypoxia protection against cell death has been reported for corneal stromal cells (17) and retina (18, 19). The cornea is particularly suitable for hypoxia conditioning because it can easily be delivered to corneas in vivo during contact lens wear (20, 21) and could be incorporated, for example, prior to or following corneal surgeries.
Accordingly, we investigated whether transient sublethal hypoxia could protect HCE against cell death induced by external oxidative stress by two ROS-producing cytotoxins, tertiary butyl hydroperoxide (tBHP) (22) and paraquat (PQ) (23). ROS production by these agents is associated with collapse of the mitochondrial membrane potential (MMP) and plays an important role in cell death, since antioxidants are able to attenuate the loss of MMP as well as reduce cell killing (24, 25). Therefore, in the current study, we asked if MMP protection was also a factor in inhibiting cell killing by hypoxia conditioning. To determine if hypoxia could be effective, we developed an in vitro model of HCE cell death using a partially immortalized human corneal endothelial cell line (26). Using annexin-V (An) and propidium iodide (PI) double staining followed by flow cytometry, we found that tBHP and PQ were able to induce HCE cell death in a dose-dependent manner, and hypoxia treatments significantly protected cells from the induced cell death. This finding was also confirmed by measuring cellular oligonucleosome levels, another biomarker for apoptosis (27). In addition, our results revealed that cell death caused by tBHP and PQ was accompanied by MMP collapse; however, no direct link between cell protection by hypoxia and MMP preservation was observed.
Materials and Methods
Human Corneal Endothelial Cell Culture and Chemicals
The partially immortalized human corneal endothelial cell line, previously characterized in engineered corneas (26), was kindly provided by Dr. M. Watsky (Department of Physiology, University of Tennessee Health Science Center, Memphis, TN). Cells were cultured with Dulbecco’s modified Eagle’s medium (DMEM)/F12 (11330–032, Invitrogen Corp., Carlsbad, CA) containing 20% bovine calf serum (HyClone, Logan, UT), 1% antibiotic-antimycotic (Invitrogen), and 1% ITS (insulintransferrin-selenium; BD Biosciences, San Jose, CA) in 5% CO2—95% air, 37°C humid incubator. Tertiary butyl hydroperoxide and paraquat were both purchased from Sigma-Aldrich (St. Louis, MO).
Hypoxia Exposure
The hypoxic condition was achieved in a Hypoxia Glove Box (COY Laboratory Product Inc., Grass Lake, MI), 37°C, humidified, gassed with 5% CO2/95 % N2, and partial pressure of the box was controlled using a microprocessor-based oxygen controller (COY Laboratory Product Inc.). In all cases of hypoxia exposure, the partial pressure of oxygen was 0.6% ± 0.1%. Considering that the oxygen tension in aqueous humor is 5.6% (28), this hypoxic condition is about 9% of the usual oxygen tension.
Cell Death Detected by An and PI Double Staining
For tBHP treatments, 2.8 × 10⁵ cells were seeded on 10-cm tissue culture plates with 9.7 ml medium for at least 28 hrs before any chemical treatments. For hypoxia samples, plates were placed in the hypoxia chamber at fixed time points (4–24 hrs) before chemical treatments. tBHP treatments were started by replacing culture medium with fresh medium containing various concentrations of tBHP (20–100 μM). Exactly 16 hrs after beginning tBHP treatments, medium with tBHP was removed and cells attached to the culture plates were trypsinized using 0.05% trypsin, at 37°C for 5 mins. These cells were then combined with the removed medium (containing floating cells) and spun at 470 g for 5 mins at 4°C. The cell pellet was divided roughly into two portions, one of which was used for An and PI double staining using an annexin-V—fluorescein isothiocyanate (FITC) Apoptosis Detection Kit (Biovision, Mountain View, CA), and the other portion was used for JC-1 staining (see the following section for description). Cells were stained with 2 μl annexin-V—FITC reagent in 0.5 ml annexin-V—binding buffer in the dark for 5 mins at room temperature. Cells were then spun at 470 g for 5 mins at 4°C, and the supernatant was discarded. Subsequently, 1 ml of binding buffer was added to wash the cells, and the cell suspension was spun at 470 g for another 5 mins at 4°C. The supernatant was discarded and 0.5 ml binding buffer containing 2 μl PI reagent was added, and this cell suspension was incubated in the dark for 5 mins at room temperature. Cells were then placed on ice until flow cytometry analysis. For PQ treatment, procedures were exactly the same except for the following modifications:
1 × 10⁵ cells were seeded on each 10-cm tissue culture plate.
After PQ exposures, old medium was removed and cells on the plates were washed with 4 ml fresh medium with PQ three times. After this, cells were allowed to recover in 9.7 ml fresh medium for exactly 48 hrs before flow cytometry analysis.
Hypoxia posttreatment was achieved by placing samples in the hypoxia chamber during the first 24 hrs of the recovery period.
Cell death induced by PQ ranging from 100 to 500 μM was assessed. For all experiments, at least three independent replicates were conducted.
MMP Measurement Using JC-1 Staining
The second portion of cells (see preceding section) was stained with 0.5 ml 1 μg/ml JC-1 (T3168, Molecular Probes, Invitrogen Corp., Carlsbad, CA) in phosphate-buffered saline (PBS) with 0.2% bovine serum albumin (BSA). The staining was conducted at 37°C for 15 mins. Cells were spun at 470 g for 5 mins at 4°C, and the supernatant was discarded. Subsequently, 1 ml PBS with 0.2% BSA was added to wash the cell pellet, and the cell suspension was then spun at 470 g for 5 mins at 4°C. This wash was repeated once. Finally, the cell pellet was suspended in 0.5 ml PBS with 0.2% BSA, and the cell suspension was placed on ice until flow cytometry analysis.
Flow Cytometry
Cells were analyzed by a FACSCalibur flow cytometer (BD Immunocytometry System, BD Biosciences, San Jose, CA) using CellQuestPro (BD Biosciences) software. In all cases, at least 10,000 cells were analyzed for each independent experiment. Bandpass emission filters of 530:30 and 585:42 nm were used for detecting An and PI staining, respectively. PI nuclear staining indicates a damaged cell membrane, whereas the ability of An to specifically bind to phosphatidylserine (PS) allows the detection of translocation of PS from the inner face of the cell membrane to the cell surface, a biomarker for early apoptosis.
Depending on the mitochondrial inner membrane potential, mitochondria take up the free form of JC-1, which results in accumulation of JC-1 within the inner membrane leading to formation of JC-1 aggregates (29). As a result, the fluorescence emission of JC-1 shifts from 525 nm to 590 nm. Therefore, the fluorescence emission ratio (590:525 nm) can be used to quantify MMP. The same filters as used for An and PI detections were also used for analyzing JC-1-stained cells. The geometric means of cell fluorescence was calculated by CellQuestPro for each wavelength and used to determine the 590:525 ratio.
Measurement of Cellular Oligonucleosome Levels
To measure the cellular oligonucleosome levels, an enzyme-linked immunoabsorbent assay (ELISA) (Cell Death Detection ELISAPLUS kit; Roche Corp., Basel, Switzerland) was used. Oligonucleosome formation can be induced during the apoptotic process due to an increase of endonuclease activity (30) and used as a hallmark for apoptotic cells. To mimic conditions used for cell death and MMP measurements, the procedures used were the same as used previously in MMP measurement except for the following modifications: (i) 1 × 10⁵ cells were seeded on 6-cm plates for tBHP treatments and only 4.5 × 10⁴ cells were used for PQ samples; (ii) the volume of medium used for each 6-cm plate was 3.5 ml. After the chemical treatments, old medium was removed and spun at 470 g for 5 mins at room temperature. This cell pellet, together with cells attached to the culture plate, was then lysed with 1 ml lysis buffer, supplied by the kit. Next, the manufacturer’s instructions were followed and absorbance at 405 nm was determined using a FLUOstar Galaxy microplate reader (BMG Labtechnologies GmbH., Offenburg, Germany).
Statistics
SPSS software Version 14.0, 2004 (SPSS Inc., Chicago, IL) was used for statistical analysis. A t test was performed in Figures 1, 2, 3, and 4, and one-way ANOVA in Figure 5 using the least significant difference (LSD) test. A P value less than 0.05 was considered to be significant.
Figure 1.

Tertiary butyl hydroperoxide (tBHP)- and paraquat (PQ)-induced cell death and decrease of mitochondria membrane potential (MMP) in human corneal endothelium (HCE) cells. Cells were treated with various concentration of either tBHP or PQ for 16 hrs. For tBHP-treated cells, percentage of cells with An+/PI- or An+ and their MMP were analyzed immediately after the treatments using flow cytometry, whereas the analysis of PQ-treated cell were conducted after a 48-hr recovery under normal oxygen conditions in PQ free medium. (A) tBHP-induced percentage of cells with An+/PI- or An+. (B) tBHP-decreased MMP. (C) PQ-induced percentage of cells with An+/PI- or An+. (D) PQ-decreased MMP. * P < 0.05, ** P < 0.01 comparing with the negative controls.
Figure 2.

tBHP- and PQ-induced cellular oligonucleosome levels in HCE cells assessed using a Cell Death Detection ELISAPLUS kit. Identical cell culture conditions as those used in Figure 1 were used. (A) Effects of tBHP on cellular oligonucleosome levels. (B) Effects of PQ on cellular oligonucleosome levels. Optical density values reflect values after subtracting the negative control. * P < 0.05, ** P <0.01 comparing with the negative controls.
Figure 3.

Effects of hypoxia pretreatments on 60 μM tBHP and 500 μM PQ induced cell death and decrease of MMP. Cells were exposed to hypoxia for various time periods before the tBHP or PQ treatments. After the chemical treatments, effects of hypoxia pretreatments on 60 μM tBHP (A) and 500 μM PQ (C) treated cells were assessed. In addition, effects of hypoxia pretreatments on 60 μM tBHP (B) and 500 μM PQ (D) induced decreases in MMP were determined. # P < 0.1, * P < 0.05, ** P < 0.01 comparing with the values of 60 μM tBHP or 500 μM PQ.
Figure 4.

Hypoxia decreased the (A) 60 μM tBHP-induced and (B) 500 μM PQ-induced oligonucleosome levels. Optical density values reflect values after subtracting the negative control. * P < 0.05, ** P < 0.01 comparing with the values of 60 μM tBHP or 500 μM PQ.
Figure 5.
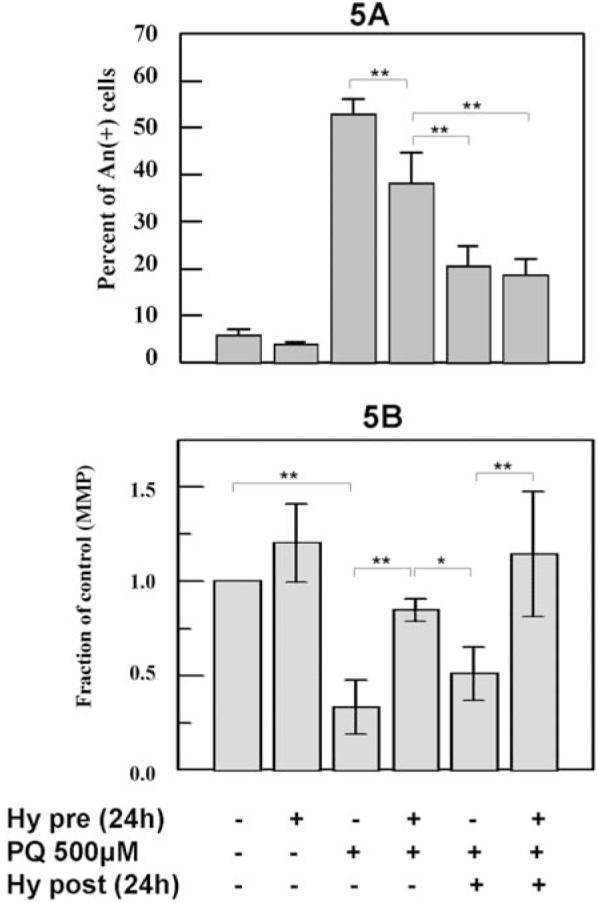
The comparison between hypoxia pretreatments and posttreatments on 500 μM PQ-treated cells. Cells were exposed to hypoxia for 24 hrs before and after the 500 μM PQ treatment. The induced (A) An+ cells and (B) MMP levels were determined. Note that 500 μM PQ induced a greater percentage of An+ cells than what was observed in Figure 1C, possibly due to a different lot of PQ obtained from supplier. * P < 0.05, ** P < 0.01.
Results
tBHP- and PQ-Induced Cell Death and Decreased MMP
Annexin V and PI double staining was originally developed to distinguish the early stage of apoptosis (An+/PI-) from necrosis and late stage of apoptosis (An+/PI+) (31). However, since clear definitions of different types of cell death are unsettled (32), we decided not to use the terms “apoptosis” and “necrosis” in this study. Instead, the results were presented as percentage of cells with An positive and PI negative staining (An+/PI-) and total percentage of cells that were An positive (An+), which includes An+/PI- plus An+/PI+ cells.
tBHP treatments increased the percentage of An+ cells in a dose-dependent manner and reached 78.9% at 100 μM (Fig. 1A). However, tBHP treatment only slightly increased the percentage of An+/PI- cells up to 60 μM tBHP (12.1%) and decreased to less than 2% at 100 μM (Fig. 1A). tBHP also induced a decrease in cell MMP in a dose-dependent manner (Fig. 1B). Compared with control cells, 66% and 94% reductions in MMP were observed at 60 and 100 μM tBHP, respectively (Fig. 1B).
In contrast to tBHP, a slow process may be required for PQ-induced cellular damage and cell death. Indeed, in the current study, no cell death was detected immediately after the 16-hr PQ exposure (data not shown), and significant cell death was only observed 48 hrs later. Similar to tBHP, increasing PQ caused an increase in the percentage of cells that were An+ with 32% at 500 μM (Fig. 1C). On the other hand, the percentage of cells that were An+/PI- increased to 16% at 200 μM and remained steady up to 500 μM of PQ (Fig. 1C). PQ also reduced cell MMP. The reduction was significant at 100 μM (P < 0.05) and reached 49% at 500 μM PQ compared with control cells (Fig. 1D).
tBHP- and PQ-Increased Cellular Oligonucleo-some Levels
No significant oligonucleosome production was observed at 20 μM tBHP treatment. However, beyond 20 μM tBHP, a significant (P < 0.01) dose-dependent oligonucleosome production was seen up to 60 μM tBHP (Fig. 2A). From 60 to 100 μM tBHP, the oligonucleosome levels remained steady (Fig. 2A). For PQ-treated cells, a significant oligonucleosome level was detected at 100 μM (P < 0.05), and this level stayed unchanged up to 300 μM (Fig. 2B). Beyond this point, a dose-dependent increase of PQ-induced oligonucleosome level was observed (Fig. 2B).
Effects of Hypoxia Pretreatments on tBHP- and PQ-Induced Cell Death and MMP
Compared with the negative controls, no significant increase in An+/PI- or An+ cells was observed in any of the hypoxia-only treated controls, indicating that the hypoxia itself was sublethal. We also tested effects of long hypoxia exposure (up to 72 hrs) on HCE cells, and no obvious induction of cell death was detected (data not shown). Figure 3A shows that 8 hrs of hypoxia pretreatment reduced the percentage of cells that were induced by 60 μM tBHP to become An+ from 42% to 15% (P < 0.05). A similar decrease was also detected with 18 or 24 hrs hypoxia pretreatment. On the other hand, hypoxia pretreatment failed to reduce the percentage of cells that were An+/PI- at any time point tested. Furthermore, hypoxia pretreatment (up to 24 hrs) had no effect on the dramatic reduction in MMP induced by 60 μM tBHP (Fig. 3B), despite the reduction in the percentage of cells that were An+ under the same hypoxia pretreatment conditions (Fig. 3A).
Figure 3C shows that hypoxia pretreatment only slightly (P < 0.1) reduced the percentage of An+ cells induced by 500 μM PQ from 32% to 25% at 24 hrs. Similarly, no significant decrease in percentage of cells that were An+/PI- was detected. In addition, hypoxia pretreatments significantly (P < 0.05) inhibited the decrease in MMP caused by 500 μM PQ at 4 hrs and reached the control level at 24 hrs hypoxia (Fig. 3D).
Effects of Hypoxia Pretreatment on tBHP- and PQ-Induced Cellular Oligonucleosome Levels
Hypoxia pretreatment resulted in a significant (P < 0.05) decrease in cellular oligonucleosome levels induced by 60 μM tBHP as early as 4 hrs (Fig. 4A). A reduction of 56% was seen at 8 hrs, and a similar decrease was also observed at 18 and 24 hrs. Similarly, the cellular oligonucleosome level induced by 500 μM PQ was also significantly (P < 0.05) reduced by hypoxia pretreatment (Fig. 4B) at 8 hrs and beyond.
Effect of Hypoxia Pretreatment and Posttreatment on PQ-Induced Cell Death and MMP
Since hypoxia pretreatment only slightly reduced the 500 μM PQ-induced cell death (Fig. 3C), PQ-induced oxidative damages may largely occur during the recovery period, even though it may be initiated during PQ exposure. Moreover, the ability of hypoxia to prevent cell death may be dissipated after 16 hrs of PQ treatment, resulting in less cell-death inhibition. To test this hypothesis, the ability of hypoxia to prevent PQ-induced cell death was tested by exposing cells to hypoxia for 24 hrs after the PQ treatment. Consistent with what was observed in Figure 3C, the increase in the percentage of cells with An+ caused by 500 μM PQ was significantly (P < 0.01) reduced by 24-hr hypoxia pretreatment from 53% to 38% (Fig. 5A). Compared with pretreatment, a significantly (P < 0.01) greater decrease in An+ cells (20%) was observed when cells were exposed to hypoxia for 24 hrs posttreatment. On the other hand, no additional reduction was detected when cells were exposed to hypoxia before and after the PQ treatment (Fig. 5A).
Compared with control cells, MMP was significantly (P < 0.01) reduced by 500 μM PQ, and this MMP decrease was significantly (P < 0.01) inhibited by 24-hr hypoxia pretreatment, as shown before (Fig. 5B). However, compared with pretreatment and control, a significantly (P < 0.05) lower MMP was observed in cells treated with 500 μM PQ followed by a 24-hr hypoxia posttreatment. In addition, no comparable MMP values between control cells and cells exposed to hypoxia before and after the PQ treatment were detected (Fig. 5B).
Discussion
The ion transport and barrier properties of the corneal endothelium are essential for maintaining normal corneal hydration and transparency. Endothelial cell density inexorably declines with age. However, the normal rate of cell loss is insufficient to affect endothelial function unless it is accelerated by surgery, trauma, disease, or inflammation. Slowing accelerated endothelial cell loss would reduce the demand for corneal transplantation. Similarly protecting donor corneal tissue during eye banking could increase the longevity of transplantation. Therefore, interest in understanding the mechanisms for endothelial cell loss and devising strategies to slow cell loss has increased. In this study, we have used two toxins (tBHP and PQ), both of which cause cell death by inducing cellular ROS, to establish in vitro models of cell death, so that the ability of hypoxia to protect the oxidative stress—induced cell death can be tested.
tBHP is a short-chain alkyl hydroperoxide and mimics the toxic effect of lipid hydroperoxides (33), a major product of lipid peroxidation (34). Therefore, tBHP is able to induce lipid oxidative damage, ROS formation, mitochondrial depolarization (24), glutathione depletion (35), and finally, cell death. In the present study, tBHP was observed to induce An+ cells in a dose-dependent manner from 20 to 100 μM (Fig. 1A). However, the induced cellular oligonucleosome level, a marker for apoptosis, peaked at 60 μM tBHP with no change at higher concentrations (Fig. 2A), indicating that two types of cell death may be involved below and beyond 60 μM tBHP. This result is consistent with a previous study that suggested that two types of cell death, apoptosis and necrosis, are responsible for tBHP-induced cell death depending on its concentration (22). On the other hand, PQ, a quaternary herbicide, does not directly produce oxidative damage to macromolecules. Instead, it induces the formation of the superoxide anion, which can be further transformed to hydrogen peroxide and hydroxyl radical by consequently adding a single electron to oxygen (23). Any of these ROS can interact with surrounding molecules, leading to oxidative damage and cell death. Similar to tBHP, an increase in An+ cells was detected with an increase in PQ concentrations (Fig. 1C). These results indicate that tBHP and PQ can be used as cytotoxins to induce cell death in HCE cells.
To test the ability of hypoxia to inhibit the induced cell death, HCE cells were exposed to hypoxia prior to tBHP treatment, whereas PQ-treated cells were exposed to hypoxia before and after the PQ treatment. It was found that tBHP- and PQ-induced cell death, as indicated by An and PI staining and oligonucleosome formation, were significantly inhibited by hypoxia. Since it has been shown that re-oxygenation after hypoxia (36) is capable of increasing the formation of superoxide anion and this induction can play a role in hypoxia preconditioning protection (37), it is unlikely that hypoxia prevents the induced cell death by reducing the ROS formation. Furthermore, the fact that a 48-hr recovery is required before significant PQ-induced cell death was detectable suggests that the cell death process caused by PQ may be initiated during the 16-hr PQ treatment, but the lethal damage occurred only during the recovery period. As a result, hypoxia posttreatment inhibited PQ-induced cell death more effectively than pretreatment, implying that it is likely that hypoxia largely affects the PQ-induced cell death process during the posttreatment rather than the initiation of this cell death process.
Mitochondria play a central role in determination of cell fate (38) by regulating the mitochondrial permeability transition pore (PTP) and the release of a number of apoptotic factors. In the current study, consistent with previous reports (24, 25), the tBHP- and PQ-induced cell death were accompanied by depolarization of MMP. However, no association between reduced cell death by hypoxia conditioning and MMP maintenance was observed when cells were treated with tBHP (Figs. 3A and B). This result differs from the previous reports (33, 39), in which cell death inhibition was accompanied by MMP preservation. Similar to tBHP, hypoxia, especially posttreatment hypoxia, was also observed to reduce PQ-induced cell death. Although hypoxia pretreatment was accompanied by a maintenance of MMP, no such MMP preservation was achieved by hypoxia posttreatments (Fig. 5B), which were more effective in protecting cells than pretreatment. Although MMP collapse may be an important component of the cell death cascade induced by these cytotoxins, these results suggest that cell death can still be attenuated downstream from MMP associated pro-apoptotic factors.
Hypoxia induces expression of a wide range of genes involved in many physiological processes (40), including several cell survival and death signaling pathways, such as the PI-3kinase-Akt (41) pathway. The activation of this pathway causes the phosphorylation and inactivation of the pro-apoptotic factor BAD (42). Release of Apaf-1 and cytochrome c from the mitochondrial membrane, which is needed for activation of caspase-9 (the initiating caspase in the mitochondrial pathway), is prevented when BAD is phosphorylated (42, 43). Moreover, a group of inhibitor of apoptosis (IAP) proteins plays an important role in regulation of caspase activity (44). For example, melanoma IAP (ML-IAP) was found to inhibit caspase-9 activity as well as the mitochondria-dependent cell apoptosis (45), suggesting ML-IAP can inhibit apoptosis, although this mitochondrial cell death pathway is already activated. Indeed, hypoxia can upregulate the IAP2 gene and result in resistance to cytochrome c—stimulated caspase activation (46, 47). Therefore, to determine the molecular mechanisms of hypoxia cytoprotection in HCE cells, the interactions between hypoxia-induced genes, including HIF-1α, and cell death proteins (e.g., Bcl-2 family and IAPs) and related signaling pathways will need further study.
In conclusion, we have developed an in vitro model of cell death using a human corneal endothelium cell line. Two cytotoxins tBHP and PQ, which induce ROS formation, killed HCE cells in a dose-dependent manner. The results revealed that hypoxia treatment is able to reduce the tBHP-and PQ-induced cell death, although no direct link between MMP preservation and the induced cell death was found. These in vitro cell culture results provide the preliminary evidence to test hypoxia as a tool to protect corneal endothelial loss during corneal storage, transplantation, or surgery.
Acknowledgments
We thank Miao Cui, Dongmei Xing, and Kah Tan-Allen for useful discussion and research assistance. We also appreciate the technique assistance with flow cytometry from Christiane Hassel (C.G.B., I.U.B.).
This research was supported by grant EY08834 from the National Institutes of Health.
References
- 1.Bonanno JA. Identity and regulation of ion transport mechanisms in the corneal endothelium. Prog Retin Eye Res. 2003;22:69–94. doi: 10.1016/s1350-9462(02)00059-9. [DOI] [PubMed] [Google Scholar]
- 2.Koh SW, Waschek JA. Corneal endothelial cell survival in organ cultures under acute oxidative stress: effect of VIP. Invest Ophthalmol Vis Sci. 2000;41:4085–4092. [PubMed] [Google Scholar]
- 3.Cho KS, Lee EH, Choi JS, Joo CK. Reactive oxygen species-induced apoptosis and necrosis in bovine corneal endothelial cells. Invest Ophthalmol Vis Sci. 1999;40:911–919. [PubMed] [Google Scholar]
- 4.Lundberg B, Jonsson M, Behndig A. Postoperative corneal swelling correlates strongly to corneal endothelial cell loss after phacoemulsification cataract surgery. Am J Ophthalmol. 2005;139:1035–1041. doi: 10.1016/j.ajo.2004.12.080. [DOI] [PubMed] [Google Scholar]
- 5.Bourges JL, Valamanesh F, Torriglia A, Jeanny JC, Savoldelli M, Renard G, BenEzra D, de Kozak Y, Behar-Cohen F. Cornea graft endothelial cells undergo apoptosis by way of an alternate (caspaseindependent) pathway. Transplantation. 2004;78:316–323. doi: 10.1097/01.tp.0000128614.63503.d5. [DOI] [PubMed] [Google Scholar]
- 6.Sagoo P, Chan G, Larkin DF, George AJ. Inflammatory cytokines induce apoptosis of corneal endothelium through nitric oxide. Invest Ophthalmol Vis Sci. 2004;45:3964–3973. doi: 10.1167/iovs.04-0439. [DOI] [PubMed] [Google Scholar]
- 7.Adamis AP, Filatov V, Tripathi BJ, Tripathi RC. Fuchs’ endothelial dystrophy of the cornea. Surv Ophthalmol. 1993;38:149–168. doi: 10.1016/0039-6257(93)90099-s. [DOI] [PubMed] [Google Scholar]
- 8.Serbecic N, Beutelspacher SC. Anti-oxidative vitamins prevent lipidperoxidation and apoptosis in corneal endothelial cells. Cell Tissue Res. 2005;320:465–475. doi: 10.1007/s00441-004-1030-3. [DOI] [PubMed] [Google Scholar]
- 9.Buddi R, Lin B, Atilano SR, Zorapapel NC, Kenney MC, Brown DJ. Evidence of oxidative stress in human corneal diseases. J Histochem Cytochem. 2002;50:341–351. doi: 10.1177/002215540205000306. [DOI] [PubMed] [Google Scholar]
- 10.Borderie VM, Baudrimont M, Vallee A, Ereau TL, Gray F, Laroche L. Corneal endothelial cell apoptosis in patients with Fuchs’ dystrophy. Invest Ophthalmol Vis Sci. 2000;41:2501–2505. [PubMed] [Google Scholar]
- 11.Li QJ, Ashraf MF, Shen DF, Green WR, Stark WJ, Chan CC, O’Brien TP. The role of apoptosis in the pathogenesis of Fuchs endothelial dystrophy of the cornea. Arch Ophthalmol. 2001;119:1597–1604. doi: 10.1001/archopht.119.11.1597. [DOI] [PubMed] [Google Scholar]
- 12.Piret JP, Lecocq C, Toffoli S, Ninane N, Raes M, Michiels C. Hypoxia and CoCl2 protect HepG2 cells against serum deprivation- and t-BHP-induced apoptosis: a possible anti-apoptotic role for HIF-1. Exp Cell Res. 2004;295:340–349. doi: 10.1016/j.yexcr.2004.01.024. [DOI] [PubMed] [Google Scholar]
- 13.Liu J, Narasimhan P, Yu F, Chan PH. Neuroprotection by hypoxic preconditioning involves oxidative stress-mediated expression of hypoxia-inducible factor and erythropoietin. Stroke. 2005;36:1264–1269. doi: 10.1161/01.STR.0000166180.91042.02. [DOI] [PubMed] [Google Scholar]
- 14.Seta KA, Yuan Y, Spicer Z, Lu G, Bedard J, Ferguson TK, Pathrose P, Cole-Strauss A, Kaufhold A, Millhorn DE. The role of calcium in hypoxia-induced signal transduction and gene expression. Cell Calcium. 2004;36:331–340. doi: 10.1016/j.ceca.2004.02.006. [DOI] [PubMed] [Google Scholar]
- 15.Semenza GL.O2-regulated gene expression: transcriptional control of cardiorespiratory physiology by HIF-1 J Appl Physiol 2004961173–1177.; discussion 1170-1172, [DOI] [PubMed] [Google Scholar]
- 16.Greijer AE, van der Groep P, Kemming D, Shvarts A, Semenza GL, Meijer GA, van de Wiel MA, Belien JA, van Diest PJ, van der Wall E. Up-regulation of gene expression by hypoxia is mediated predominantly by hypoxia-inducible factor 1 (HIF-1) J Pathol. 2005;206:291–304. doi: 10.1002/path.1778. [DOI] [PubMed] [Google Scholar]
- 17.Xing D, Sun X, Li J, Cui M, Tan-Allen K, Bonanno JA. Hypoxia preconditioning protects corneal stromal cells against induced apoptosis. Exp Eye Res. 2006;82:780–787. doi: 10.1016/j.exer.2005.09.020. [DOI] [PMC free article] [PubMed] [Google Scholar]
- 18.Grimm C, Wenzel A, Groszer M, Mayser H, Seeliger M, Samardzija M, Bauer C, Gassmann M, Reme CE. HIF-1-induced erythropoietin in the hypoxic retina protects against light-induced retinal degeneration. Nat Med. 2002;8:718–724. doi: 10.1038/nm723. [DOI] [PubMed] [Google Scholar]
- 19.Zhu Y, Ohlemiller KK, McMahan BK, Gidday JM. Mouse models of retinal ischemic tolerance. Invest Ophthalmol Vis Sci. 2002;43:1903–1911. [PubMed] [Google Scholar]
- 20.Bonanno JA, Nyguen T, Biehl T, Soni S. Can variability in corneal metabolism explain the variability in corneal swelling? Eye Contact Lens. 2003;29:S7–S9. doi: 10.1097/00140068-200301001-00003. [DOI] [PubMed] [Google Scholar]
- 21.Bourne WM, Hodge DO, McLaren JW. Estimation of corneal endothelial pump function in long-term contact lens wearers. Invest Ophthalmol Vis Sci. 1999;40:603–611. [PubMed] [Google Scholar]
- 22.Haidara K, Morel I, Abalea V, Barre M Gascon, Denizeau F. Mechanism of tert-butylhydroperoxide induced apoptosis in rat hepatocytes: involvement of mitochondria and endoplasmic reticulum. Biochim Biophys Acta. 2002;1542:173–185. doi: 10.1016/s0167-4889(01)00178-1. [DOI] [PubMed] [Google Scholar]
- 23.Suntres ZE. Role of antioxidants in paraquat toxicity. Toxicology. 2002;180:65–77. doi: 10.1016/s0300-483x(02)00382-7. [DOI] [PubMed] [Google Scholar]
- 24.Zhao K, Luo G, Giannelli S, Szeto HH. Mitochondria-targeted peptide prevents mitochondrial depolarization and apoptosis induced by tert-butyl hydroperoxide in neuronal cell lines. Biochem Pharmacol. 2005;70:1796–1806. doi: 10.1016/j.bcp.2005.08.022. [DOI] [PubMed] [Google Scholar]
- 25.McCarthy S, Somayajulu M, Sikorska M, Borowy-Borowski H, Pandey S. Paraquat induces oxidative stress and neuronal cell death; neuroprotection by water-soluble Coenzyme Q10. Toxicol Appl Pharmacol. 2004;201:21–31. doi: 10.1016/j.taap.2004.04.019. [DOI] [PubMed] [Google Scholar]
- 26.Griffith M, Osborne R, Munger R, Xiong X, Doillon CJ, Laycock NL, Hakim M, Song Y, Watsky MA. Functional human corneal equivalents constructed from cell lines. Science. 1999;286:2169–2172. doi: 10.1126/science.286.5447.2169. [DOI] [PubMed] [Google Scholar]
- 27.Wyllie AH. Glucocorticoid-induced thymocyte apoptosis is associated with endogenous endonuclease activation. Nature. 1980;284:555–556. doi: 10.1038/284555a0. [DOI] [PubMed] [Google Scholar]
- 28.Shui YB, Fu JJ, Garcia C, Dattilo LK, Rajagopal R, McMillan S, Mak G, Holekamp NM, Lewis A, Beebe DC. Oxygen distribution in the rabbit eye and oxygen consumption by the lens. Invest Ophthalmol Vis Sci. 2006;47:1571–1580. doi: 10.1167/iovs.05-1475. [DOI] [PubMed] [Google Scholar]
- 29.Cossarizza A, Baccarani-Contri M, Kalashnikova G, Franceschi C. A new method for the cytofluorimetric analysis of mitochondrial membrane potential using the J-aggregate forming lipophilic cation 5,5′,6,6′-tetrachloro-1,1′,3,3′-tetraethylbenzimidazolcarbocyanine iodide (JC-1) Biochem Biophys Res Commun. 1993;197:40–45. doi: 10.1006/bbrc.1993.2438. [DOI] [PubMed] [Google Scholar]
- 30.Rodriguez M, Schaper J. Apoptosis: measurement and technical issues. J Mol Cell Cardiol. 2005;38:15–20. doi: 10.1016/j.yjmcc.2004.11.002. [DOI] [PubMed] [Google Scholar]
- 31.Vermes I, Haanen C, Steffens-Nakken H, Reutelingsperger C. A novel assay for apoptosis. Flow cytometric detection of phosphatidylserine expression on early apoptotic cells using fluorescein labelled Annexin V. J Immunol Methods. 1995;184:39–51. doi: 10.1016/0022-1759(95)00072-i. [DOI] [PubMed] [Google Scholar]
- 32.Kroemer G, El-Deiry WS, Golstein P, Peter ME, Vaux D, Vandenabeele P, Zhivotovsky B, Blagosklonny MV, Malorni W, Knight RA, Piacentini M, Nagata S, Melino G. Classification of cell death: recommendations of the Nomenclature Committee on Cell Death. Cell Death Differ. 2005;12(Suppl 2):1463–1467. doi: 10.1038/sj.cdd.4401724. [DOI] [PubMed] [Google Scholar]
- 33.Zhu YG, Chen XC, Chen ZZ, Zeng YQ, Shi GB, Su YH, Peng X. Curcumin protects mitochondria from oxidative damage and attenuates apoptosis in cortical neurons. Acta Pharmacol Sin. 2004;25:1606–1612. [PubMed] [Google Scholar]
- 34.Girotti AW. Lipid hydroperoxide generation, turnover, and effector action in biological systems. J Lipid Res. 1998;39:1529–1542. [PubMed] [Google Scholar]
- 35.Schnellmann RG. Mechanisms of t-butyl hydroperoxide-induced toxicity to rabbit renal proximal tubules. Am J Physiol. 1988;255:C28–C33. doi: 10.1152/ajpcell.1988.255.1.C28. [DOI] [PubMed] [Google Scholar]
- 36.Therade-Matharan S, Laemmel E, Carpentier S, Obata Y, Levade T, Duranteau J, Vicaut E. Reactive oxygen species production by mitochondria in endothelial cells exposed to reoxygenation after hypoxia and glucose depletion is mediated by ceramide. Am J Physiol Regul Integr Comp Physiol. 2005;289:R1756–R1762. doi: 10.1152/ajpregu.00480.2004. [DOI] [PubMed] [Google Scholar]
- 37.Wang X, Tong M, Chinta S, Raj JU, Gao Y. Hypoxia-induced reactive oxygen species downregulate ETB receptor-mediated contraction of rat pulmonary arteries. Am J Physiol Lung Cell Mol Physiol. 2005;290:L570–L578. doi: 10.1152/ajplung.00262.2005. [DOI] [PubMed] [Google Scholar]
- 38.Green DR, Reed JC. Mitochondria and apoptosis. Science. 1998;281:1309–1312. doi: 10.1126/science.281.5381.1309. [DOI] [PubMed] [Google Scholar]
- 39.Zhao K, Zhao GM, Wu D, Soong Y, Birk AV, Schiller PW, Szeto HH. Cell-permeable peptide antioxidants targeted to inner mitochondrial membrane inhibit mitochondrial swelling, oxidative cell death, and reperfusion injury. J Biol Chem. 2004;279:34682–34690. doi: 10.1074/jbc.M402999200. [DOI] [PubMed] [Google Scholar]
- 40.Seta KA, Millhorn DE. Functional genomics approach to hypoxia signaling. J Appl Physiol. 2004;96:765–773. doi: 10.1152/japplphysiol.00836.2003. [DOI] [PubMed] [Google Scholar]
- 41.Beitner-Johnson D, Rust RT, Hsieh TC, Millhorn DE. Hypoxia activates Akt and induces phosphorylation of GSK-3 in PC12 cells. Cell Signal. 2001;13:23–27. doi: 10.1016/s0898-6568(00)00128-5. [DOI] [PubMed] [Google Scholar]
- 42.Sawyer ST, Jacobs-Helber SM. Unraveling distinct intracellular signals that promote survival and proliferation: study of erythropoietin, stem cell factor, and constitutive signaling in leukemic cells. J Hematother Stem Cell Res. 2000;9:21–29. doi: 10.1089/152581600319586. [DOI] [PubMed] [Google Scholar]
- 43.Cantley LC. The phosphoinositide 3-kinase pathway. Science. 2002;296:1655–1657. doi: 10.1126/science.296.5573.1655. [DOI] [PubMed] [Google Scholar]
- 44.LaCasse EC, Baird S, Korneluk RG, MacKenzie AE. The inhibitors of apoptosis (IAPs) and their emerging role in cancer. Oncogene. 1998;17:3247–3259. doi: 10.1038/sj.onc.1202569. [DOI] [PubMed] [Google Scholar]
- 45.Vucic D, Stennicke HR, Pisabarro MT, Salvesen GS, Dixit VM. ML-IAP, a novel inhibitor of apoptosis that is preferentially expressed in human melanomas. Curr Biol. 2000;10:1359–1366. doi: 10.1016/s0960-9822(00)00781-8. [DOI] [PubMed] [Google Scholar]
- 46.Dong Z, Nishiyama J, Yi X, Venkatachalam MA, Denton M, Gu S, Li S, Qiang M. Gene promoter of apoptosis inhibitory protein IAP2: identification of enhancer elements and activation by severe hypoxia. Biochem J. 2002;364:413–421. doi: 10.1042/BJ20011431. [DOI] [PMC free article] [PubMed] [Google Scholar]
- 47.Dong Z, Wang JZ, Yu F, Venkatachalam MA. Apoptosis-resistance of hypoxic cells: multiple factors involved and a role for IAP-2. Am J Pathol. 2003;163:663–671. doi: 10.1016/S0002-9440(10)63693-0. [DOI] [PMC free article] [PubMed] [Google Scholar]