Abstract
Rationale: Ventilatory motor output is an important determinant of upper airway patency during sleep.
Objectives: We hypothesized that central hypocapnic hypopnea would lead to increased expiratory upper airway resistance and pharyngeal narrowing during non-REM sleep.
Methods: Noninvasive positive pressure ventilation was used to induce hypocapnic hypopnea in 20 healthy subjects. Expiratory pressure was set at the lowest pressure (2 cm H2O), and inspiratory pressure was increased gradually during each 3-minute noninvasive positive pressure ventilation trial by increments of 2 cm H2O. Analysis 1 (n = 9) included measured retropalatal cross-sectional area (CSA) using nasopharyngoscope to compare CSA at five points of the respiratory cycle between control (eupneic) and hypopneic breaths. The pharyngeal pressure (Pph) was measured using a catheter positioned at the palatal rim. Analysis 2 (n = 11) included measured supraglottic pressure and airflow to compare inspiratory and expiratory upper airway resistance (RUA) at peak flow between eupneic and hypopneic breaths.
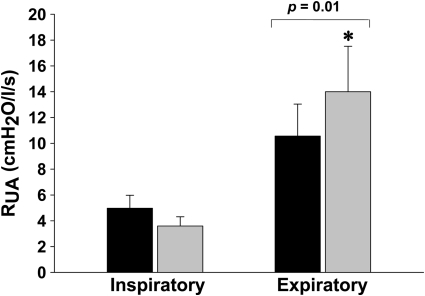
Measurements and Main Results: Expiratory CSA during hypopneic breaths was decreased relative to eupnea (CSA at beginning of expiration [BI]: 101.5 ± 6.3 vs. 121.6 ± 8.9%; P < 0.05); Pph-BI was lower than that generated during eupnea (1.5 ± 0.3 vs. 3.3 ± 0.9 cm H2O; P < 0.05). Body mass index was an independent predictor of retropalatal narrowing during hypopnea. Hypopnea-RUA increased during expiration relative to eupnea (14.0 ± 5.7 vs. 10.6 ± 2.5 cm H2O/L/s; P = 0.01), with no change in inspiratory resistance.
Conclusions: Expiratory pharyngeal narrowing occurs during central hypocapnic hypopnea. Reduced ventilatory drive leads to increased expiratory, but not inspiratory, upper airway resistance. Central hypopneas are obstructive events because they cause pharyngeal narrowing.
Keywords: ventilatory motor output, expiratory, upper airway resistance
AT A GLANCE COMMENTARY
Scientific Knowledge on the Subject
Pharyngeal narrowing/obstruction during sleep is often described as an inspiratory phenomenon resulting from obstructive hypopnea/apnea. It is unknown, however, whether central hypopnea can lead to airway narrowing.
What This Study Adds to the Field
Central hypopnea results in pharyngeal narrowing during the expiratory phase, indicating a possible role in the pathogenesis of upper airway obstruction during sleep.
The pathogenesis of upper airway obstruction during sleep may involve an interaction between unstable ventilatory control mechanisms and unfavorable pharyngeal anatomy (1–5, 6). Ventilatory motor output is an important determinant of upper airway patency, especially in individuals with high susceptibility to pharyngeal collapse during sleep, such as patients with sleep apnea and individuals who snore (7, 8, 11). Increased ventilatory motor output decreases upper airway resistance (9, 10), whereas reduced ventilatory motor output leads to increased upper airway resistance (8). When ventilatory drive oscillates, as in periodic breathing, changes in ventilatory motor output are associated with reciprocal changes in upper airway resistance (7, 8, 11), including upper airway obstruction occurring when ventilatory drive reaches a nadir and during central apnea in susceptible individuals (6, 12). Nevertheless, the mechanism of pharyngeal narrowing or obstruction during periods of low ventilatory drive, when subatmospheric, intraluminal pressure is feeble, remains unclear.
Pharyngeal occlusion during obstructive apnea is often described as an inspiratory phenomenon, caused by negative (subatmospheric) collapsing pressure. However, several lines of evidence indicate that expiratory narrowing may be a significant contributor to pharyngeal obstruction during sleep. These include: (1) increased expiratory resistance before an obstructive apnea (10, 30); (2) the occurrence of pharyngeal occlusion during central apnea (13); (3) expiratory airflow ceasing or becoming limited whenever the upstream pressure is below or closer to the critical closing pressure (Pcrit), respectively (14); and (4) the progressive expiratory narrowing that occurs before an obstructive apnea (23). Therefore, we hypothesized that reduced ventilatory motor output during non-REM (NREM) sleep would result in expiratory pharyngeal narrowing. We measured upper airway resistance and pharyngeal cross-sectional area during induced central hypocapnic hypopnea in normal healthy subjects who were free of flow limitation and obstructive sleep apnea (OSA). Results of this study have been reported in the form of abstracts (15, 16).
METHODS
The Human Investigation Committee of the Wayne State University School of Medicine and the Dingell Veterans Affairs Medical Center approved the experimental protocol. Informed written consent was obtained. Subjects were screened for sleep-disordered breathing by a baseline polysomnography. Female subjects were not pregnant or on birth control pills.
The subjects were connected to the circuit with a silicone rubber mask strapped to the face to prevent leaks. The mask was connected to a heated pneumotachometer that was used to measure ventilation and timing. End-tidal Pco2 was measured at the nasal orifice using a tube connected to a mass spectrometry. Sleep staging and arousals were measured and scored using standard definitions (17, 18). Subjects included in this analysis were in stable stage-2 or stage-3 sleep with no evidence of an arousal during the hypocapnic exposure.
In nine subjects, pharyngeal pressure (Pph) was measured at the palatal rim. A fiberoptic bronchoscope was used to visualize the pharyngeal airway during NREM sleep. In the following 11 subjects, upper airway pressure was measured at the supraglottic level (Psg). Subjects were included if they had no sleep apnea or inspiratory flow limitation (IFL) (>25% at baseline breaths).
Induction of Hypocapnic Hypopnea
We induced hypocapnic hypopnea during NREM sleep as previously described (19). Noninvasive positive pressure ventilation was applied for 3 minutes and then terminated abruptly, with the expiratory pressure set at its lowest pressure (2 cm H2O) throughout the study. The inspiratory positive airway pressure (IPAP) was increased gradually in 1- to 2-cm H2O increments at the beginning of each mechanical hyperventilation trial and was reduced to 2 cm H2O at the end of each 3 minutes of noninvasive positive pressure ventilation. The hyperventilation trials were repeated at higher IPAP (1–2 cm H2O) until central hypopnea was obtained. Hypocapnic hypopnea was defined as a reduction in flow of at least 30% from control without inspiratory effort (see Figure E1 in the online supplement).
Study Design and Data Analysis
Analysis 1.
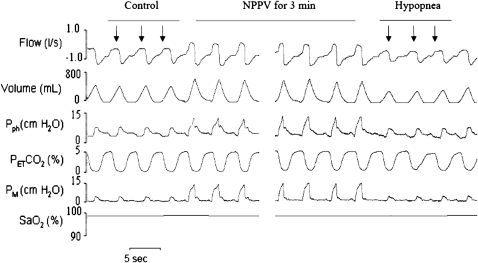
We measured cross-sectional area (CSA), Pph, and flow simultaneously in five different stages of respiratory cycle: (1) beginning inspiration (BI), after which flow crossed from negative to positive; (2) peak inspiration (PI); (3) end inspiration/beginning expiration (EI/BE); (4) peak expiration (PE); and (5) end expiration (EE), before which flow crossed from negative to positive. In each hypopnea trial, we compared the three breaths of hypocapnic hypopnea with the three control breaths preceding mechanical ventilation (MV) (Figure 1). The absolute value of retropalatal CSA was obtained from five different phases of the respiratory cycle by manually outlining the retropalatal lumen using computer software. The magnitude of change in airway size between control and hypopnea at BE was defined as ΔCSA-BE.
Figure 1.
Polygraph record of a trial from analysis 1 that illustrates breaths before and during noninvasive positive pressure ventilation (NPPV) followed by central hypopnea. Three breaths preceding NPPV (control, arrows) were compared with the breaths after termination of NPPV (hypocapnic hypopnea, arrows). PetCO2 = end tidal CO2; Pph = pharyngeal pressure; PM = mask pressure; SaO2 = arterial oxygen saturation.
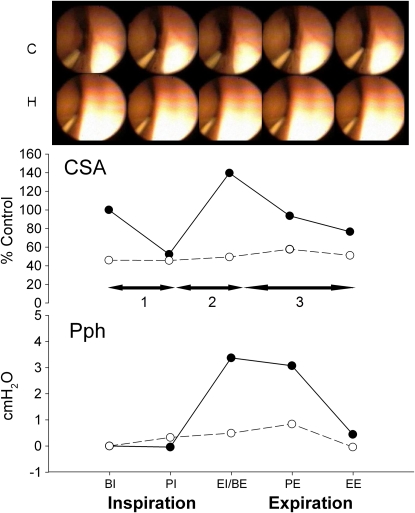
To assess the dynamic changes in pharyngeal compliance within the respiratory cycle, the CSA–Pph relationship was calculated as ΔCSA/ΔPph for three phases: (1) from beginning of inspiration to nadir CSA (BI–nadir) at peak inspiration, (2) from nadir to maximal CSA (CSAnadir–CSAmax) at peak expiration, and (3) from maximal CSA to end expiration (as depicted in Figure 2, horizontal arrows).
Figure 2.
Fiberoptic images of the retropalatal airway from representative subject for one respiratory cycle. The cross-sectional area (CSA) and pharyngeal pressure (Pph) were measured simultaneously for control (closed circle and solid line) and central hypopnea after mechanical hyperventilation (open circles and dashed line). Note the smaller area and pressure in hypopnea compared with control. Horizontal arrows refer to the three dynamic phases of each analyzed breath. BE = beginning of expiration; BI = beginning of inspiration; EE = end expiration; EI = end inspiration; PE = peak expiration; PI = peak inspiration.
Analysis 2.
RUA was measured on a breath-by-breath basis as a numeric representation of the maximal linear part of the pressure-flow loop during inspiratory and expiratory phases (Figure E1). Specifically, RUA was calculated as flow/Psg at the maximal flow. We compared five eupneic control breaths preceding MV with the first three hypopneic breaths after termination of MV for 3 minutes. Each breath was analyzed for IFL, Psg, and flow. IFL was defined as the dissociation in the pressure–flow linear relationship. To measure the changes of lung volumes at end expiration between the control and hypopnea breaths, we measured the end expiratory supraglottic pressure (EEP) at 0 flow for three consecutive control and hypopnea breaths.
Statistical analysis.
For analysis 1, a two-way repeated-measures ANOVA was used to compare each dependent variable (CSA, Pph, and flow). The two factors were (1) control versus hypocapnic hypopnea and (2) respiratory cycle phases from beginning of inspiration to end expiration (five phases). A paired t test was used to compare the mean values of ΔCSA/ΔPph between eupnea and hypopnea. A Pearson's correlation was used to determine the association between the retropalatal airway CSA at peak inspiration and expiration during eupnea and hypopnea with physiologic and demographic markers. A forward stepwise regression analysis was used to ascertain potential determinants of retropalatal airway expiratory narrowing during hypocapnic hypopnea using physiologic and demographic markers. For Analysis 2, a paired, two-tailed t test was used to compare each dependent variable between eupnea and hypopnea breaths.
RESULTS
We studied 20 healthy subjects who were free of sleep apnea as confirmed by polysomnography. A total of 68 trials were analyzed from all 20 subjects (average, 3.4 trials per subject). Detailed demographic characteristics are shown in Table 1. Mechanical hyperventilation caused moderate hypocapnia after 3 minutes of MV (ΔPetCO2 = −2.2 ± 0.4 mm Hg). For all 20 subjects, termination of MV resulted in hypocapnic hypopnea manifested by decreased inspiratory minute ventilation (Vi), tidal volume (Vt), expiratory time (Te), and mean inspiratory flow (Vt/Ti) (P < 0.05). The inspiratory time/total breath duration (Ti/Ttot) and inspiratory time (Ti) increased during post-MV hypopnea relative to control (P < 0.05), whereas no change occurred in breathing frequency (Table 2).
TABLE 1.
SUBJECT CHARACTERISTICS
| Protocol 1 | Protocol 2 | |
|---|---|---|
| n | 11 | 9 |
| Age, yr | 36.4 ± 3.1 | 29.5 ± 2.2 |
| BMI, kg/m2 | 25.6 ± 1.5 | 26 ± 1.6 |
| Gender (F/M) | 3/8 | 4/5 |
| NC, cm | 41.4 ± 1.4 | 36.9 ± 0.8 |
| Baseline PetCO2, mm Hg | 44.3 ± 1.3 | 40.8 ± 2.5 |
| Hypopnea PetCO2, mm Hg | 42.1 ± 0.9 | 38.4 ± 1.9 |
All data are mean ± SE.
Definition of abbreviations: BMI = body mass index; NC = neck circumference; PetCO2, end tidal CO2.
TABLE 2.
HYPOCAPNIC HYPOPNEA: VENTILATORY PARAMETERS (n = 20)
| Parameter | Control | Hypopnea |
|---|---|---|
| Vi, L/min* | 7.7 ± 0.4 | 4.5 ± 0.3 |
| Vt, L* | 0.47 ± 0.03 | 0.28 ± 0.02 |
| Fb, breath/min | 16.5 ± 0.5 | 16.5 ± 0.6 |
| Ti, s* | 1.81 ± 0.07 | 2.01 ± 0.13 |
| Te, s* | 1.85 ± 0.07 | 1.61 ± 0.07 |
| Ti/Ttot* | 0.49 ± 0.01 | 0.55 ± 0.02 |
| Vt/Ti, L/s* | 0.26 ± 0.02 | 0.14 ± 0.01 |
Definition of abbreviations: Fb = breathing frequency; Te = expiratory time; Ti = inspiratory time; Ti/Ttot = inspiratory time/total breath duration; Vi = inspiratory minute ventilation; Vt = tidal volume; Vt/Ti = mean inspiratory flow.
P < 0.05 for control vs. hypopnea (mean ± SE).
Retropalatal CSA
Figure 2 depicts the changes in the retropalatal CSA between eupnea and hypopnea during one respiratory cycle in a representative subject. During hypocapnic hypopnea, the retropalatal CSA was reduced remarkably, especially at expiratory phase, in addition to the dampening in the pharyngeal wall motion throughout the respiratory cycle (supplemental video recording of the retropalatal airway during control and hypopnea conditions). At the beginning of expiration, the simultaneous Pph was 3 cm H2O less than control. Therefore, the decrease in upper airway size was concordant with the decrease of the intraluminal pressure measured at the palatal rim.
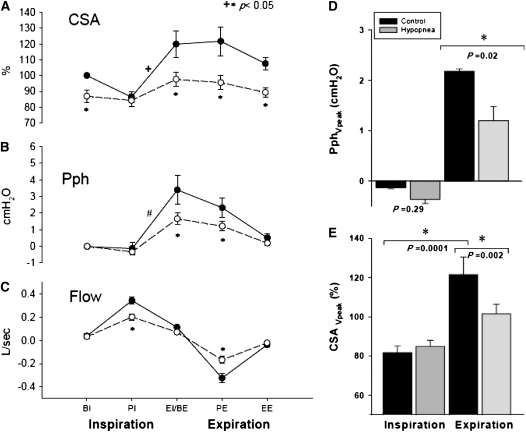
Figure 3 illustrates the group differences for CSA, Pph, and flow between eupnea and hypopnea. During hypocapnic hypopnea, the retropalatal CSA was reduced relative to eupnea breaths throughout the respiratory cycle (P = 0.004); specifically, there was a significant reduction in CSA at BE, PE, and EE (−22, −26, and −18% of control, respectively; P < 0.005). There was an interaction between the two factors, indicating that pharyngeal narrowing during hypopnea depended on the respiratory cycle phase (P = 0.002). There was a significant within-breath change in the retropalatal CSA during the eupnea breaths (P < 0.001) but not during hypopnea (P = not significant) (Figure 3A). CSA at peak expiratory flow was decreased significantly during hypopnea compared with eupnea. Nadir eupnea CSA occurred at peak inspiratory flow and maximum inspiratory effort; there was no change in nadir inspiratory CSA between eupnea and hypopnea (P = 0.28) (Figure 3E). Thus, hypocapnic hypopnea was associated with decreased retropalatal CSA and dampening of the dynamic variation of CSA within a breath.
Figure 3.
(A) Retropalatal cross-sectional area (CSA) during control and hypocapnic hypopnea. Note the significant CSA change throughout the respiratory cycle within the control breaths in comparison to the hypopnea breaths. Control (closed circles) and hypocapnic hypopnea (open circles). There was a statistically significant interaction between respiratory phase and breath type (control vs. hypopnea) (+P = 0.002). (B) Pharyngeal pressure (Pph) during control (closed circles) and hypocapnic hypopnea (open circles). Note the difference in Pph within control breaths (#P < 0.001). (C) Flow during control (closed circles) and hypocapnic hypopnea (open circles). BE = beginning expiration; BI = beginning inspiration; EE = end expiration; EI = end inspiration; PE = peak expiration; PI = peak inspiration. (D) Pph at peak inspiratory and expiratory flow during control (black bars) and hypopnea (gray bars). Pph at peak expiratory flow decreased significantly during hypopnea. (E) CSA at peak inspiratory and expiratory flow during control and hypopnea. CSA at peak inspiratory flow did not change between control and hypopnea. CSA at peak expiratory flow decreased significantly during hypopnea. CSA reached nadir at peak inspiration. All data are mean ± SE.
The occurrence of within-breath changes in CSA was accompanied by changes in Pph. Termination of inspiratory effort and initiation of expiration was associated with increased retropalatal pressure in the control period but not during hypopnea (3.4 ± 0.8 vs. 1.6 ± 0.4 cm H2O, respectively; P < 0.05) (Figure 3B). Peak expiratory Pph decreased significantly during hypopnea relative to control (1.2 ± 0.3 vs. 2.2 ± 0.6 cm H2O; respectively; P < 0.05) (Figure 3D).
To ascertain the potential determinants of the expiratory pharyngeal narrowing, we used a forward stepwise regression analysis (n = 9). This analysis revealed that the dependent variable, ΔCSA-BE (between control and hypopnea), can be predicted from the rapid increase in expiratory pressure ΔPph (PI-BE) (r2 = 0.56; P = 0.02). Furthermore, ΔPph (PI-BE) can be predicted from the increased body mass index (BMI) (r2 = 0.74; P = 0.005). The predictive power for ΔPph PI-PE and ΔCSABE was 99 and 63%, respectively. Neck circumference (NC) did not correlate with the occurrence of retropalatal narrowing during hypopnea (P = 0.4) (Table E2). Finally, eupneic CSA at PE positively correlated with BMI and the corresponding Pph (PE) (P = 0.02 and 0.03, respectively). Eupneic CSA at PI did not correlate with age, BMI, NC, IFL, or the corresponding Pph. Hypopneic CSA at PI and PE negatively correlated with the percentage of IFL breaths during eupnea (P = 0.005 and 0.02, respectively). The CSA during hypopnea did not correlate with age, BMI, or NC (Table E3).
Relationship of Retropalatal Cross-sectional Area versus Pph
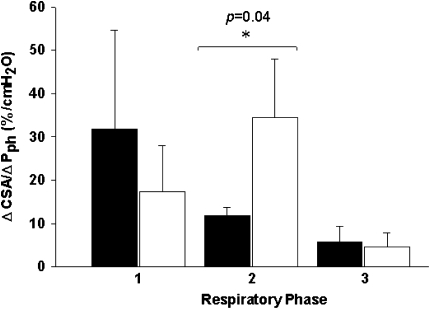
The relationship between retropalatal CSA and Pph during eupneic breathing is dynamic, reflecting within-breath changes in pharyngeal compliance. Retropalatal airway compliance increased during hypopnea after cessation of inspiratory effort until peak expiration was reached (11.9 ± 1.9 vs. 34.5 ± 13.4 mm2/cm H2O; P < 0.05) (Figure 4). There was no change in inspiratory CSA–Pph relationship between control and hypopnea.
Figure 4.
Relationship of cross-sectional area (CSA) to pharyngeal pressure (Pph) during the control (black bars) and hypocapnic hypopnea (white bars) in three dynamic phases from one respiratory cycle for three different phases: (1) beginning of inspiration to nadir CSA (BI-nadir) at peak inspiration, (2) from nadir to maximal CSA (CSAnadir–CSAmax) at peak expiration, and (3) from maximal CSA to end expiration (as depicted previously by the horizontal arrows in Figure 2). ΔCSA/ΔPph were calculated as the CSA and the corresponding Pph change between the beginning and the end of each phase transition.
Upper Airway Mechanics
The effect of induced hypocapnic hypopnea on inspiratory and expiratory RUA during control and hypocapnic hypopnea periods is shown in Figure 5. There was no change in inspiratory RUA between eupnea and hypopnea (P = 0.4). In contrast, expiratory RUA increased between eupnea and hypopnea (10.6 ± 2.5 vs. 14.0 ± 5.7 cm H2O/L/s; P = 0.01).
Figure 5.
Inspiratory and expiratory upper airway resistance (RUA) measured during the control (black bars) and hypocapnic hypopnea (gray bars). Expiratory RUA increased significantly during hypopnea.
Changes in the End-Expiratory Pressure during Central Hypopnea
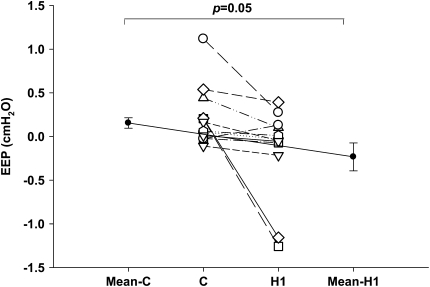
Individual and group mean EEP measured at 0 flow for eupnea and three consecutive hypopnea breaths are shown in Figure 6. There was a significant reduction in EEP between eupnea and first hypopnea breath (H1) after the termination of MV in 10 out of 11 subjects (0.16 ± 0.06 cm H2O to −0.23 ± 0.16 cm H2O, respectively; P = 0.05). The reduction in EEP between eupnea and the successive hypopnea breaths was not significant (C vs. H2, P = 0.88; C vs. H3, P = 0.73).
Figure 6.
Individual (open circles) and group (closed circles) mean end-expiratory supraglottic pressure (EEP) for control (C) and first hypopnea breath (H1).
DISCUSSION
Our study demonstrated several novel and significant findings regarding the effects of reduced ventilatory motor output on pharyngeal mechanics during NREM sleep. (1) Retropalatal CSA changed in a dynamic fashion during eupnea; inspiratory narrowing was followed by abrupt widening upon termination of inspiratory effort. (2) Induction of hypocapnic hypopnea resulted in decreased Pph, decreased retropalatal expiratory CSA, and dampening of the eupneic within-breath CSA changes. (3) Induced hypocapnic hypopnea results in increased expiratory upper airway resistance. (4) End-expiratory lung volume decreased during induced hypocapnic hypopnea relative to eupnea.
Methodologic Considerations
Our laboratory has used and validated fiberoptic endoscopy in multiple studies (13, 20–23) to assess dynamic changes during spontaneous sleep (4, 21). Nevertheless, several considerations may influence the interpretation of the findings, including the inability to obtain multiple levels within the upper airway, movement of the fiberoptic scope, and the use of a constant reference landmark for calibration of the measurement. To mitigate these limitations, we determined and fixed the locations of the scope and the catheter to the nasal mask after locating the retropalatal space. Moreover, patients slept in the supine position with a fixed neck position. We chose the retropalatal airway for imaging because it represents the site of maximal narrowing in many patients with sleep apnea (13, 22). Finally, the specifics of our experimental paradigm, post-MV hypopnea in normal subjects, preclude inferences to patients with sleep apnea who develop hypopnea after spontaneous hyperpnea.
Effect of Reduced Ventilatory Motor Output on Upper Airway Mechanics
Mechanisms of upper airway compromise during hypocapnic hypopnea.
The occurrence of expiratory retropalatal airway narrowing during hypocapnic hypopnea without a significant increase in inspiratory resistance is consistent with some (12) but not all (8) studies. This discrepancy may be explained by methodologic differences because some studies measured RUA at the nadir inspiratory pressure, whereas we obtained resistance measurement on the linear segment of the pressure–flow relationship.
Our study corroborates the work of Morrell and colleagues who demonstrated, using a similar fiberoptic endoscopy imaging technique, that CSA increases abruptly upon termination of inspiratory effort and the transition from inspiration to expiration (23). Elevated BMI was the strongest independent determinant of expiratory widening in both studies. Our study extends the aforementioned observations by demonstrating a coupling between increased luminal Pph and increased CSA, raising the possibility of a causal relationship.
The major finding in our study was that hypocapnic hypopnea in sleeping humans compromised expiratory pharyngeal patency as evidenced by retropalatal pharyngeal narrowing, increased expiratory RUA, and the marked dampening of within-breath-changes in CSA during hypopnea. We considered several possible mechanisms of pharyngeal narrowing during hypocapnic hypopnea, including decreased upper airway dilating muscle activity, reduced lung volumes, and diminished intraluminal airway pressure. Decreased upper airway dilating muscle activity alone is an unlikely cause given the lack of inspiratory change during hypopnea. Decreased tonic muscle activity, such as with the tensor palatini, might increase retropalatal compliance and contribute to pharyngeal narrowing during early expiration (24). Changes in lung volume may also contribute to pharyngeal patency (25, 27). Increased lung volume or thoracic inspiratory activity enhances upper airway patency by decreasing pharyngeal compliance via caudal traction or pharyngeal dilatation via radial traction (26). The latter is due to transmitted subatmospheric thoracic pressure to the surrounding tissue and decreasing transmural pressure (27). Decreased end-expiratory supraglottic pressures during the first hypopneic breath support the role of decreased lung volume as an intermediate mechanism linking decreased ventilatory motor output to upper airway patency.
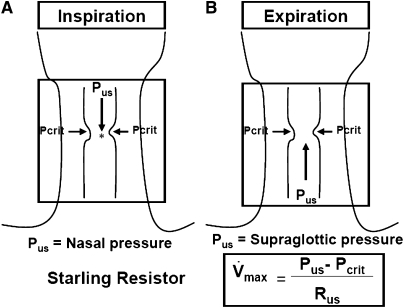
To ascertain the mechanisms of pharyngeal narrowing during hypocapnic hypopnea, it is useful to consider the hypotonic pharynx during hypopnea as a Starling Resistor with a collapsible segment governed by the principles of flow through collapsible tubes (Figure 7). Accordingly, if the upstream pressure is below Pcrit, the collapsible segment is closed, and no flow occurs. Flow commences when upstream pressure exceeds Pcrit and is determined by the gradient between the upstream segment and Pcrit. The critical closing pressure reflects the surrounding tissue pressure (extraluminal pressure), being negative in normal subjects and positive in patients with OSA.
Figure 7.
Schematic illustration for the collapsible segment of upper airway during hypocapnic hypopnea as a Starling Resistor. In this model, flow is determined by the gradient between the upstream segment and critical closing pressure (Pcrit). During inspiration (A), when upstream pressure (Pus) (i.e., nasal pressure) is below the Pcrit, the collapsible segment is closed, and no flow occurs. During expiration (B), when Pus in the supraglottic area is below the Pcrit, the collapsible segment is closed, and no flow occurs. During hypocapnic hypopnea, expiratory flow is limited, correlating with the gradient between the supraglottic pressure and Pcrit. Hence, this pressure gradient is important determinant of pharyngeal narrowing. Rus = upstream resistance; Vmax = maximal flow. Asterisk represents the site of retropalatal pressure measurement.
The aforementioned principles operate during both phases of respiration (14) because Pcrit and upstream pressure may change dynamically throughout the respiratory cycle (31). Upstream pressure is the mask pressure during inspiration and the supraglottic pressure during expiration. Thus, the effects of decreased ventilatory motor output on upper airway patency may differ by the phase of respiration. Decreased ventilatory motor output diminishes the magnitude of negative supraglottic airway pressure, hence increasing downstream pressure with no adverse effects on inspiratory upper airway patency. In contrast, supraglottic pressure is the upstream pressure during expiration and is a major determinant of expiratory flow. Consequently, expiratory pharyngeal obstruction would occur if the supraglottic pressure falls below Pcrit. This may explain the occurrence of pharyngeal occlusion during central apnea or periods of very low drive (13). Under conditions of low ventilatory drive, expiratory flow occurs if supraglottic pressure exceeds Pcrit. However, expiratory flow remains limited, correlating with the gradient between the supraglottic pressure and Pcrit. Therefore, we interpret the expiratory narrowing as a result of decreased supraglottic upstream driving pressure under hypotonic conditions.
Implications to the Pathogenesis of Obstructive Hypopnea
The occurrence of pharyngeal narrowing during induced central hypopnea has significant implications regarding the pathogenesis of upper airway obstruction during sleep. First, the occurrence of expiratory pharyngeal narrowing during induced hypocapnic hypopnea provides a mechanistic explanation of the adverse effects of reduced ventilatory drive on upper airway patency. Accordingly, reduced ventilatory motor output promotes upper airway narrowing by “pump” muscle activity and upper airway dilators. Conceptually, reduced upper airway muscle activity may increase pharyngeal compliance, whereas reduced “pump” muscle activity diminishes the magnitude of expiratory upstream pressure leading to expiratory narrowing, which has been found to be an important precursor of pharyngeal occlusion in patients with OSA (23). Second, the association between BMI and the magnitude of pharyngeal narrowing explains the lung-volume dependence of upper airway caliber in obese individuals (28, 29). Obesity exerts several deleterious effects on upper airway patency through anatomic narrowing, increased fat deposits, or reduced lung volume (29). Thus, in obese individuals, nonneuromuscular properties may play an important role in the upper airway patency during sleep, particularly when the neuromuscular activity is reduced. Decreased lung volumes may increase pharyngeal compliance, thereby increasing the pharyngeal airway susceptibility to the collapsing effects of extraluminal pressure generated by cervical soft tissue or adiposity. Finally, our findings suggest that central hypopnea is potentially an obstructive hypopnea in light of the pharyngeal narrowing and increased expiratory resistance. The morphologic distinction may be of little benefit in terms of pathogenesis, upper airway mechanics, or treatment.
In summary, we have shown the occurrence of expiratory pharyngeal narrowing during induced central hypopnea at a lower generated intraluminal pressure leading to decreased transmural pressure. The pharyngeal narrowing during expiratory phase correlated with BMI, indicating that the nonneuromuscular factors are important determinants of the upper airway patency during sleep.
Supplementary Material
Acknowledgments
The authors thank Alexandria D. Leonardi for the technical assistance.
Supported by the Department of Veterans Affairs and NHLBI.
This article has an online supplement, which is accessible from this issue's table of contents at www.atsjournals.org
Originally Published in Press as DOI: 10.1164/rccm.200805-741OC on November 21, 2008
Conflict of Interest Statement: None of the authors has a financial relationship with a commercial entity that has an interest in the subject of this manuscript.
References
- 1.Isono S, Remmers JE, Tanaka A, Sho Y, Sato J, Nishino T. Anatomy of pharynx in patients with obstructive sleep apnea and in normal subjects. J Appl Physiol 1997;82:1319–1326. [DOI] [PubMed] [Google Scholar]
- 2.Bradley TD, Brown IG, Grossman RF, Zamel N, Martinez D, Phillipson EA, Hoffstein V. Pharyngeal size in snorers, nonsnorers, and patients with obstructive sleep apnea. N Engl J Med 1986;315:1327–1331. [DOI] [PubMed] [Google Scholar]
- 3.Schwab RJ, Gupta KB, Gefter WB, Metzger LJ, Hoffman EA, Pack AI. Upper airway and soft tissue anatomy in normal subjects and patients with sleep-disordered breathing. Am J Respir Crit Care Med 1995;152:1673–1689. [DOI] [PubMed] [Google Scholar]
- 4.Rowley JA, Sanders CS, Zahn BK, Badr MS. Gender differences in upper airway compliance during NREM sleep: role of neck circumference. J Appl Physiol 2002;92:2535–2541. [DOI] [PubMed] [Google Scholar]
- 5.Henke KG, Arias A, Skatrud JB, Dempsey JA. Inhibition of inspiratory muscle activity during sleep: chemical and non-chemical influences. Am Rev Respir Dis 1988;138:8–15. [DOI] [PubMed] [Google Scholar]
- 6.Badr MS. Effect of ventilatory drive on upper airway patency in humans during sleep. Respir Physiol 1996;103:1–10. [DOI] [PubMed] [Google Scholar]
- 7.Onal E, Burrows DL, Hart RH, Lopata M. Induction of periodic breathing during sleep causes upper airway obstruction in humans. J Appl Physiol 1986;61:1438–1443. [DOI] [PubMed] [Google Scholar]
- 8.Hudgel DW, Gordon EA, Thanakitcharu S, Bruce EN. Instability of ventilatory control in patients with obstructive sleep apnea. Am J Respir Crit Care Med 1998;158:1142–1149. [DOI] [PubMed] [Google Scholar]
- 9.Badr MS, Skatrud JB, Simon PM, Dempsey JA. Effect of hypercapnia on total pulmonary resistance during wakefulness and during NREM sleep. Am Rev Respir Dis 1991;144:406–414. [DOI] [PubMed] [Google Scholar]
- 10.Badr MS, Skatrud JB, Dempsey JA. Effect of chemoreceptor stimulation and inhibition on total pulmonary resistance in humans during NREM sleep. J Appl Physiol 1994;76:1682–1692. [DOI] [PubMed] [Google Scholar]
- 11.Warner G, Skatrud JB, Dempsey JA. Effect of hypoxia-induced periodic breathing on upper airway obstruction during sleep. J Appl Physiol 1987;62:2201–2211. [DOI] [PubMed] [Google Scholar]
- 12.Badr MS, Kawak A, Skatrud JB, Morrell MJ, Zahn BR, Babcock MA. Effect of induced hypocapnic hypopnea on upper airway patency in humans during NREM sleep. Respir Physiol 1997;110:33–45. [DOI] [PubMed] [Google Scholar]
- 13.Badr MS, Toiber F, Skatrud JB, Dempsey JA. Pharyngeal narrowing/occlusion during central sleep apnea. J Appl Physiol 1995;78:1806–1815. [DOI] [PubMed] [Google Scholar]
- 14.Schneider H, Boudewyns A, Smith PL, O'Donnell CP, Canisius S, Stammnitz A, Allan L, Schwartz AR. Modulation of upper airway collapsibility during sleep: influence of respiratory phase and flow regimen. J Appl Physiol 2002;93:1365–1376. [DOI] [PubMed] [Google Scholar]
- 15.Sankri-Tarbichi A, Dal Cengio Leonardi A, Rowley J, Badr MS. Effect of induced central hypopnea on upper airway caliber and compliance during NREM sleep. Am J Respir Crit Care Med 2007;175:A333. [Google Scholar]
- 16.Sankri-Tarbichi A, Rowley J, Badr MS. Effect of neuromuscular activity on upper airway mechanics during sleep. Sleep 2007;30:A31. [Google Scholar]
- 17.Rechtschaffen A, Kales AA. A manual of standardized terminology, techniques and scoring system for sleep stages of human subjects. National Institutes of Health; Washington, DC: 1968
- 18.Sleep Disorders Atlas Task Force. EEG arousals: scoring rules and examples: a preliminary report from the Sleep Disorders Atlas Task Force of the American Sleep Disorders Association. Sleep 1992;15:173–184. [PubMed] [Google Scholar]
- 19.Zhou XS, Rowley JA, Demirovic F, Diamond MP, Badr MS. Effect of testosterone on the apneic threshold in women during NREM sleep. J Appl Physiol 2003;94:101–107. [DOI] [PubMed] [Google Scholar]
- 20.Rowley JA, Zahn BK, Babcock MA, Badr MS. The effect of rapid eye movement (REM) sleep on upper airway mechanics in normal human subjects. J Physiol 1998;510:963–976. [DOI] [PMC free article] [PubMed] [Google Scholar]
- 21.Morrell MJ, Badr MS. Effects of NREM sleep on dynamic within breath changes in upper airway patency in humans. J Appl Physiol 1998;84:190–199. [DOI] [PubMed] [Google Scholar]
- 22.Morrison DL, Launois SH, Isono S, Feroah TR, Whitelaw WA, Remmers JE. Pharyngeal narrowing and closing pressures in patients with obstructive sleep apnea. Am Rev Respir Dis 1993;148:606–611. [DOI] [PubMed] [Google Scholar]
- 23.Morrell MJ, Arabi Y, Zahn B, Badr MS. Progressive retropalatal narrowing preceding obstructive apnea. Am J Respir Crit Care Med 1998;158:1974–1981. [DOI] [PubMed] [Google Scholar]
- 24.Wheatley JR, Tangel DJ, Mezzanotte WS, White DP. Influence of sleep on response to negative airway pressure of tensor palatini muscle and retropalatal airway. J Appl Physiol 1993;75:2117–2124. [DOI] [PubMed] [Google Scholar]
- 25.Begle RL, Badr S, Skatrud JB, Dempsey JA. Effect of lung inflation on pulmonary resistance during NREM sleep. Am Rev Respir Dis 1990;141:854–860. [DOI] [PubMed] [Google Scholar]
- 26.Rowley JA, Williams BC, Smith PL, Schwartz AR. The effect of trachea displacement and hypercapnia on airflow dynamics in the upper airway. Am J Respir Crit Care Med 1995;151:A667. [Google Scholar]
- 27.Van de Graaff W. Thoracic influences on upper airway patency. J Appl Physiol 1988;65:2124–2131. [DOI] [PubMed] [Google Scholar]
- 28.Schwartz AR, Gold AR, Schubert N, Stryzak A, Wise RA, Permutt S, Smith PL. Effect of weight loss on upper airway collapsibility in obstructive sleep apnea. Am Rev Respir Dis 1991;144:494–498. [DOI] [PubMed] [Google Scholar]
- 29.Mortimore IL, Marshall I, Wraith PK, Sellar RJ, Douglas NJ. Neck and total body fat deposition in nonobese and obese patients with sleep apnea compared with that in control subjects. Am J Respir Crit Care Med 1998;157:280–283. [DOI] [PubMed] [Google Scholar]
- 30.Sanders MH, Moore SE. Inspiratory and expiratory partitioning of airway resistance during sleep in patients with sleep apnea. Am Rev Respir Dis 1983;127:554–558. [DOI] [PubMed] [Google Scholar]
- 31.Kirkness JP, Schwartz AR, Patil SP, Pichard LE, Marx JJ, Smith PL, Schneider H. Dynamic modulation of upper airway function during sleep: a novel single-breath method. J Appl Physiol 2006;101:1489–1494. [DOI] [PubMed] [Google Scholar]
Associated Data
This section collects any data citations, data availability statements, or supplementary materials included in this article.


