

Abstract
Automatic change detection reflects a cognitive memory-based comparison mechanism as well as a sensorial non-comparator mechanism based on differential states of refractoriness. The purpose of this study was to examine whether the comparator mechanism of the Mismatch negativity component (MMN) is differentially affected by the lexical status of the deviant.
Event-related potential (ERP) data was collected during an “oddball” paradigm designed to elicit the MMN from 15 healthy subjects that were involved in a counting task. Topography pattern analysis and source estimation were utilized to examine the deviance (deviants vs. standards), cognitive (deviants vs. control counterparts) and refractoriness (standards vs. control counterparts) effects elicited by standard-deviant pairs (“deh-day”; “day-deh”; “teh-tay”) embedded within “oddball” blocks.
Our results showed that when the change was salient regardless of lexical status (i.e., the /e:/ to /eI/ transition) the response tapped the comparator based-mechanism of the MMN which was located in the cuneus/posterior cingulate, reflected sensitivity to the novelty of the auditory object, appeared in the P2 latency range and mainly involved topography modulations. In contrast, when the novelty was low (i.e., the /eI/ to /e:/ transition) an acoustic change complex was elicited which involved strength modulations over the P1/N1 range and implicated the middle temporal gyrus. This result pattern also resembled the one displayed by the non-comparator mechanism. These findings suggest spatially and temporally distinct brain activities of comparator mechanisms of change detection in the context of speech.
Keywords: ERPs, Mismatch negativity (MMN), Electrical neuroimaging, Speech perception
1. Introduction
The deviance related activity reflected by the MMN is thought to be comprised of two mechanisms: (1) A sensory mechanism (Pantev et al., 1989) reflecting the differential state of refractoriness (Ritter et al., 1968; Näätänen, 1992; Näätänen and Picton, 1987) between neural activations associated with the deviant auditory input and the repetitive standard stimuli. (2) A pre-attentive memory-based comparison process reflecting the cognitive mechanism (Alho et al., 1993; Alho, 1995; Näätänen and Alho, 1997; Näätänen et al., 2005; Kujala et al., 2007).
The brain can detect changes in sound frequency on the basis of differential neural refractory states. According to this account the MMN arises because of selective adaptation of the N1 response by preceding standard stimuli (sensory component) leading to its attenuation which is interpreted in terms of neural refractoriness (Jääskeläinen et al., 2004). Thus, this account of MMN elicitation does not rely on memory representations, is more sensorial in nature and reflects a non-comparator mechanism of automatic change detection (Maess et al., 2007). On the other hand, for a wide range of stimuli, there is evidence that the MMN is elicited by a cognitive mechanism based on auditory sensory memory that compares the incoming deviant stimulus and the standard template (Näätänen and Alho., 1997, Näätänen et al., 2001). This account of the MMN is more cognitive in nature reflecting a comparator mechanism involving memory representations (Maess et al., 2007).
Adaptation of early N1 components occurs at approximately 100 milliseconds (ms) after auditory stimulation (Thompson and Spencer, 1966; Ritter et al., 1968; Hari et al., 1982), whereas the MMN which is assumed to be elicited by memory-based processes (Näätänen, 1982) occurs 100–200 ms after deviant stimulation. Thus, the N1 and MMN occur in close temporal succession within 100–200 ms from change onset and may even partly overlap in time.
The present study disentangles the relative contribution of cognitive and sensory mechanisms underlying deviance detection in the context of natural speech as was previously done in the context of tones (Opitz et al., 2005). In contrast to tones, speech sounds are spectrally rich and occupy a wide range of frequencies. In the literature there are competing views about the nature of speech. One view claims that speech is special and is being processed in specialized modules, while the contrasting view claims that speech sounds are processed by the same neural mechanisms shared by other sounds. For example, left lateralization in processing speech may be explained by the existence of rapidly changing spectral energy shared by speech and rapidly changing acoustic patterns which are not speech. On the other hand, it could be explained by a predisposition of one hemisphere to develop a module for phonemes (for a review on these two contrasting views see Shtyrov et al., 2005 and Zatorre and Gandour, 2008).
Recently, it was shown that left-lateralized effects were only observed when the target sound was presented within a word context, and not when it was placed within a pseudoword context (Shtyrov et al., 2005) and it was suggested that the MMN is sensitive to long-term memory traces or distributed memory networks for language (Shtyrov et al., 2005, 2007). These findings point to the interaction between afferent pathways that carry stimulus information with top-down processing mechanisms that modulate these processes (Zatorre and Gandour, 2008).
The purpose of this study was to examine the influence of the lexical status of the deviant stimulus on the cognitive (comparator) part of change detection controlling for refractoriness contributions to MMN, thus, allowing to test for memory-comparison based MMN mechanism (Opitz et al., 2005; Maess et al., 2007; Laufer et al., 2008) using ERP data collected during an “oddball” paradigm designed to elicit the Mismatch Negativity (MMN).
We used a variant of an experimental protocol controlling for refractoriness contributions to MMN, thus, allowing testing for memory-comparison based MMN mechanism. The paradigm has been firstly introduced by Schröger and Wolff (1996) and subsequently used in auditory (Schröger and Wolff, 1998; Jacobsen et al., 2003a,b; Jacobsen and Schröger, 2001, 2003; Opitz et al., 2005; Maess et al., 2007; Horváth et al., 2008; Laufer et al., 2008) and visual (Czigler et al., 2002; Pazo-Alvarez et al., 2004) MMN research.
The stimuli we used to elicit the MMN were based on those used in a previous study (Pettigrew et al., 2004). In the latter study it was found that a larger MMN response was elicited by contrasts with a nonword standard and word deviant (e.g., “deh”-“day”, “geh”-“gay”) than the reverse contrasts (i.e., word standard, nonword deviant, e.g., “day”-“deh”, “gay-“geh”) with the word/nonword distinction represented by a single acoustic change (the vowel). This MMN enhancement to the word deviants was termed the “word advantage” effect that has been suggested to reflect long term memory (LTM) for words that occur in addition to the acoustic change (Pulvermüller et al., 2001, 2004; Shtyrov et al., 2002, 2005). Other studies (Diesch et al., 1998; Jacobsen et al., 2004), however, suggested that lexical analysis is performed regardless of the occurrence of a concurrent acoustic change (i.e. also for the standard stimulus) and that lexical regularity is formed and used as a template against which lexical change can be detected (Muller-Gass et al., 2007).
To enhance the chances of eliciting the “word advantage” effect we used the same stimulus pair (i.e., “deh”-“day”) that elicited an MMN enhancement in the Pettigrew et al. (2004) study within a crossed design paradigm. Specifically, “oddball’ blocks could involve either a word deviant (“day”) presented among non-word standards (“deh”) or vice versa. In addition, a control condition was added to control for the acoustic change in the vowel. However, in contrast to the Pettigrew et al. (2004) study we used naturally produced stimuli.
Based on the findings related to the “word advantage” effect we have hypothesized that (1) the lexical status of the deviant will modulate the change detection process. Specifically, the word deviant “day” will activate LTM traces for words resulting in a more robust comparator mechanism than that activated by the nonword deviant; (2) The comparator mechanism will be located in the anterior rim of Heschl’s gyrus (HG) whereas, the sensory non-comparator mechanism reflected by refractoriness will be located in the superior temporal gyrus (STG) in the vicinity of HG (Jääskeläinen et al., 2004; Opitz et al., 2005; Ahveninen et al., 2006; Laufer et al., 2008; Lomber and Malhotra, 2008); (3) The contrast between deviants (low state of refractoriness) and standards (high state of refractoriness) will yield positive differential brain activations, whereas the contrast between standards (high state of refractoriness) and standard control counterparts (low state of refractoriness) will yield negative differential brain activations. The reasoning for the third hypothesis is as follows. The conventional deviance effect (contrasting deviants with standards) and the refractoriness effect (contrasting “oddball” standards with their control stimuli) both involve a comparison between stimuli that repeat many times (standards) and stimuli that are infrequent (deviants and control stimuli). Thus, a response decrement associated with the standards was expected due to the repetition effect leading to refractoriness (Hari et al., 1982; Budd et al., 1998; Yagcioglu and Ungan, 2008).
2. Methods
2.1 Subjects
Fifteen right-handed adult healthy subjects, native speakers of English, 7 women, participated in the study. Subjects ranged in age from 23–28. All subjects gave informed consent to participate in the study.
2.2 Experimental protocol
Three non-words, /de:/ “deh”; /te:/ “teh”; and /teI/ “tay”, and one word, /deI/ ”day”, were recorded from a male native English speaker in a sound-proof chamber. These stimuli comprised the following standard-deviant pairs that resulted in the three “oddball” runs: (1) deh (standard)-day (deviant); (2) day-deh and (3) teh-tay (for the spectral content of each of the stimuli see Laufer et al., 2008). Thus, “deh” and “day” swapped their roles as standard and deviant in the second “oddball” block, whereas the third “oddball” block controlled for the acoustic change associated with the transition from a monophthong (/e:/) to a diphthong (/eI/) occurring in the first standard-deviant pair.
The interval between two successive deviants varied quasi-randomly with gaps of 4, 6, 8, 10 or 12 standards with the constraint that gap size was balanced throughout the block. In the “Oddball” blocks deviants appeared 42 times out of a total of 354 stimuli (probability of occurrence = 12%).
In the “control” blocks an identical stimulus to the deviant (deviant-counterpart) was embedded within a mixture comprised of the following contextual or “filler” stimuli, /pe:/ “peh”; /peI/ “pay”; /be:/ “beh”; and /beI/ “bay”; the remaining standard of the original “oddball” standard-deviant pair (e.g., ”deh” when the block controlled for “day”) and the stimuli that comprised the remaining standard-deviant pair (in this case, “teh” and “tay”). The seven contextual stimuli were added to the control sequence so that the identical stimulus to the deviant from the “oddball” block will become a control stimulus by appearing at the same probability as any other stimulus in the sequence. There were three “control” runs, each corresponding to a deviant-counterpart, either “day”, “deh” or “tay”, respectively. In the control blocks, stimuli appeared quasi-randomly with the constraint that deviant-counterparts appeared with the same spacing rule as the deviants in the “oddball” blocks (i.e. the interval between two successive deviant-counterparts varied quasi-randomly with gaps of 4, 6, 8, 10 or 12 “filler” stimuli).
Each of the stimuli in the “control” block (a total of 8 different stimuli) repeated 42 times and appeared with equal probability which was identical to that of the deviants in the “oddball” block (12 %). There were 3 blocks of each type (“oddball” / “control”). Each block was repeated twice. In total, 12 blocks of approximately 6 min. each were randomly presented for each subject within a session.
The stimuli were truncated to 280 ms and normalized to the same loudness level by using Adobe Audition 1.5 trial version software package. Spectral analysis of the stimuli was conducted by Praat software version 4.3.19 (www.praat.org). Stimuli were presented with an SOA (stimulus onset asynchrony) of 1 sec at 62 dB SPL via headphones. Stimulus presentation was carried out by E-Prime 1.1 (1.1.4.1) (Psychology Software Tools, www.pstnet.com). The subjects were instructed to count every stimulus, press a button when they reached 100 and then reset their count and restart counting from zero again. This task was chosen to diminish a possible contamination by N2b and P3b ERP-components which are elicited when deviants are being discriminated from standards (Donchin et al., 1997; Opitz et al., 2005).
Three exemplars for each stimulus (e.g. deh1, deh2, deh3) were selected (out of a pool of 24 recordings per stimulus) on the basis of acoustic similarity (for the parameters that were used to choose similar exemplars for each stimulus, spectral values and behavioral results with these stimuli see Laufer et al., 2008). The three token types appeared randomly within each block and their occurrence was balanced throughout each block.
The reason for using three tokens for each consonant-vowel stimulus was to control as much as possible for acoustic factors, other than those inherent in the structure of the stimulus, which could confound the elicitation of a deviant response. Using three different exemplars for each consonant-vowel (CV) stimulus diminished the likelihood of a contingency developing between a specific deviant-standard pair because of an uncontrolled acoustic facet associated with either the deviant or the standard.
2.3 EEG Data Collection and Analysis
Scalp potentials were continuously recorded with Neuroscan 32-channel Cap (250 Hz digitization; mastoid (A1, A2) reference; band-pass filtered (0.10–100Hz)). Impedance was maintained below 5 KΩ. Epochs of EEG from 100 to 400 ms post-stimulus onset were averaged for each of the following stimuli from each subject to calculate the event-related potentials: deviants (“deh”,”day”,“tay”), corresponding standards (“day”,”deh”,”the”) and deviant-controls (the same physical stimulus as the deviants embedded within “control” runs). Averaged waveforms were low-pass filtered (14 Hz) and baseline corrected (−100 to 0 ms). Nuisance components of horizontal eye movements and blinks were removed offline in Matlab (The Mathworks, Natick, MA) using EEGLAB (http://sccn.ucsd.edu/eeglab/index.html) (Delorme and Makeig, 2004). Since the electrophysiological methods that comprise the step-wise analyses have been previously described (Michel et al., 2004; Murray et al., 2004; De Santis et al., 2007; Murray et al., 2006a,b; Murray et al., 2008) we provide here only a brief description of the multi-step analysis referred to as electrical neuroimaging (Murray et al., 2008).
2.4 ERP analyses
First, we analyzed amplitude modulations from all electrodes as a function of time after stimulus onset in a series of paired randomizations. Second, point-wise paired randomizations were computed to identify changes in the strength of the electric field at the scalp using global field power (GFP) (Lehmann and Skrandies, 1980) from each subject and experimental condition (“deviant”, “standard” and “control”).
Third, to statistically identify periods of change in the topography of the electric field at the scalp the Global Dissimilarity (Lehmann and Skrandies, 1980) was calculated between responses to different stimulus conditions for each time point per subject using a Monte Carlo Bootstrapping analysis procedure. This analysis is also known topographic analysis of variance (TANOVA, Strik et al., 1998). It is important to note that the observation of a GFP modulation could derive from changes in electric field strength and/or changes in electric field topography. However, observation of a GFP modulation without simultaneous topographic changes is indicative of amplitude modulation of statistically indistinguishable generators across experimental conditions (Murray et al., 2004).
2.5 Topographic pattern analysis
In the fourth step we used a spatial cluster analysis (Pascual-Marqui et al., 1995) to identify the most dominant scalp topographies appearing in the group-averaged ERPs of each stimulus condition (standard, deviant, and their corresponding counterparts) over time. These scalp configurations are sometimes referred to as “segmentation maps” taken to represent a given “functional microstate” of the brain or a given computational step during information processing (Lehmann, 1987; Michel et al., 1999, 2001). This segmentation procedure allowed us to identify time periods during which the different stimulus conditions differed in terms of evoked scalp potential maps.
Predominant topographies (i.e., template maps or ERP components) were identified using a modified version of agglomerative hierarchical clustering to achieve an optimum segmentation (i.e., the minimal number of maps that accounts for the greatest variance of the dataset) was determined by a modified Krzanowski-Lai criterion (Krzanowski and Lai, 1985). This segmentation procedure is independent of the reference electrode and is insensitive to amplitude modulation of the same scalp potential field across conditions, since topographies of normalized maps are compared (Lehmann, 1987).
In the fifth analysis step we confirmed the segmentation pattern obtained at the group level in the data of individual subjects. This means that for each time point of the individual subject’s ERP the scalp topography was compared to all segmentation maps and was labeled according to the one with which it best correlated spatially (Brandeis et al., 1995). Then, for each subject the mean GFP over the segment fitted by a given map for a given condition was computed. These values were then subjected to a repeated measures analysis of variance (ANOVA) using stimulus condition and template map as within-subject factors. This spatio-temporal analysis procedure revealed whether different generator configurations better account for particular stimulus conditions in particular time segments.
2.6 Source estimations
As the sixth and final analysis step we estimated the brain sources that significantly differentiated between stimulus conditions during those segments where significantly different scalp potential maps were found. For this end we used standardized low resolution brain electromagnetic tompography (sLORETA, Pascual-Marqui, 2002). This method computes statistical maps from EEG data that indicate the locations of the underlying source processes with low error. These maps are derived by performing a location-wise inverse weighting of the results of a Minimum Norm Least Squares (MNLS) (Hämäläinen et al., 1993) inverse solution with their estimated variances, and has a low localization error for single dipoles in noiseless simulated data (Pascual-Marqui, 2002, Wagner et al., 2004). However, its spatial resolution is limited in the presence of noise or when two dipoles are active simultaneously (Pascual-Marqui, 2002, Wagner et al., 2004). The sLORETA method produces estimates of the 3D current sources of the scalp surface EEG in 6,239 cortical gray matter pixels (spatial resolution: 5mm) according to the digitized Talairach and probability atlases of the Brain Imaging Center, Montreal Neurological Institute (MNI305). The head model for this inverse solution uses the electric potential lead field computed with the boundary element method applied to the MNI152 template (Fuchs et al., 2002). Electrode coordinates on the MNI152 scalp for the 10/5 system are based on a head-surface-based positioning system (Jurcak et al., 2007).
For a given time segment that was revealed as significant by TANOVA or by the GFP randomization procedure, an averaged sLORETA image was defined as the average of all instantaneous sLORETA images within the segment. Localization inference was based on a comparison between pairs of averaged sLORETA images. sLORETA provides statistical nonparametric mapping (SnPM) as part of its statistical package. In the current study, all EEGs were electrode/voxel wise normalized. We performed 5000 randomization SnPM, and computed reliable, corrected critical thresholds and p-values. Log of ratio of averages were used and considered with a 0.95 level of significance.
2.7 The contrasted stimulus conditions
The following three types of contrasts were examined by both paired randomizations and sLORETA SnPM as follows. (1) To compute the deviance effect each of the deviants (“day”, “deh”) was contrasted with the identical physical stimulus that served as the standard in the other block (i.e. deviant “day” vs. standard “day”; deviant “deh” vs. standard “deh”) (Pulvermüller et al., 2006; Kujala et al., 2007). (2) To compute the cognitive effect deviants from the “oddball” runs (“day”, “deh”, “tay”) were contrasted with their respective controls (deviant-counterparts). (3) To compute the refractoriness effect the standards embedded within the “oddball” runs (“deh” and “day”) were also contrasted with their corresponding (identical) deviant-counterpart (e.g. standard “deh” was contrasted with deviant-counterpart “deh” embedded within the control block). Thus, the deviant counterparts served as controls both for deviants (to compute the cognitive effect) and standards (to compute the refractoriness effect) (see Table 1 for an example of a “control” and “oddball” blocks in case of the “deh”-“day” contrast). Note that for deviant “tay” that served as a control condition (see below) only the cognitive effect was computed.
Table 1.
“Oddball” and “control” sequences for the “deh” (standard)-“day” (deviant) pair
| Oddball (deviant “day”) | deh1deh1 deh3 (D) deh2 day1(A) deh1 deh2 deh1 deh3 deh1 deh2 deh1 deh3 day3 … |
| Oddball (deviant “deh”) | day3 day1 day1 day2(B) day1 day3 day2 day1 deh1 day1 day3 day3 day2 deh2… |
| Control (“day” counterpart) | beh1 deh3 tay2 teh3 bay2 bay3 peh2 deh2 day2(C) peh3 bay1 teh3 pay1 day2…. |
| Control (“deh” counterpart) | bay1 teh3 pay1 peh3 deh2 bay2 bay3 peh2 beh1 tay2 pay3 teh3 bay2 deh1 (E)…. |
A-E indicate the stimuli contrasted to evaluate: the deviance effect (A vs. B), the cognitive effect (A vs. C) and the sensory effect (D vs. E). The numbers attached to the stimuli indicate different exemplars of the same CV stimulus. Note that in total three “oddball” blocks, for deviants “day”, “deh” and “tay”, and three control blocks for each of the deviants, respectively, were included in the experimental protocol. The blocks that are included in this table are meant to illustrate a specific subtraction procedure.
It is noteworthy that only one standard from the standards preceding each deviant was selected for averaging to balance as much as possible between the number of averaged standards (included in the first and third comparisons detailed above) and the number of averaged deviants and control stimuli, respectively. In addition, the exemplars representing a standard selected for averaging were counterbalanced as much as possible across the block.
The cognitive effect associated with deviant “tay”(contrasting deviant “tay” vs. control “tay”) was computed to control for the acoustic change associated with the transition from a monophthong (/e:/) to a diphthong (/eI/) occurring in the “deh-day” pair. Thus, we hypothesized that if the cognitive effect associated with the latter pair will engage similar differential brain sources to those elicited by the “deh-day” contrast the conclusion would be that the cognitive effect is mainly driven by the transition from /e:/ to /eI/ and not by the lexical status of “day”. We were not interested in the refractoriness effect associated with “tay” since this effect is not modulated by the lexical status of the stimulus (e.g., Laufer et al., 2008) and therefore would not be sensitive enough to determine whether a similar result pattern shared by “day” and “tay” is due to acoustic or lexical factors.
In this regard, it is noteworthy that we did not use the “teh”-“tay” pair (as a standard-deviant pair, respectively). The reasoning is as follows. First, it has already been previously validated that the addition (but not the omission) of an acoustic element causes the MMN enhancement (Nordby et al., 1994; Sabri and Campbell, 2000; Pettigrew et al., 2004), and the crucial point that needed clarification was what determines this enhancement: the lexical status or the acoustic change (from /e:/ to /eI/) This was the reason we used the “teh-tay” pair, to control for the acoustic change in the “deh-day” pair. Second, we were interested in comparing the extreme cases (i.e. /e:/ to /eI/ vs. /eI/ to /e:/) to effectively modulate the change detection response so that our first hypotheses regarding the effect of the comparator mechanism could be examined.
Furthermore, it could be argued that in order to have a more complete design regarding the effect of lexical status on the MMN we should have also contrasted word standards to word deviants (e.g. “bay-“day”). However, this was not the main purpose of this study. Specifically, we searched for known word-nonword contrasts that will yield a significant difference between the MMNs elicited to each of the two stimuli. The purpose was to examine the effect of the lexical status of the deviant on the comparator mechanism of the MMN. We finally chose a standard-deviant pair on the basis of the Pettigrew et al. (2004) study, which revealed that a significant and larger MMN response was obtained to real word deviants among nonword standards with the same initial consonant (e.g., “deh”-“day”) when compared with the responses to nonword deviants among word standards (e.g., “day”-“deh”). In contrast, responses to the fine acoustic speech contrast [d/g] (e.g., “day”-“gay”) did not reach significance (Pettigrew et al., 2004). Therefore, in view of the purpose of the study and of these previous results, there was no justification to add the “bay”-“day” contrast.
3.Results
3.1 ERP waveform analyses
Figure 1 displays the group-averaged ERPs and difference waves for the “deh”-“day”, “day”-“deh” and “teh”-“tay” standard-deviant pairs, respectively. Visual inspection of the grand-average ERPs and difference waves across the three standard-deviant pairs reveals that the MMN was a result of P2/N2 difference (deviant-minus-standard) waveforms in the ~250–350 ms latency range. A comparison of the “day”-“deh” with the “deh”-“day” panel (Fig. 1) reveals that the deviant waveform associated with the former pair is characterized by a negative shift over the latencies of the P1, N1and P2 components. In case of the “teh”-“tay” pair, the MMN was a result of the difference between the deviant N2 and the positive displacement immediately following the N2 peak (~350ms) of the standard wave.
Figure 1.

Group-averaged ERPs for the “deh”-“day” (left), “day”-“deh” (middle) and “teh”-“tay” (right) contrasts. Deviant, standard, and control ERPs are displayed over the left column of each panel. Deviant-minus-control and deviant-minus-standard difference waveforms are displayed over the right column of each panel. ERPs and difference waveforms are displayed at the Fz, FCz, Cz and Pz electrodes for each of the three contrasts. The acoustic change complex (P1-N1-P2) and N2 peaks are indicated on the control ERP waveform. The MMN is indicated on the difference deviant-minus-standard waveform. All peaks are indicated at the Fz electrode.
The close correspondence between the deviant and control waves at N2 latency, especially in the “deh”-“day” and “day”-”deh” standard deviant pairs, may suggest that the later peak of the MMN (~350 ms) is confounded by repetition effects, whereas the earlier peak of the MMN, which is a result of a difference waveform at P2 latency, may represent a “genuine” MMN.
Figure 2 displays the electrophysiological results organized in separate panels according to the contrasted stimulus conditions and the resultant effect type (deviance, cognitive, refractoriness). Each panel is divided into separate rectangles displaying (from top to bottom) group-averaged ERP waveforms; the difference wave resulting from subtracting one condition from the other; an intensity plot of paired randomizations displaying segments of ERP amplitude modulations; epochs of significant GFP modulations (P<0.05) (indicted by the yellow bands); and an intensity plot displaying segments of topography modulations. ERP waveforms and all pair-wise comparisons are displayed for the entire 400 ms analysis window.
Figure 2.

Electrophysiological results of the stepwise analysis for “day” (left panels), “deh” (middle panels) and “tay” (right panel). Each of these stimuli was contrasted with the corresponding standard or control stimulus to yield one of the following effects: deviance, cognitive or refractoriness. The refractoriness effect with standard “day” and the cognitive effect with deviant “deh” did not reach significance level (P < 0.05) with either TANOVA or GFP paired-comparisons and were therefore not included in the figure. In case of the control condition (deviant “tay”) only the cognitive effect was computed. The rectangle-shaped plots (from top to bottom, respectively) in each of the panels display the averaged ERPs for the FCz channel; the resultant difference wave; pointwise paired comparisons of ERP amplitude, global electric field power (GFP) and scalp topography (TANOVA) modulations. The acoustic change complex (P1-N1-P2) and N2 peaks are indicated on the deviant ERP waveform (except for “deh”, “Refractoriness” where the control waveform is used). The MMN is indicated on the deviant-minus-standard difference waveform. Note that in case of amplitude and topography modulations the x-, y-, and z-axes, illustrate, respectively, time, electrode, and p value. In case of GFP modulations, significant differences between conditions were indicated by the yellow bands (P<0.05). Note that across panels the green and red curves denote different stimuli, however, in each panel the green curve was always subtracted from the red curve. The control stimuli are the same physical stimuli as the deviants or the standards. Ref. = Refractoriness; Ind. = Individual.
The results in this section pertain to the paired randomizations reflecting ERP modulations (third rectangle from the top in each of the panels in Fig. 2). It can be seen that the negative difference wave reflecting the deviance (Fig 2, “day” and “deh”, “Deviance”) and cognitive (Fig. 2, “day”, “Cognitive”) effects included an early deviance-related negativity (DRN) that appeared to consist of two negativities, the N1 (~ 100–200 ms) and the MMN observed over the P2/N2 latency range (~ 250–350 ms).
In the case of the deviance and cognitive effects associated with deviant “day” (Fig. 2, “day”, “Deviance” and “Cognitive”) significant ERP differences between conditions were widespread throughout the 400 ms analysis window. In contrast, in the deviance effect with “deh” (Fig. 2, “deh”, “Deviance”) ERP differences were limited to two main time intervals over the ~100–150 and ~300–400 ms intervals. For the refractoriness effect when “deh” served as the standard (Fig. 2, “deh”, “Refractoriness”) significant ERP differences were widespread over the electrode montage over the ~ 50–100 ms interval and were limited mainly to parietal electrodes over the ~ 300–350 ms interval. In examining the cognitive effect with “tay” (Fig. 2, “tay”, “Cognitive”), widespread significant ERP differences were limited to the P2(~250–350) ms time range.
3.2 GFP and global dissimilarity (TANOVA) analyses
Analyses of both GFP and global dissimilarity (the bottom two rectangles, respectively, in each of the panels in Fig. 2) provide information on whether differences between conditions stem from topographic and/or strength modulations. When “day” and “tay” served as deviants, differences reflecting the deviance (Fig. 2, “day”) and cognitive effects (Fig 2, “day” and “tay”, “Cognitive”) were mainly derived from topography modulations. In contrast, when “deh” served as the deviant the differences between the deviant and standards (Fig. 2, “deh”, “Deviance) as well as the differences reflecting the refractoriness effect (Fig. 2, “deh”, “Refractoriness”) were derived from strength modulations. Note that in case of the cognitive effect associated with “tay” there was a short period (264–300 ms) of simultaneous topographic and strength modulations.
The timing of significant GFP or of significant changes in the topography of the electric field at the scalp as measured by TANOVA was both comparison- and stimulus-dependent. In case of the deviance effect, when “day” served as the deviant (Fig. 2, “day”, “Deviance”) changes in topography were observed over both the N1 (~150–200 ms) and P2 (~250–350 ms) intervals. However, the period of topography changes that was associated with maximal significant differences coincided only with part of the P2 time range (~250–316 ms). GFP modulations were also evident as from ~325 ms. Note that the GFP modulations appear almost immediately after the termination of the significant change in the electric field topography (Fig. 2, “day”, “Deviance”) in a time interval coinciding with N2. When “deh” served as the deviant (Fig 1.,“deh”, “Deviance”) GFP modulations were observed over the P1/N1 time interval (~100–200 ms).
In case of the cognitive effect, when “day” served as the deviant (Fig. 2, “day” “Cognitive”) changes in topography were mainly found over the P2 time range (248–280 ms) and when “tay” served as the deviant (Fig. 2, “tay”, “Cognitive”) topography modulations were more prolonged over the P2 latency interval (228–328 ms). However, there were no significant changes in the strength and/or topography of the electric field at the scalp associated with the cognitive effect when “deh” served as the deviant.
In case of the refractoriness effect when “deh” served as the standard (Fig. 2, “deh”, “Refractoriness”) GFP modulations were observed over P1 (72–120ms), N1 (144–168 ms) and P2 (216–292 ms) time intervals. When standard “day” was contrasted with control “day” there were no significant strength and/or topography modulations associated with the refractoriness effect.
3.3 Topographic pattern analysis
To investigate whether different functional microstates (template maps, Murray et al., 2004) occur in each condition or whether the same microstates appear but with shifted latencies we performed topographic pattern analysis on the time segments revealed by TANOVA. We have limited the scope of our analyses only to ERP differences occurring within the time segments comprising the DRN, namely, the 100–350 ms interval.
3.3.1 Comparisons with “day”
3.3.1.1 The deviance effect- the comparison between deviant “day” and standard “day”
Eight template maps were observed in the group averaged data over the 164–316 ms interval designating topography modulations as revealed by TANOVA (Fig. 3A). A significant interaction between condition and map over the 168–312 ms period was found after submitting these maps observed at the group-average level to the fitting procedure at the individual subject level (F(7,98)=4.644; P < 0.01). That is, there were maps that were differentially observed between the compared conditions. Follow-up planned comparisons (paired t-tests) indicated that the mean GFP over the segment fitted by the map framed in red (168–192 ms) (Fig. 3A) was larger (tc=3.323, P < 0.01) in the deviant “day” condition than in the standard “day” condition while the mean GFP over the segment fitted by the map framed in green (296–312 ms) (Fig. 3A) was larger (tc=−4.084, P < 0.01) in the standard “day” condition. sLORETA SnPM computations revealed that only the segment fitted by the latter map yielded significant topographic differences between conditions. Specifically, topography modulations found in the 293–312 ms period were explained by a source located in the left middle frontal gyrus (MNI coordinates x, y, z = −50, 30, 25) in which activation was stronger (P<0.05, one-tailed) in response to deviant “day” than to standard “day” (Fig. 3B).
Figure 3.
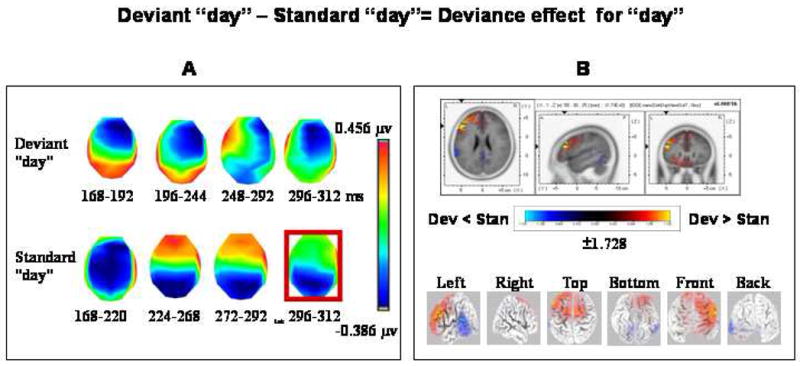
Topographic pattern analysis (A) and source estimation (B) for the deviance effect with “day” (deviant “day” vs. standard “day”). (A) The topographic pattern analysis identified eight stable topographies, four from each condition, over the 168–312 ms period of topography modulations. Note that each topographic map from one condition overlapped in time with the map of the other condition. The fitting procedure and subsequent analyses identified one discriminative map (framed in red) over the 296–312 ms interval.
(B) sLORETA SnPM three-slice image for the contrast between deviant “day” and standard “day” reflecting the deviance effect. The SnPM was computed over the time period in which a discriminative map was found (296–312 ms). The sLORETA three-slice image displays log of F-ratios with corrected thresholds shown in three orthogonal brain slices (horizontal, sagittal and coronal). The local maximum is indicated by the arrow heads and its corresponding value is indicated adjacent to the color scale. The maximal difference was found in the vicinity of the middle frontal gyrus (BA 46, MNI coordinates x, y, z = −50, 30, 25). Three-dimensional cortex views (left, right, top, bottom, front, back) are also displayed below the three-slice image. Dev = Deviant; Stan = Standard.
Significant GFP modulations were also evident as from ~325 ms (Fig. 2,”day”, “Deviance”), however, we decided not to include this significant segment of GFP modulations in sLORETA SnPM analysis since topography modulations dominated the analysis window and were therefore probably more inherent to the deviance effect with “day”. Furthermore, GFP modulations commenced immediately after topography modulations have terminated and extended beyond the predefined analysis window which is beyond the scope of the current paper.
3.3.1.2 The cognitive mechanism- the comparison between deviant “day” and control “day”
Two template maps were differentially observed in the group-averaged data between the compared conditions over the 248–280 ms period designating topography modulations as revealed by TANOVA (Fig 4A). Each of these template maps extended over the entire period of topography modulation (i.e., 248–280 ms). A significant interaction between condition and map (F(1,14)= 18.110; P < 0.01) over the 248–280 ms interval was found after submitting these maps to the fitting procedure. Follow-up planned comparisons (paired t-tests) indicated that the template map (framed in red, Fig. 4A) significantly dominated the deviant “day” condition (tc= 3.742, P < 0.01), whereas the template map framed in black significantly dominated the control “day” condition (tc=−3.535, P < 0.01) (Fig. 4A). Source estimations calculated by sLORETA over the 248–280 ms interval revealed weaker activations (P<0.05, two-tailed) to deviant “day” than to control “day” peaking within the right cuneus (MNI coordinates x, y, z = 10, −80, 10) and spreading into the posterior cingulate gyrus (Fig. 4B).
Figure 4.
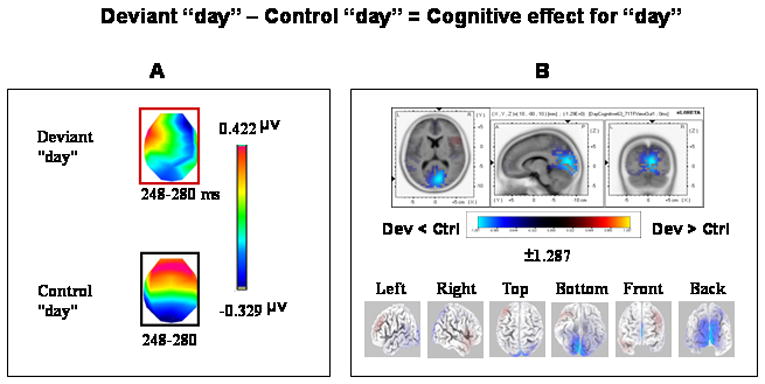
Topographic pattern analysis (A) and source estimation (B) for the cognitive effect with “day” (deviant “day” vs. control“day”). (A) The topographic pattern analysis identified two stable topographies, one from each condition, over the 248–280 ms period of topography modulations. Note that the topographic map of one condition overlapped in time with the map of the other condition. The fitting procedure and subsequent analyses revealed that each of the topographic maps from each of the conditions (framed in red and black, respectively) significantly differentiated between deviant “tay” and control “tay” conditions. (B) sLORETA SnPM image for the contrast between deviant “day” and control “day” reflecting the cognitive effect. The SnPM was computed over the time period in which the discriminative maps between the compared conditions were found (248–280 ms). Other details as in Fig. 2(B). The maximal difference was found in the vicinity of the cuneus/posterior cingulate (BA 17, MNI coordinates x, y, z = 10, −80, 10). Dev = Deviant; Ctrl = Control.
The paired randomizations that were run on the GFP data as well as the TANOVA computations did not reveal any statistical significant differences (P >0.05) between conditions associated with the refractoriness effect (standard “day” vs. control “day”). Therefore, we did not apply either pattern analysis or the sLORETA computations for this effect.
3.3.2 Comparisons with “deh”
3.3.2.1 The deviance effect- the comparison between deviant “deh” and standard “deh”
The paired-randomization test conducted on the GFP values revealed one phase of GFP modulations that covered the 80–204 ms period (Fig. 2, “deh”, “Deviance”). This GFP modulation phase was explained by a source located in the right middle temporal gyrus (MNI coordinates x, y, z = 65, −40, 0) that was stronger (P<0.05, one-tailed) in response to deviant “deh” than to standard “deh” (Fig. 5).
Figure 5.
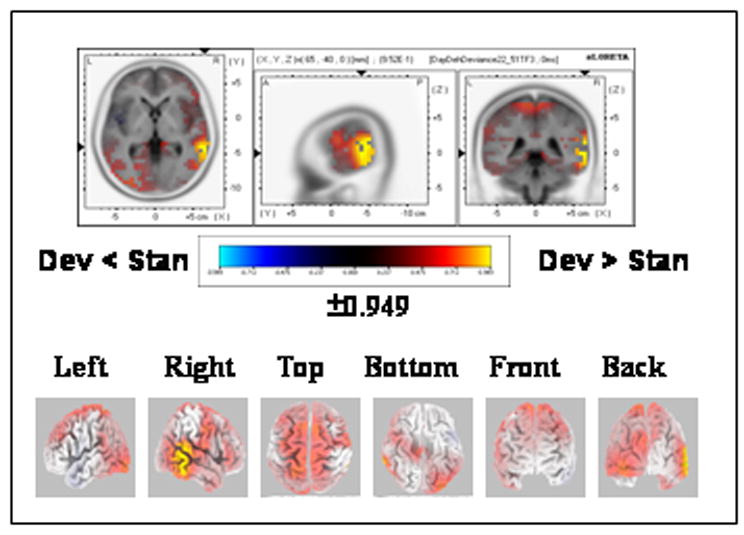
sLORETA SnPM image for the contrast between deviant “deh” and standard “deh” reflecting the deviance effect. The SnPM was computed over the time period of strength modulations (80–204 ms, see Fig. 1). The maximal difference was found in the vicinity of the middle temporal gyrus (BA 21, MNI coordinates x, y, z = 65, −40, 0). Dev = Deviant; Stan = Standard. Other details as in Fig. 3(B).
The paired randomizations that were run on the GFP data as well as the TANOVA computations did not reveal any statistical significant differences (P >0.05) between conditions associated with the cognitive effect. Therefore, we did not apply either pattern analysis or the sLORETA computations for this effect.
3.3.2.2 The sensory mechanism- the comparison between standard “deh” and control “deh”
The paired-randomization test conducted on the GFP values revealed three phases of GFP modulations over the 72–120, 144–168 and 216–292 ms periods (Fig. 2, “deh”, “Refractoriness”). Note that there was a short period of simultaneous topography and strength modulations over the 224–244 ms period (Fig. 2, “deh”, “Refractoriness”). The sLORETA computations determined that the earliest phase (72–120 ms) but not the subsequent phases of GFP modulations resulted in a significant differential source between standard “deh” and control “deh” conditions. Figure 6 shows that the GFP change in the 72–120 ms period was explained by a source located in the right STG (MNI coordinates x, y, z = 45, −35, 15) that was stronger (P<0.01, one-tailed) in the control “deh” condition.
Figure 6.

sLORETA SnPM image for the contrast between standard “deh” and control “deh” reflecting the refractoriness effect. The SnPM was computed over the time period of strength modulations (80–120 ms, see Fig. 1). The maximal difference was found in the vicinity of the superior temporal gyrus (BA 41, MNI coordinates x, y, z = 45, −35, 15). Stan = Standard; Ctrl = Control. Other details as in Fig. 3(B).
3.3.3 The control condition
3.3.3.1 The cognitive effect- the comparison between deviant “tay” and control “tay”
To control for the acoustic transition from (/e:/) to (/eI/) in the “deh-day” pair we examined the cognitive effect associated with a corresponding “teh-tay” standard-deviant pair. TANOVA computations revealed two phases of topography modulations. The first phase covered the 92–128 ms period and the subsequent phase covered the 228–328 ms period (Fig. 2, “tay”, “Cognitive”). However, since the first phase covered a relatively short period of modulations only the subsequent phase was further subjected to the segmentation procedure.
Topographic pattern analysis revealed four template-maps in the group-averaged data over the second phase of topography modulations (228–328 ms) (Fig. 7A). Following the fitting procedure a significant map X condition interaction was revealed (F(3,42)=4.213; P < 0.05). Follow-up planned comparisons (paired t-tests) indicated that two template maps (framed in red, Fig. 7A) that fitted consecutive time segments significantly differentiated between the compared conditions. One map covered the 228–248 ms period of topography modulations (tc= −3.349, P < 0.01) and the other covered the consecutive 252–304 ms period of topography modulations (tc= −3.592, P < 0.01). That is, the two maps framed in red (Fig. 7A) were significantly more often observed in response to the control “tay” condition. Source estimations calculated by sLORETA over the 228–304 ms interval (fitted by the two maps together) revealed weaker activations (P<0.01, two-tailed) to deviant “tay” than to control “tay” within the right posterior cingulate gyrus (MNI coordinates x, y, z = 5, −45, 20) (Fig. 7B).
Figure 7.
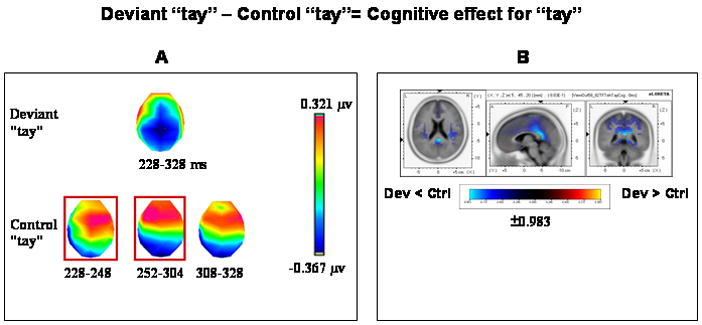
Topographic pattern analysis (A) and source estimation (B) for the cognitive effect with “tay”. (A) The topographic analysis shown here was applied on the second period of topography modulations (228–328 ms, see Fig. 1). Four stable topographies were identified, one from the deviant “tay” condition and three from the control “tay” condition. The topographic map from the deviant “tay” condition covered the entire 228–328 ms period of topography modulation and overlapped with the three consecutive time periods of stable topographies (228–248, 252–304 and 308–328 ms) identified from the control “tay” condition. The two maps framed in red are discriminative maps that significantly differentiated between the two compared conditions in the 228–304 ms period of topography modulations. (B) sLORETA SnPM image for the contrast between deviant “tay” and control “tay” reflecting the cognitive effect. The SnPM was computed over the time period in which the two consecutive discriminative maps were found (228–304 ms). The maximal difference was found in the vicinity of the posterior cingulate (BA 30, MNI coordinates x, y, z = 5, −45, 20). Dev = Deviant; Ctrl = Control. Other details as in Fig. 3(B).
4. Discussion
4.1 Summary of main findings
In this study we aimed to examine the effect of the lexical status of the deviant on the cognitive and sensory mechanisms (Opitz et al., 2005) underlying deviance detection in the context of natural speech. We used spatio-temporal analysis based on micro-state analysis (Pascual Marqui et al., 1995; Wackermann et al., 1993; Michel et al., 1999; Michel et al., 2001) that enabled us to study the time course of the sensory and cognitive components and define the exact time periods of topography or amplitude changes associated with the non-comparator and comparator mechanisms of change detection. Previous studies either lacked adequate temporal resolution (e.g. Opitz et al., 2005) or used tones to study these two components of change-detection (e.g. Maess et al., 2007).
The electrical neuroimaging results agree with previous findings suggesting the existence of two separate mechanisms of change detection (Maess et al., 2007). Salient deviance elicited the memory-based mechanism (changes in topography) over the ~250–280 ms interval (Fig. 2, “day”, “Cognitive”) and refractoriness activated the non-comparator sensory mechanism (amplitude modulation without changes in topography) that appeared earlier and comprised the ~80–200 and ~220–290 ms intervals (Fig. 2, “deh”, “Refractoriness”). However, in contrast to previous findings (Maess et al., 2007) our results show that distinct brain sources of activation are associated with the comparator and non-comparator mechanisms as indicated below.
Taken together, our results partially confirmed the first hypothesis. Specifically, the comparator (cognitive) mechanism over the MMN time range was only significant with deviant “day” but not with deviant “deh”. Moreover, the MMN in response to “day” was accompanied by significant topography modulations, while the MMN epoch in response to “deh” was not concurrent with either type of significant modulations (Fig. 2, “day” and “deh”, “Deviance”). In contrast to the deviance response with “deh”, the cognitive effect with both “day” and “tay” (Fig. 2, “day” and “tay”, “Cognitive”) implicated topography modulations over the MMN time range coinciding with the P2/N2 latency range. This result disagrees with our hypothesis since the response pattern observed for deviant “day” was not entirely driven by its lexical status or the “word advantage” effect, but was most likely also affected by the suffix diphthong /eI/ shared by both “day” and “tay”.
Contrary to our second hypothesis, the comparator mechanism of the MMN was not located in the anterior rim HG but in the cuneus/posterior cingulate gyrus. This region was associated with the comparator (cognitive) mechanism of the MMN activated by the more salient deviants that involved the acoustic transition from /e:/ to /eI/ (Fig. 2, “day” and “tay”, “Cognitive”). The posterior cingulate cortex was previously found to be activated in a dichotic target detection task in which a target was simultaneously presented with a distractor on the contralateral ear (Pollmann et al., 2004) suggesting that this region may be activated in the context of tasks where part of the information is irrelevant. The cuneus was also found to be activated during a sound identification task when the location of the stimuli was irrelevant to the task (Alain et al., 2001a). Alternatively, the similarity in processing “day” and “tay” may reflect an extra processing effort associated with the diphthong vowel /eI/ shared by both of these stimuli (Sonty et al., 2003; Bohland et al., 2006).
In accordance with our second hypothesis, the sensory mechanism reflected by refractoriness was located in the vicinity of the primary auditory cortex (Fig. 6) (Opitz et al., 2005; Jääskeläinen et al., 2004; Altmann et al., 2008; Maess et al., 2007) in the earliest time interval of significant GFP modulations (~100–200 ms) (Fig. 2, “deh”, “Refractoriness”). The differential right-lateralized response is in agreement with a recent multiple dipole source modeling study that revealed the right lateral HG and the bilateral STG as sites of adaptation (Altmann et al., 2008). As can be observed in Fig. 2 (“deh”, “Refractoriness”) the significant GFP period over the 216–292 ms interval overlapped with the P2 component. Adaptation effects for the P2m component were recently found within bilateral superior temporal gyrus (Altmann et al., 2008). In our study, the earlier GFP modulation phase (80–204 ms, Fig. 2,”deh”, “Deviance”) was associated with a source located in the right middle temporal gyrus (Fig. 5). However, in the context of our study this GFP modulation phase is probably related to acoustic change and not to refractoriness (see explanation below in sub-section 4.3).
Our third hypothesis was also confirmed, namely, the contrast between deviants (low state of refractoriness) and standards (high state of refractoriness) yielded positive differential brain activations (Fig. 3B, Fig. 5) whereas the contrast between standards (high state of refractoriness) and standard control counterparts (low state of refractoriness) yielded negative differential brain activations (Fig. 6). Adaptation is observed as a decrement in the amplitude of the neural response by stimulus repetition (Hari et al., 1982). Neurophysiological evidence of adaptation to auditory stimulation has also been reported in brain responses (Ritter et al., 1968 Ritter et al., 1992; Hocherman and Gilat, 1981; Ulanovsky et al., 2003; Nakamoto et al., 2006).
4.2 Drawbacks of the current paradigm
The paradigm used in the current study is a variant of an experimental protocol firstly introduced by Schröger and Wolff (1996) that was meant to disentangle non-comparator-based and comparator-based contributions to MMN. However, it is important to note the drawbacks associated with the paradigm as implemented in the current study. The original paradigm had been developed to be utilized with stimuli which can be modulated on a single dimension such as spatial location (Schröger and Wolff, 1996; Schröger, 1997), sound intensity (Jacobsen et al., 2003a), frequency (Schröger and Wolff, 1998; Jacobsen and Schröger, 2001; Jacobsen et al., 2003b; Horváth et al., 2008), duration (Jacobsen and Schröger, 2003), color (Czigler et al., 2002) and motion-direction (Pazo-Alvarez et al., 2004).
In the original paradigm the brain response to a stimulus change occurring in oddball blocks was compared with the brain response to the same stimulus presented in control blocks with respect to the dimension in which standards and deviants differ. However, due to the, on average, larger acoustic separation between the control and the “filler” (‘non-control’) sounds compared to the separation between the deviant and the standard (e.g. Jacobsen and Schröger, 2001; Maess et al., 2007; Horváth et al., 2008) stimulus-specific refractoriness could be higher for the deviant than for the corresponding control sound (e.g. Jacobsen and Schröger, 2001). This would compensate (or even overcompensate) for refractoriness effects.
The “filler” stimuli used in the current study, however, were variable speech stimuli that differed on more than one dimension from each other (see also Zatorre and Gandour, 2008) which makes it a weaker control condition than in studies utilizing a single dimension of deviance (e.g., Schröger and Wolff, 1996; Jacobsen and Schröger, 2001; Horváth et al., 2008). In addition, this problem of the multi-dimensionality of the control stimuli in the present study makes it more difficult to estimate the specific effects of refractoriness on the MMN. Specifically, in the present study it is not possible to isolate a single dimension of deviation and estimate the effects of refractoriness on the MMN (e.g. Horváth et al., 2008)
Nevertheless, despite the multi-dimensionality of the “filler” stimuli, we believe that the control condition used in our study adequately controlled for refractoriness effects. The reasoning is as follows. First, in the previous fMRI study (Laufer et al., 2008) using the same stimuli and the same paradigm as in the current study a similar pattern of refractoriness effect was found across speech stimuli of different lexical status and acoustic structures (see also Ahveninen et al., 2006).
Second, the timing (e.g., Ahveninen et al., 2006; Maess et al., 2007) as well as the anatomical regions (e.g., Opitz et al., 2005; Ahveninen et al., 2006; Altmann et al., 2008; Maess et al., 2007) specified in these studies correspond with those found in our study (i.e. Fig. 2, “Deh”, “Refractoriness” and Fig. 6). Third, observing Fig. 1 it is evident that the N1 and MMN are separated in time, thus N1-effect confounds do not pose a problem in estimating the MMN. Fourth, the deviant and the control stimuli had comparable N1 responses and in the case of the “deh-“day” pair the control condition even overcompensated for the N1 refractoriness effect.
4.3 The spectral composition of the stimuli determined the processing route
By comparing the “deh”-“day” vs. the “day”-“deh” pair (Fig. 1 and Fig. 2) it could be observed that the deviant waveform in case of the latter was subjected to a negative shift in the P1, N1 and P2 time intervals, while in case of the “deh”-“day” pair the deviant waveform was more positively displaced in relation to the control waveform. These differences in processing the word and non-word deviants had already begun around 70 ms after stimulus onset.
Observing the spectral content of the stimuli “deh” and “day (Laufer et al., 2008, Table 1) it is evident that at the onset of the /e/ segment of the stimuli the frequency separation between the F1 and F2 formants of the “day” tokens was larger than that for the “deh” tokens. Thus, the difference in F1/ F2 ratio could serve as a cue for the identity of the deviant stimulus that already appeared at stimulus onset. Previous findings provide supporting evidence for this assumption. Jacobsen et al. (2004) have shown that the speech perception system operates pre-attentively on the basis of the critical F1/F2 formant information when building up vowel representations.
4.3.1 A possible effect of Object-Related-Negativity (ORN)
It is noteworthy that only the transition from /eI/ to /e:/ resulted in a negative shift in the P1-N1-P2 latency range. It might be the case that an “object-related negativity” (ORN) (Alain et al.,2001b, 2002) modulated the response to the nonword deviant. Alain et al. (2002, 2005) suggested that the ORN component indexes an automatic mismatch process between the harmonic template extracted from the incoming stimulus and the harmonic frequency expected based upon the fundamental of the complex sound. Although the design of the present study does not involve the perception of concurrent auditory objects, segregation might have occurred between the standard stream (“day”s) and the deviant (“deh”) because of a lower frequency separation between F1 and F2 in the latter. This might have resulted in both an ORN and an N2b (Alain et al., 2005). Previously, it was found that the ORN was maximal at frontocentral sites and enhanced negativity between 130–170 ms superimposed on the N1 and P2 waves. The N2b followed the ORN and was more posterior and maximal at about 250 ms poststimulus onset (Alain et al., 2005).
It was also previously suggested that the N2b may index a schema-driven process in vowel identification in which the output from the frequency analysis is matched against stored vowel representations (Alain and Tremblay, 2007). Although, the known distribution of the ORN and N2b matches that associated with the response to deviant “deh”, the ORN in the current study appears earlier than expected, i.e. before N1 latency (~50–70 ms) (Fig. 2, “deh”, “Deviance”).
It is possible that the difference in the type of stimuli used in the current and previous studies (Alain et al.,2001b, 2002), that is, speech stimuli versus complex non-speech sounds, respectively, affected the earlier ORN observed here. However, the fact that the negative shift in our study appeared in the P1 latency range, earlier than that expected for the ORN to occur, and the fact that in our study there was no involvement of concurrent object perception deems the ORN as an unlikely cause of the negative shift in response to “deh”. It is also unlikely that the N2b confounded the MMN since the main task of the subject in the current study was to count the incoming stimuli. This task was chosen to control for a possible contamination by N2b and P3b ERP-components which are elicited when deviants are being discriminated from standards (Donchin et al., 1997; Opitz et al., 2005).
4.3.2 Possible effects of the C (change)-potentials
Effects of spectral differences in speech were recently found for the P1 peak in the context of consonant-vowel transitions (Èeponienë et al., 2008). Thus, overall our results show that P1 was sensitive to the spectral content of the CV stimuli, probably to the spectral content of the formant transitions at the beginning of the /e/ segment. An alternative explanation for the early negative shift in response to “day” might be the occurrence of the C (change)-process comprised of the C-potentials. The vertex-maximal ‘C-potentials’ (CP1, CN1, CP2), also termed the ‘acoustic change complex’ (Martin and Boothroyd, 1999) were found to be associated with both sequential and spectral streaming (Jones et al., 1998; Jones, 2003; Jones and Perez, 2001, 2002). The C-potentials were shown to reflect a mismatch between the incoming acoustic change and the preceding stream (Jones et al., 2000) and thus better explain the negative shift in our study than the ORN.
A point that should be addressed, however, is why the transition from “deh” to “day” does not result in the same early negative shift pattern as the transition from “day” to deh”? Part of the answer is that the morphology of the C-potentials varies according to the structure of the speech stimulus (Tremblay et al., 2003, 2006) and that diverse types of acoustic change have different effects on the C-potentials (Jones and Perez, 2002). Thus, it should be taken into consideration that the response to the naturally produced deviants in our study is comprised of multiple overlapping ERPs. The first P1-N1-P2 complex reflects the onset of /d/. A second P1-N1-P2 complex reflects the response to the /eI/ (or /e:/) segment embedded within the deviant stimulus (see also Ostroff et al., 1998). A third P1-N1-P2 overlapping change complex reflects the acoustic transition from /e:/ embedded within the standard to /eI/ embedded within the deviant or from /eI/ to /e:/ after reversing the roles between the standard and the deviant. A fourth overlapping ERP component is the MMN elicited in response to the deviants.
Therefore, it was important to use an experimental protocol allowing adequate acoustic control for evaluating non-acoustic (memory-based) MMN effects (Schröger and Wolff, 1996; Jacobsen and Schröger, 2003; Jacobsen et al., 2003a,b). This was achieved by contrasting the change versus control (comparator part) conditions. This comparison controls for the P1-N1-P2 complex to the onset of the deviant stimulus (the /d/ portion) and to the onset of the /e:/ and /eI/ segments embedded within the deviant stimuli.
However, the effect of the direction of acoustic change may still confound the comparator part of the MMN and should therefore be controlled for. This was achieved by applying the control condition, the “teh”-“tay” contrast, that controlled for the acoustic transition from /e:/ to /eI/ allowing to assess the effect of the lexical status of the deviant that cannot be explained by the effects of the acoustic change alone.
4.3.3 The acoustic transition (from /e:/ to /eI/) may have confounded the MMN results
The results indicate a similarity between the “teh”-“tay” and “deh”-“day” contrasts. First, in both contrast types the cognitive effect reached significance but not in the case of the “deh”-“day” contrast (Fig. 2). Second, both contrast types mainly involved topography modulations over the P1-N1-P2 acoustic-change complex (Martin and Boothroyd, 1999) that also overlapped the MMN epoch (~250–300ms) (Fig. 2 “day”, “tay”, TANOVA). In contrast, in the “deh” deviant case, the MMN epoch was not associated with either significant topography or strength modulations. Third, overall, the “day”-“deh” contrast mainly involved strength modulations while the other two contrasts mainly involved topography modulations which began as early as ~ 70 msec post-stimulus onset (Fig. 2 “day”, “Deviance”). Fourth, the cognitive component was located in the cuneus/posterior cingulate gyrus when either “day” (Fig. 4B) or “tay” (Fig. 7B) served as deviants. This information suggests that the more robust activation of the comparator part of the MMN in case of deviant “day” was probably confounded with the response to the acoustic transition (/e:/ in the standard to /eI/ in the deviant).
Nevertheless, we can not entirely rule out the possibility that the lexical status of the deviant influenced the comparator part of the MMN. Specifically, ERP modulations associated with “day” were evident throughout the 400 ms post-stimulus analysis window (Fig. 2, “day”, “Deviance”, “Cognitive”) whereas in response to “tay” ERP modulations occurred mainly as from 200 ms post-stimulus (Fig. 2, “tay”, “Cognitive”) and were even more scarce in response to “deh” (Fig. 2, “deh”, “Deviance”). Thus, the effect of the deviant vowel (/eI/) on the MMN was more broadly distributed when the syllable (/eI/) was presented within a meaningful context. Furthermore, the enhanced activation in the left prefrontal cortex in response to deviant “day” might be related to its lexical status as a meaningful word (Gabrieli et al., 1998). Moreover, it was recently found that lexical changes (from a standard word to a deviant pseudoword and vice versa) unconfounded by the effects of acoustic change were detected automatically (Muller-Gass et al., 2007).
Taken together, the results indicate that the direction of acoustic change (from /e:/ to /eI/ or vice versa) may have confounded the MMN response. Thus, topography modulations associated with “day” that already began at ~ 70 ms (Fig. 2, “day”, “Deviance”) and the strength modulations associated with “deh” that started around ~ 100 ms (Fig. 2, ”deh”, “Deviance” ) reflect two different acoustic changes, respectively. This interpretation entails that the C-potentials, that is, the acoustic change detection process, contaminated the characteristics of the MMNs in case of the word and non-word deviants. However, since the responses to deviants “day” and “deh”, (Fig. 2,”day” and “deh”, “Deviance”) were also characterized by different modulations, i.e., topography versus strength modulations, respectively, it is more likely that different cortical processes underlined the response patterns observed for these deviants.
4.3.4 A possible interaction between the acoustic change detection system and the MMN
An alternative account for the response patterns obtained for deviants “day” and “deh” relies on the perceived salience of the acoustic change. The acoustic change from /e:/ to /eI/ comprises the inclusion of an additional feature, i.e., the /I/ element. However, the change from /eI/ to /e:/ includes an omission of an acoustic element. Thus, a deviant stimulus containing a diphthong vowel may “stand out” more in the context of a standard stimulus containing a monophthong vowel (/e:/) than the reverse condition (Pettigrew et al., 2004). This interpretation is supported by previous findings showing that the MMN system is less sensitive to omission of a stimulus element (i.e., partial omission of a stimulus) than to inclusion of the same stimulus element (e.g., /I/) (Nordby et al., 1994; Sabri and Campbell, 2000).
Sabri and Campbell (2000) found that when the deviant was constructed by the subtraction of a click from the standard, a significant MMN was obtained only when the click-to-noise ratio was very large. Similarly, in our study the transition from /eI/ to /e:/ (“day” to “deh”) was probably not salient enough to activate a robust MMN that will be accompanied with significant topography or strength modulations. Instead, strength modulations were found over the P1/N1 time interval (Fig. 2, “deh”, “Deviance”).
Observing Fig. 1 (“day”-“deh”, “ERPs”) reveals a difference between the deviant and control waveforms over the P1 latency range that diminishes at the N1 peak. Thus, it is unlikely that the difference is caused by refractoriness, otherwise, a larger difference would have been expected at the N1 peak (Fig. 1, “day”-“deh”, deviant vs. control waveforms). Instead, it is more likely to assume that the significant strength modulations over this time period, that end with the N1 peak, were caused by the acoustic change from /eI/ to /e:/. However, since this change per se was not salient enough to activate the comparator part of the MMN, only the acoustic change complex sensitive to the acoustic transition was elicited.
In contrast, when the change (from /e:/ to /eI/) was salient enough to activate the comparator part of the MMN (Fig. 2, “day” and “tay”) the acoustic change elicited topography modulations. Thus, two routes of processing were activated, one based on topography modulations in case of the larger perceived acoustic change and another based on strength modulations when the perceived acoustic change was less salient. This interpretation of the results relies on the assumption that the MNN and the acoustic change complex are separate systems. Specifically, according to this assumption, the C-potentials and MMN reflect different aspects of auditory processing in a stimulus-rich and changing environment: content analysis of the stimulus and novelty detection, respectively. Thus, the MMN system may play an important role in the extraction of information from sequential sounds (Jones et al., 2000; Laufer and Pratt, 2005).
The MMN reflects deviation from the memory representation of the standard sound (Näätänen, 1990, 1992) or from the sound input predicted by regularities embedded within the standards (Cowan et al., 1993; Näätänen and Winkler, 1999, Winkler, 2007). In order for the deviant sound to be perceived as a new auditory object it should surpass a certain threshold of deviation (the perceived difference between the standard and deviant sound) to activate the comparator part of the MMN (Horváth et al., 2008). Therefore, when the change is perceived as salient the processing of the incoming stimulus could be transferred to the MMN system by stimulating unadapted feature-specific neurons within the posterior auditory cortex.
This explanation is compatible with the adaptation hypothesis of MMN generation (Jääskeläinen et al., 2004) and with previous findings showing that the N1 (reflecting the sensory mechanism) is less sensitive (reveals broader tuning curves) to small changes than the MMN proper (Näätänen, 1992). However, our results suggest that the information on acoustic change is gathered prior to the N1 latency, already at the P1 latency range (around ~70 ms post-stimulus onset). Thus, it is suggested that the feature specific neurons which comprise the “Transient-Detector System” (Näätänen, 1990, 1992) are part of the C-potentials (Jones and Perez, 2002).
In sum, the deviant that included the monophthong /e:/ (“deh”) was less salient, did not pass a threshold necessary to activate the comparator mechanism of the MMN and only activated the acoustic change complex (the C-potentials) that involved amplitude modulations. On the other hand, the more salient stimulus that included the diphthong /eI/ (“day”) activated the comparator part of the MMN that involved topography modulations. Thus, the degree of salience of the deviant determined the type of mechanism responsible for its processing. The acoustic transition was already cued at the onset of the /e/ element of the deviant by the F1/F2 ratio and it was the spectral content that determined the processing route.
It is important to note that both processing types, the change (C)-process and the Mismatch (M)-process are dependent on accumulation of a sound image in the long auditory store (Jones et al., 2000; Jones and Perez, 2002) Therefore, the distinction between the C-potentials and the M-potentials is not clear-cut (Jones, 1991). However, the results of the current study corroborate previous findings (Jones et al., 1998; Vaz Pato and Jones, 1999) indicating that these are two separate processes. Furthermore, it is possible that the two systems interact with each other so that the M-process relies on input from the C-process.
4.4 Conclusions
Our results corroborate previous findings dissociating acoustic change detection (the C-process) from the MMN (the M-process). While the MMN reflects novelty detection of deviant features characterizing the auditory object as a whole in relation to other stimuli in a sequence, the C-potentials reflect the analysis of the spectro-temporal aspects of acoustic change (Jones et al., 2000; Laufer and Pratt, 2005). Our results also show that these two processes which rely on the long auditory store are temporally and spatially distinct, involve different response types and may interact with each other.
The results of the current study further suggest that the differentiation between the word and nonword deviant occurs as early as 70 ms post-stimulus onset. This early activation of differential cortical networks is compatible with recent findings showing early context effects associated with lexico-semantic stimulus features (Hasting et al., 2008; Wirth et al., 2008) and with auditory scene analysis (Chait et al., 2007).
Acknowledgments
The Cartool software (http://brainmapping.unige.ch/Cartool.htm) has been programmed by Denis Brunet, from the Functional Brain Mapping Laboratory, Geneva, Switzerland, and is supported by the Center for Biomedical Imaging (http://www.cibm.ch) of Geneva and Lausanne. We also thank Alice Faber from Haskins Laboratories for advice on stimulus selection. This material is based upon work supported by NIH R01 NS051622.
Footnotes
Publisher's Disclaimer: This is a PDF file of an unedited manuscript that has been accepted for publication. As a service to our customers we are providing this early version of the manuscript. The manuscript will undergo copyediting, typesetting, and review of the resulting proof before it is published in its final citable form. Please note that during the production process errors may be discovered which could affect the content, and all legal disclaimers that apply to the journal pertain.
References
- Ahveninen J, Jääskeläinen IP, Raij T, Bonmassar G, Devore S, Hämäläinen M, Levanen S, Lin FH, Sams M, Shinn-Cunningham BG, Witzel T, Belliveau JW. Task-modulated “what” and “where” pathways in human auditory cortex. Proc Natl Acad Sci U S A. 2006;103:14608–14613. doi: 10.1073/pnas.0510480103. [DOI] [PMC free article] [PubMed] [Google Scholar]
- Alain C, Arnott SR, Hevenor S, Graham S, Grady CL. “What” and “where” in the human auditory system. Proc Natl Acad Sci U S A. 2001a;98:12301–12306. doi: 10.1073/pnas.211209098. [DOI] [PMC free article] [PubMed] [Google Scholar]
- Alain C, Arnott SR, Picton TW. Bottom-up and top-down influences on auditory scene analysis: evidence from event-related brain potentials. J Exp Psychol Hum Percept Perform. 2001b;27:1072–1089. doi: 10.1037//0096-1523.27.5.1072. [DOI] [PubMed] [Google Scholar]
- Alain C, Schuler BM, McDonald KL. Neural activity associated with distinguishing concurrent auditory objects. J Acoust Soc Am. 2002;111:990–995. doi: 10.1121/1.1434942. [DOI] [PubMed] [Google Scholar]
- Alain C, Reinke K, He Y, Wang C, Lobaugh N. Hearing two things at once: neurophysiological indices of speech segregation and identification. J Cogn Neurosci. 2005;17:811–818. doi: 10.1162/0898929053747621. [DOI] [PubMed] [Google Scholar]
- Alain C, Tremblay K. The role of event-related brain potentials in assessing central auditory processing. J Am Acad Audiol. 2007;18:573–589. doi: 10.3766/jaaa.18.7.5. [DOI] [PubMed] [Google Scholar]
- Alho K. Cerebral generators of mismatch negativity (MMN) and its magnetic counterpart (MMNm) elicited by sound changes. Ear Hear. 1995;16:38–51. doi: 10.1097/00003446-199502000-00004. [DOI] [PubMed] [Google Scholar]
- Alho K, Huotilainen M, Tiitinen H, Ilmoniemi RJ, Knuutila J, Näätänen R. Memory-related processing of complex sound patterns in human auditory cortex: a MEG study. NeuroReport. 1993;4:391–394. doi: 10.1097/00001756-199304000-00012. [DOI] [PubMed] [Google Scholar]
- Altmann CF, Nakata H, Noguchi Y, Inui K, Hoshiyama M, Kaneoke Y, Kakigi R. Temporal Dynamics of Adaptation to Natural Sounds in the Human Auditory Cortex. Cereb Cortex. 2008;18:1350–1360. doi: 10.1093/cercor/bhm166. [DOI] [PubMed] [Google Scholar]
- Bohland JW, Guenther FH. An fMRI investigation of syllable sequence production. NeuroImage. 2006;32:821–841. doi: 10.1016/j.neuroimage.2006.04.173. [DOI] [PubMed] [Google Scholar]
- Brandeis D, Lehmann D, Michel CM, Mingrone W. Mapping event-related brain potential microstates to sentence endings. Brain Topogr. 1995;8:145–159. doi: 10.1007/BF01199778. [DOI] [PubMed] [Google Scholar]
- Budd TW, Barry RJ, Gordon E, Rennie C, Michie PT. Decrement of the N1 auditory event-related potential with stimulus repetition: habituation vs. refractoriness. Int J Psychophysiol. 1998;31:51–68. doi: 10.1016/s0167-8760(98)00040-3. [DOI] [PubMed] [Google Scholar]
- Èeponienë R, Torki M, Alku P, Koyama A, Townsend J. Event-related potentials reflect spectral differences in speech and non-speech stimuli in children and adults. Clin Neurophysiol. 2008;119:1560–1577. doi: 10.1016/j.clinph.2008.03.005. [DOI] [PMC free article] [PubMed] [Google Scholar]
- Chait M, Poeppel D, Simon JZ. Stimulus context affects auditory cortical responses to changes in interaural correlation. J Neurophysiol. 2007;98:224–231. doi: 10.1152/jn.00359.2007. [DOI] [PubMed] [Google Scholar]
- Cowan N, Winkler I, Teder W, Näätänen R. Memory prerequisites of the mismatch negativity in the auditory event-related potential (ERP) J exp Psychol learn. 1993;19:909–921. doi: 10.1037//0278-7393.19.4.909. [DOI] [PubMed] [Google Scholar]
- Czigler I, Balazs L, Winkler I. Memory-based detection of task-irrelevant visual changes. Psychophysiology. 2002;39:869–873. doi: 10.1111/1469-8986.3960869. [DOI] [PubMed] [Google Scholar]
- De Santis L, Clarke S, Murray MM. Automatic and intrinsic auditory “what” and “where” processing in humans revealed by electrical neuroimaging. Cereb Cortex. 2007;17:9–17. doi: 10.1093/cercor/bhj119. [DOI] [PubMed] [Google Scholar]
- Delorme A, Makeig S. EEGLAB: an open source toolbox for analysis of single-trial EEG dynamics including independent component analysis. J Neurosci Methods. 2004;134:9–21. doi: 10.1016/j.jneumeth.2003.10.009. [DOI] [PubMed] [Google Scholar]
- Diesch E, Biermann S, Luce T. The magnetic field elicited by word and phonological non-words. NeuroReport. 1998;9:455–460. doi: 10.1097/00001756-199802160-00018. [DOI] [PubMed] [Google Scholar]
- Donchin E, Spencer KM, Dien J. The varieties of deviant experience: ERP manifestations of deviance processors. In: van Box GJM, Bocker KBE, editors. Brain and Behavior: Past, Present and Future. Tilburg University Press; Tilburg: 1997. pp. 67–91. [Google Scholar]
- Fuchs M, Kastner J, Wagner M, Hawes S, Ebersole JS. A standardized boundary element method volume conductor model. Clin Neurophysiol. 2002;113:702–712. doi: 10.1016/s1388-2457(02)00030-5. [DOI] [PubMed] [Google Scholar]
- Gabrieli JD, Poldrack RA, Desmond JE. The role of left prefrontal cortex in language and memory. Proc Natl Acad Sci USA. 1998;95:906–913. doi: 10.1073/pnas.95.3.906. [DOI] [PMC free article] [PubMed] [Google Scholar]
- Hämäläinen MS, Hari R, Risto J, Ilmoniemi RJ, Knuutila J, Lounasmaa OV. Magnetoencephalography-theory, instrumentation, and applications to non-invasive studies of the working human brain. Rev Mod Phys. 1993;65:413–497. [Google Scholar]
- Hari R, Kaila K, Katila T, Tuomisto T, Varpula T. Interstimulus interval dependence of the auditory vertex response and its magnetic counterpart: implications for their neural generation. Electroencephalogr Clin Neurophysiol. 1982;54:561–569. doi: 10.1016/0013-4694(82)90041-4. [DOI] [PubMed] [Google Scholar]
- Hasting AS, Winkler I, Kotz SA. Early differential processing of verbs and nouns in the human brain as indexed by event-related brain potentials. Eur J Neurosci. 2008;27:1561–1565. doi: 10.1111/j.1460-9568.2008.06103.x. [DOI] [PubMed] [Google Scholar]
- Hocherman S, Gilat E. Dependence of auditory cortex evoked unit activity on interstimulus interval in the cat. J Neurophysiol. 1981;45:987–997. doi: 10.1152/jn.1981.45.6.987. [DOI] [PubMed] [Google Scholar]
- Horváth J, Czigler I, Jacobsen T, Maess B, Schröger E, Winkler I. MMN or no MMN: no magnitude of deviance effect on the MMN amplitude. Psychophysiology. 2008;45:60–69. doi: 10.1111/j.1469-8986.2007.00599.x. [DOI] [PubMed] [Google Scholar]
- Jääskeläinen IP, Ahveninen J, Bonmassar G, Dale AM, Ilmoniemi RJ, Levanen S, Lin FH, May P, Melcher J, Stufflebeam S, Tiitinen H, Belliveau JW. Human posterior auditory cortex gates novel sounds to consciousness. Proc Natl Acad Sci U S A. 2004;17:6809–6814. doi: 10.1073/pnas.0303760101. [DOI] [PMC free article] [PubMed] [Google Scholar]
- Jacobsen T, Horenkamp T, Schröger E. Preattentive memory-based comparison of sound intensity. Audiol Neurootol. 2003a;8:338–346. doi: 10.1159/000073518. [DOI] [PubMed] [Google Scholar]
- Jacobsen T, Horváth J, Schröger E, Lattner S, Widmann A, Winkler I. Preattentive auditory processing of lexicality. Brain Lang. 2004;88:54–67. doi: 10.1016/s0093-934x(03)00156-1. [DOI] [PubMed] [Google Scholar]
- Jacobsen T, Schröger E. Is there pre-attentive memory-based comparison of pitch? Psychophysiology. 2001;38:723–727. [PubMed] [Google Scholar]
- Jacobsen T, Schröger E. Measuring duration mismatch negativity. Clin Neurophysiol. 2003;114:1133–1143. doi: 10.1016/s1388-2457(03)00043-9. [DOI] [PubMed] [Google Scholar]
- Jacobsen T, Schröger E, Horenkamp T, Winkler I. Mismatch negativity to pitch change: Varied stimulus proportions in controlling effects of neural refractoriness on human auditory event-related brain potentials. Neurosci Lett. 2003b;344:79–82. doi: 10.1016/s0304-3940(03)00408-7. [DOI] [PubMed] [Google Scholar]
- Jones SJ. Sensitivity of human auditory evoked potentials to the harmonicity of complex tones: evidence for dissociated cortical processes of spectral and periodicity analysis. Exp Brain Res. 2003;150:506–514. doi: 10.1007/s00221-003-1482-9. [DOI] [PubMed] [Google Scholar]
- Jones SJ, Longe O, Vaz Pato M. Auditory evoked potentials to abrupt pitch and timbre change of complex tones. Electrophysiological evidence of ‘streaming’? Electroencephalogr Clin Neurophysiol. 1998;108:131–142. doi: 10.1016/s0168-5597(97)00077-4. [DOI] [PubMed] [Google Scholar]
- Jones SJ, Perez N. The auditory ‘C-process’: analyzing the spectral envelope of complex sounds. Clin Neurophysiol. 2001;112:965–975. doi: 10.1016/s1388-2457(01)00515-6. [DOI] [PubMed] [Google Scholar]
- Jones SJ, Perez N. The auditory C-process of spectral profile analysis. Clin Neurophysiol. 2002;113:1558–1565. doi: 10.1016/s1388-2457(02)00219-5. [DOI] [PubMed] [Google Scholar]
- Jones SJ, Pitman JR, Halliday AM. Scalp responses to coherence and discoherence of binaural noise and change in the interaural time difference: a specific binaural evoked potential or a ‘mismatch’ response? Electroencephalogr Clin Neurophysiol. 1991;80:147–154. doi: 10.1016/0168-5597(91)90152-n. [DOI] [PubMed] [Google Scholar]
- Jones SJ, Vaz Pato M, Sprague L. Spectro-temporal analysis of complex tones: two cortical processes dependent on retention of sounds in the long auditory store. Clin Neurophysiol. 2000;111:1569–1576. doi: 10.1016/s1388-2457(00)00360-6. [DOI] [PubMed] [Google Scholar]
- Jurcak V, Tsuzuki D, Dan I. 10/20, 10/10, and 10/5 systems revisited: Their validity as relative head-surface-based positioning systems. NeuroImage. 2007;34:1600–1611. doi: 10.1016/j.neuroimage.2006.09.024. [DOI] [PubMed] [Google Scholar]
- Krzanowski W, Lai YT. A criterion for determining the number of groups in a data set using sum of squares clustering. Biometrics. 1985;44:23–34. [Google Scholar]
- Kujala T, Tervaniemi M, Schröger E. The mismatch negativity in cognitive and clinical neuroscience: theoretical and methodological considerations. Biol Psychol. 2007;74:1–19. doi: 10.1016/j.biopsycho.2006.06.001. [DOI] [PubMed] [Google Scholar]
- Laufer I, Negishi M, Rajeevan N, Lacadie CM, Constable RT. Sensory and cognitive mechanisms of change detection in the context of speech. Brain Struc Func. 2008;212:427–442. doi: 10.1007/s00429-007-0167-8. [DOI] [PMC free article] [PubMed] [Google Scholar]
- Laufer I, Pratt H. The ‘F-complex’ and MMN tap different aspects of deviance. Clin Neurophysiol. 2005;116:336–352. doi: 10.1016/j.clinph.2004.08.007. [DOI] [PubMed] [Google Scholar]
- Lehmann D. Principles of spatial analysis. Handbook of electroencephalography and Clinical Neurophysiology. In: Gevins AS, Remond A, editors. Methods of Analysis of Brain Electrical and Magnetic Signals. Vol. 1. Elsevier; Amsterdam: 1987. pp. 309–354. [Google Scholar]
- Lehmann D, Skrandies W. Reference-free identification of components of checkerboard-evoked multichannel potential fields. Electroencephalogr Clin Neurophysiol. 1980;48:609–621. doi: 10.1016/0013-4694(80)90419-8. [DOI] [PubMed] [Google Scholar]
- Lomber SG, Malhotra S. Double dissociation of ‘what’ and ‘where’ processing in auditory cortex. Nat Neurosci. 2008;11:609–616. doi: 10.1038/nn.2108. [DOI] [PubMed] [Google Scholar]
- Maess B, Jacobsen T, Schröger E, Friederici AD. Localizing pre-attentive auditory memory-based comparison: magnetic mismatch negativity to pitch change. NeuroImage. 2007;37:561–571. doi: 10.1016/j.neuroimage.2007.05.040. [DOI] [PubMed] [Google Scholar]
- Martin BA, Boothroyd A. Cortical, auditory, event-related potentials in response to periodic and aperiodic stimuli with the same spectral envelope. Ear Hear. 1999;20:33–44. doi: 10.1097/00003446-199902000-00004. [DOI] [PubMed] [Google Scholar]
- Michel CM, Grave de Peralta R, Lantz G, Gonzalez Andino S, Spinelli L, Blanke O, Landis T, Seeck M. Spatiotemporal EEG analysis and distributed source estimation in presurgical epilepsy evaluation. J Clin Neurophysiol. 1999;16:239–266. doi: 10.1097/00004691-199905000-00005. [DOI] [PubMed] [Google Scholar]
- Michel CM, Murray MM, Lantz G, Gonzales S, Spinelli L, Grave de Peralta R. EEG source imaging. Clin Neurophysiol. 2004;115:2195–2222. doi: 10.1016/j.clinph.2004.06.001. [DOI] [PubMed] [Google Scholar]
- Michel CM, Thut G, Morand S, Khateb A, Pegna AJ, Grave de Peralta R, Gonzalez S, Seeck M, Landis T. Electric source imaging of human brain functions. Brain Res, Brain Res Rev. 2001;36:108–118. doi: 10.1016/s0165-0173(01)00086-8. [DOI] [PubMed] [Google Scholar]
- Muller-Gass A, Roye A, Kirmse U, Saupe K, Jacobsen T, Schröger E. Automatic detection of lexical change: an auditory event-related potential study. NeuroReport. 2007;18:1747–1751. doi: 10.1097/WNR.0b013e3282f0ea16. [DOI] [PubMed] [Google Scholar]
- Murray MM, Camen C, Spierer L, Clarke S. Plasticity in representations of environmental sounds revealed by electrical neuroimaging. NeuroImage. 2008;39:847–856. doi: 10.1016/j.neuroimage.2007.09.002. [DOI] [PubMed] [Google Scholar]
- Murray MM, Camen C, Gonzalez Andino SL, Bovet P, Clarke S. Rapid brain discrimination of sounds of objects. J Neurosci. 2006a;26:1293–1302. doi: 10.1523/JNEUROSCI.4511-05.2006. [DOI] [PMC free article] [PubMed] [Google Scholar]
- Murray MM, Imber ML, Javitt DC, Foxe JJ. Boundary completion is automatic and dissociable from shape discrimination. J Neurosci. 2006b;26:12043–12054. doi: 10.1523/JNEUROSCI.3225-06.2006. [DOI] [PMC free article] [PubMed] [Google Scholar]
- Murray MM, Michel CM, Grave de Peralta R, Ortigue S, Brunet D, Gonzales Andino S, Schnider A. Rapid discrimination of visual and multisensory memories revealed by electrical neuroimaging. NeuroImage. 2004;21:125–135. doi: 10.1016/j.neuroimage.2003.09.035. [DOI] [PubMed] [Google Scholar]
- Näätänen R. Processing negativity: an evoked-potential reflection of selective attention. Psychol Bull. 1982;92:605–640. doi: 10.1037/0033-2909.92.3.605. [DOI] [PubMed] [Google Scholar]
- Näätänen R. The role of attention in auditory information processing as revealed by event-related potentials and other brain measures of cognitive function. Behav Brain Sci. 1990;13:201–288. [Google Scholar]
- Näätänen R. Attention and brain function. Erlbaum; Hillsdale, NJ: 1992. [Google Scholar]
- Näätänen R, Jacobsen T, Winkler I. Memory-based or afferent processes in mismatch negativity (MMN): a review of the evidence. Psychophysiology. 2005;42:25–32. doi: 10.1111/j.1469-8986.2005.00256.x. [DOI] [PubMed] [Google Scholar]
- Näätänen R, Alho K. Mismatch negativity-the measure for central sound representation accuracy. Audiol Neurootol. 1997;2:341–353. doi: 10.1159/000259255. [DOI] [PubMed] [Google Scholar]
- Näätänen R, Picton T. The N1 wave of the human electric and magnetic response to sound: a review and an analysis of the component structure. Psychophysiology. 1987;24:375–425. doi: 10.1111/j.1469-8986.1987.tb00311.x. [DOI] [PubMed] [Google Scholar]
- Näätänen R, Tervaniemi M, Sussman E, Paavilainen P, Winkler I. ‘Primitive intelligence’ in the auditory cortex. Trends Neurosci. 2001;24:283–288. doi: 10.1016/s0166-2236(00)01790-2. [DOI] [PubMed] [Google Scholar]
- Näätänen R, Winkler I. The concept of auditory stimulus representation in cognitive neuroscience. Psychol Bull. 1999;125:826–859. doi: 10.1037/0033-2909.125.6.826. [DOI] [PubMed] [Google Scholar]
- Nakamoto KT, Zhang J, Kitzes LM. Temporal nonlinearity during recovery from sequential inhibition by neurons in the cat primary auditory cortex. J Neurophysiol. 2006;95:1897–1907. doi: 10.1152/jn.00625.2005. [DOI] [PubMed] [Google Scholar]
- Nordby H, Hammerborg D, Roth WT, Hugdahl K. ERPs for infrequent omissions and inclusions of stimulus elements. Psychophysiology. 1994;31:544–552. doi: 10.1111/j.1469-8986.1994.tb02347.x. [DOI] [PubMed] [Google Scholar]
- Opitz B, Schröger E, von Cramon DY. Sensory and cognitive mechanisms for preattentive change detection in auditory cortex. Eur J Neurosci. 2005;21:531–535. doi: 10.1111/j.1460-9568.2005.03839.x. [DOI] [PubMed] [Google Scholar]
- Ostroff MJ, Martin BA, Boothroyd A. Cortical evoked responses to acoustic change within a syllable. Ear Hear. 1998;19:290–297. doi: 10.1097/00003446-199808000-00004. [DOI] [PubMed] [Google Scholar]
- Pantev C, Hoke M, Lötkenhöner B, Lehnertz K. Tonotopic organization of the auditory cortex: pitch versus frequency representation. Science. 1989;246:486–468. doi: 10.1126/science.2814476. [DOI] [PubMed] [Google Scholar]
- Pascual-Marqui RD, Michel CM, Lehmann D. Segmentation of brain electrical activity into microstates: model estimation and validation. IEEE Trans Biomed Eng. 1995;42:658–665. doi: 10.1109/10.391164. [DOI] [PubMed] [Google Scholar]
- Pasqual-Marqui RD. Standardized low resolution brain electromagnetic tomography (sLORETA): technical details. Methods Find Exp Clin Pharmacol. 2002;24D:5–12. [PubMed] [Google Scholar]
- Pazo-Alvarez P, Amenedo E, Lorenzo-Lopez L, Cadaveira F. Effects of stimulus location on automatic detection of changes in motion direction in the human brain. Neurosci Lett. 2004;371:111–116. doi: 10.1016/j.neulet.2004.08.073. [DOI] [PubMed] [Google Scholar]
- Pettigrew CM, Murdoch BE, Ponton CW, Finnigan S, Alku P, Kei J, Sockalingam R, Chenery HJ. Automatic auditory processing of English words as indexed by the mismatch negativity, using a multiple deviant paradigm. Ear Hear. 2004;25:284–301. doi: 10.1097/01.aud.0000130800.88987.03. [DOI] [PubMed] [Google Scholar]
- Pollmann S, Lepsien J, Hugdahl K, von Cramon DY. Auditory target detection in dichotic listening involves the orbitofrontal and hippocampal paralimbic belts. Cereb Cortex. 2004;14:903–913. doi: 10.1093/cercor/bhh049. [DOI] [PubMed] [Google Scholar]
- Pulvermüller F, Kujala T, Shtyrov Y, Simola J, Tiitinen H, Alku P, Alho K, Martinkauppi S, Ilmoniemi RJ, Näätänen R. Memory traces for words as revealed by the mismatch negativity. NeuroImage. 2001;14:607–616. doi: 10.1006/nimg.2001.0864. [DOI] [PubMed] [Google Scholar]
- Pulvermüller F, Mohr B, Lutzenberger W. Neurophysiological correlates of word and pseudo-word processing in well-recovered aphasics and patients with right-hemispheric stroke. Psychophysiology. 2004;41:584–591. doi: 10.1111/j.1469-8986.2004.00188.x. [DOI] [PubMed] [Google Scholar]
- Pulvermüller F, Shtyrov Y, Ilmoniemi RJ, Marslen-Wilson WD. Tracking speech comprehension in space and time. NeuroImage. 2006;31:1297–1305. doi: 10.1016/j.neuroimage.2006.01.030. [DOI] [PubMed] [Google Scholar]
- Ritter W, Vaughan HG, Jr, Costa LD. Orienting and habituation to auditory stimuli: a study of short term changes in average evoked responses. Electroencephalogr Clin Neurophysiol. 1968;25:550–556. doi: 10.1016/0013-4694(68)90234-4. [DOI] [PubMed] [Google Scholar]
- Sabri M, Campbell KB. Mismatch negativity to inclusions and omissions of stimulus features. NeuroReport. 2000;11:1503–1507. [PubMed] [Google Scholar]
- Schröger E. Higher-order processes in auditory-change detection: a response to Näätänen and Alho. Trends Cogn Sci. 1997;1:45–46. doi: 10.1016/S1364-6613(97)01013-9. [DOI] [PubMed] [Google Scholar]
- Schröger E, Wolff C. Mismatch response to changes in sound location. NeuroReport. 1996;7:3005–3008. doi: 10.1097/00001756-199611250-00041. [DOI] [PubMed] [Google Scholar]
- Schröger E, Wolff C. Behavioral and electrophysiological effects of task-irrelevant sound change: a new distraction paradigm. Cogn Brain Res. 1998;7:71–87. doi: 10.1016/s0926-6410(98)00013-5. [DOI] [PubMed] [Google Scholar]
- Shtyrov Y, Osswald K, Pulvermüller F. Memory traces for spoken words in the brain as revealed by the hemodynamic correlate of the mismatch negativity. Cereb Cortex. 2007;18:29–37. doi: 10.1093/cercor/bhm028. [DOI] [PubMed] [Google Scholar]
- Shtyrov Y, Pihko E, Pulvermüller F. Determinants of dominance: is language laterality explained by physical or linguistic features of speech? NeuroImage. 2005;27:37–47. doi: 10.1016/j.neuroimage.2005.02.003. [DOI] [PubMed] [Google Scholar]
- Shtyrov Y, Pulvermüller F. Neurophysiological evidence of memory traces for words in the human brain. NeuroReport. 2002;13:521–525. doi: 10.1097/00001756-200203250-00033. [DOI] [PubMed] [Google Scholar]
- Sonty SP, Mesulam MM, Thompson CK, Johnson NA, Weintraub S, Parrish TB, Gitelman DR. Primary progressive aphasia: PPA and the language network. Ann Neurol. 2003;53:35–49. doi: 10.1002/ana.10390. [DOI] [PubMed] [Google Scholar]
- Strik WK, Fallgatter AJ, Brandeis D, Pascual-Marqui RD. Three-dimensional tomography of event-related potentials during response inhibition: evidence for phasic frontal lobe activation. Electroencephalogr Clin Neurophysiol. 1998;108:406–413. doi: 10.1016/s0168-5597(98)00021-5. [DOI] [PubMed] [Google Scholar]
- Thompson RF, Spencer WA. Habituation: a model phenomenon for the study of neuronal substrates of behavior. Psychol Rev. 1966;73:16–43. doi: 10.1037/h0022681. [DOI] [PubMed] [Google Scholar]
- Tremblay KL, Friesen L, Martin BA, Wright R. Test-retest reliability of cortical evoked potentials using naturally produced speech sounds. Ear Hear. 2003;24:225–232. doi: 10.1097/01.AUD.0000069229.84883.03. [DOI] [PubMed] [Google Scholar]
- Tremblay KL, Kalstein L, Billings CJ, Souza PE. The neural representation of consonant-vowel transitions in adults who wear hearing AIDS. Trends Amplif. 2006;10:155–162. doi: 10.1177/1084713806292655. [DOI] [PMC free article] [PubMed] [Google Scholar]
- Ulanovsky N, Las L, Nelken I. Processing of low-probability sounds by cortical neurons. Nat Neurosci. 2003;6:391–398. doi: 10.1038/nn1032. [DOI] [PubMed] [Google Scholar]
- Vaz Pato M, Jones SJ. Cortical processing of complex tone stimuli: mismatch negativity at the end of a period of rapid pitch modulation. Cogn Brain Res. 1999;7:295–306. doi: 10.1016/s0926-6410(98)00032-9. [DOI] [PubMed] [Google Scholar]
- Wackermann J, Lehmann D, Michel CM, Strik WK. Adaptive segmentation of spontaneous EEG map series into spatially defined microstates. Int J Psychophysiol. 1993;14:269–283. doi: 10.1016/0167-8760(93)90041-m. [DOI] [PubMed] [Google Scholar]
- Wagner M, Fuchs M, Kastner J. Evaluation of sLORETA in the presence of noise and multiple sources. Brain Topogr. 2004;16:277–280. doi: 10.1023/b:brat.0000032865.58382.62. [DOI] [PubMed] [Google Scholar]
- Winkler I. Interpreting the mismatch negativity (MMN) J Psychophysiol. 2007;21:147–163. [Google Scholar]
- Wirth M, Horn H, Koenig T, Razafimandimby A, Stein M, Muller T, Federspiel A, Meier B, Dierks T, Strik W. The early context effect reflects activity in the temporo-prefrontal semantic system: Evidence from electrical neuroimaging of abstract and concrete word reading. NeuroImage. 2008;42:423–436. doi: 10.1016/j.neuroimage.2008.03.045. [DOI] [PubMed] [Google Scholar]
- Yagcioglu S, Ungan P. Refractoriness, habituation, and mismatch effects in the auditory event-related potential to alternating stimuli. NeuroReport. 2008;19:49–53. doi: 10.1097/WNR.0b013e3282f2dfe1. [DOI] [PubMed] [Google Scholar]
- Zatorre RJ, Gandour JT. Neural specializations for speech and pitch: moving beyond the dichotomies. Philos Trans R Soc Lond B Biol Sci. 2008;363:1087–1104. doi: 10.1098/rstb.2007.2161. [DOI] [PMC free article] [PubMed] [Google Scholar]