Abstract
BACKGROUND:
Multidetector computed tomography (MDCT) is useful for assessing left ventricular (LV) volumes and function. Validation has mainly been carried out using Simpson’s method of summing up consecutive short-axis areas. Because the latter method is time-consuming, many users prefer using a quicker method, based on a single view or a pair of views.
OBJECTIVES:
To evaluate the accuracy of the long-axis area-length method (AL), which has not been validated for MDCT, using Simpson’s method as the gold standard, as well as right anterior oblique LV angiography as a clinical standard.
METHODS:
Twenty-three patients admitted with acute chest pain were clinically evaluated with electrocardiogram-gated MDCT and invasive LV angiography. MDCT-based end-diastolic, end-systolic and stroke volumes, and ejection fraction (EF) were calculated using Simpson’s method, biplane AL and single-plane AL. For LV angiography, EF was calculated using single-plane AL.
RESULTS:
A Bland-Altman analysis showed a close agreement between biplane AL and Simpson’s method for EF, with 1% underestimation, 95% CI of ±11% and a correlation of 0.89. For end-diastolic, end-systolic and stroke volumes, overestimations of 7 mL, 4 mL and 2 mL, and 95% CI of ±27 mL, ±15 mL and ±26 mL, respectively were found. Correlation coefficients were 0.95, 0.97 and 0.82, respectively. Comparisons with LV angiography were considerably weaker. The vertical long-axis AL method by MDCT correlated better with both LV angiography and Simpson’s method than the horizontal long-axis AL method.
CONCLUSIONS:
The biplane AL method gives results for EF, which correspond closely with the more cumbersome Simpson’s method, although volumes are slightly overestimated.
Keywords: Catheterization, Imaging, Left ventricle, Myocardial contraction, Myocardial infarction
Abstract
HISTORIQUE :
La tomographie à multidétecteurs (TGMD) est utile pour évaluer les volumes et la fonction ventriculaires gauches (VG). La validation a été pour une bonne part réalisée à l’aide de la méthode de Simpson établissant la somme des aires axe court consécutives. Parce que cette dernière méthode est fastidieuse, de nombreux utilisateurs préfèrent une méthode plus rapide basée sur une ou deux perspectives.
OBJECTIF :
Évaluer la précision de la méthode aire-longueur (AL) long axe, qui n'a pas été validée pour la TGMD, à l'aide de la méthode de Simpson comme étalon-or et à l’aide de l’angiographie VG droite antérieure oblique comme norme clinique.
MÉTHODES :
Vingt-trois patients admis pour DRS aiguë ont été évalués sur le plan clinique au moyen d’une TGMD synchronisée avec l’électrocardiogramme et d’une angiographie VG effractive. Les volumes télédiastoliques, télésystoliques, le volume d’éjection systolique et la fraction d’éjection (FÉ) ont été calculés à l’aide de la méthode de Simpson AL bidimensionnelle et AL unidimensionnelle. Pour l’angiographie VG, la FÉ a été calculée à l’aide de la méthode AL unidimensionnelle.
RÉSULTATS :
Une analyse de Bland-Altman a montré une concordance étroite entre la méthode AL bidimensionnelle et la méthode de Simpson pour la FÉ, avec une sous-estimation de 1 % et un IC à 95 % de ± 11 % et un coefficient de 0,89. Pour les volumes télédiastoliques, télésystoliques et d’éjection systolique, on a observé des surestimations de 7 mL, 4 mL, 2 mL, et des IC à 95 % de ± 27 mL, ± 15 mL et ± 26 mL. Les coefficients de corrélation étaient de 0.95, 0.97 et 0.82, respectivement. Les comparaisons avec l’angiographie VG ont été considérablement plus faibles. La méthode AL long axe par TGMD a été en meilleure corrélation avec l’angiographie VG et avec la méthode de Simpson, comparativement à la méthode AL long axe horizontale.
CONCLUSION :
La méthode AL bidimensionnelle donne des résultats de FÉ qui correspondent étroitement avec la méthode de Simpson, plus fastidieuse, même si les volumes sont légèrement surestimés.
Multidetector computed tomography (MDCT) is a versatile imaging technique, which, in a single scan, permits the evaluation of coronary anatomy, as well as ventricular function (1) as an accessory finding. A thorough evaluation, however, is rather time-consuming, because each study involves a huge number of images at different cardiac phases, and processing the images just to calculate left ventricular (LV) ejection fraction (EF) can require up to 20 min by a dedicated technician or physician (2). A simpler method, the long-axis area-length (AL) method, which is regularly used to calculate LV volumes and EF by echocardiography, invasive LV angiography and magnetic resonance imaging (3) has, to the best of our knowledge, yet to be validated for MDCT. We aimed to compare the accuracy of LV volumes and EF calculated by the AL method with the more exact and previously validated Simpson’s method (2,4) in a group of patients with a high prevalence of regional LV dysfunction. We also compared these results with right anterior oblique LV angiography, which is a routine clinical standard used for the estimation of EF. In addition, we aimed to compare single-plane with biplane results and assess interuser variability when the method is performed by users of varying experience. We hypothesized that the biplane long-axis AL method gives clinically valid results relative to the gold standard, the Simpson’s method.
METHODS
Study population
Twenty-three consecutive patients admitted to the Rambam Health Care Campus (Haifa, Israel) hospital with acute chest pain between February 2003 and March 2004 who underwent MDCT and LV angiography in the course of their hospital stay were studied. These patients comprise a subgroup of patients studied to compare MDCT coronary angiography with invasive catheter angiography for the detection of coronary artery stenosis (5). The study group included 20 men and three women who were 41 to 77 years of age (mean [± SD] age 52.6±9.8 years). Twelve patients (52%) were diagnosed as having acute myocardial infarction (four in the left anterior descending artery, four in the left circumflex and four in the right coronary artery territory), five patients (22%) had a previous myocardial infarction (three in the left anterior descending artery and two in the right coronary artery territory), two patients (9%) had unstable angina pectoris (both in the left anterior descending artery territory) and four patients (17%) had atypical chest pain. Exclusion criteria included arrhyth mia, asthma, renal failure, unstable patients and inability to perform the required breath hold. All patients gave informed consent. The study had the approval of the local Helsinki committee for human experiments.
MDCT scan
Electrocardiogram-gated MDCT angiography was performed using Brilliance 16-channel scanner (Philips Medical Systems, USA) average of 5±4 days after admission. The following imaging and reconstruction parameters were used: detector collimation 16 mm × 0.75 mm; voltage of 120 kV to 140 kV; effective current 400 mA to 500 mA; relative pitch of 0.2 to 0.3; rotation time 0.42 s; field of view of 220 mm; reconstruction slice width of 1 mm; and increment of 0.5 mm. Neither electrocardiogram-based dose modulation nor premedication with beta-blockers for lowering heart rate were used. The mean heart rate during MDCT examinations was 72.5±10.4 beats/min (range 58 beats/min to 100 beats/min) Between 120 mL and 130 mL of nonionic iodinated contrast mate rial (Ultravist, 370 mgI/mL; Schering AG, Germany) was injected a rate of 4 mL/s using a power injector. The scan delay was deter mined using the Bolus Pro Ultra tracking technique: when a thresh old of 150 HU was reached in the descending aorta at the inferior level of the carina, a delay of 5 s to 6 s was applied before the scan was initiated. Scans were performed during a single breath hold and lasted 20 s to 30 s. The average radiation dose applied for a typical patient was 8.1 mSv.
Using multisector algorithms for optimized temporal resolution (6), phases were reconstructed at 0%, 40%, 45% and 50% of the R-R inter val, using a previously described delay algorithm (7), which accounts for the relative change in the diastole to systole ratio as the heart rate increases. The phases represent the centre of the reconstruction inter val. The first phase of the cardiac cycle (0%) was considered to be end-diastole, whereas the image with the visually estimated smallest cavity was considered to be LV end-systole. The authors of the present paper have previously shown that this approach leads to a negligible error for both end-diastolic volume and end-systolic volume (8), latter invariably occurring between phases 40% and 50%.
Reformations, processing and calculations of LV volumes and LVEF by the AL method were independently performed by an attending car diologist with 18 years experience in cardiac imaging (JL, experienced user), an attending radiologist with four years of experience in cardiac imaging (EG, regular user) and a final year radiology fellow with approximately six months of experience in cardiac imaging (SA, novice user) on Extended Brilliance Workspace (Philips Medical Systems). In addition, volumes and EF were calculated by two different observers (EG, SA) by Simpson’s method (summing the endocardial area of all LV end-diastolic and LV end-systolic vertical short-axis slices multiplied by slice thickness), using semiautomatic software previously validated and found to be equivalent to cine magnetic resonance (4) For comparisons between the two methods, the most experienced users’ results were used (JL for AL and EG for Simpson’s method).
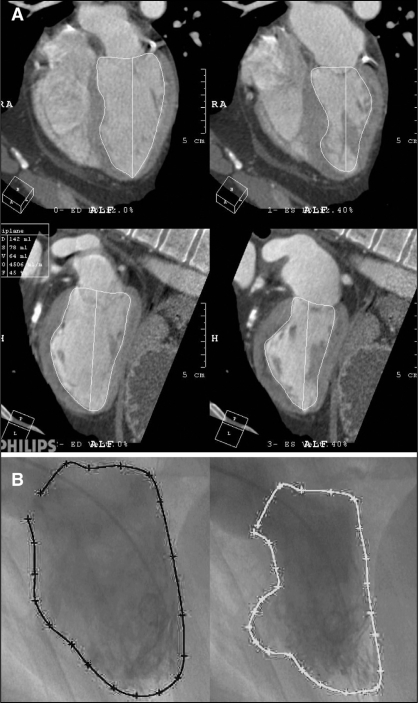
For both methods, the cardiac axes are initially automatically estimated and displayed. If necessary, manual corrections of the cardiac axis are applied until optimal orthogonal horizontal and vertical long axis images are obtained, being approximately equivalent to conventional four- and two-chamber views. For the AL method, the cavity ‘area’ is obtained in each view by manual planimetry of the endocardial border at end-diastole and end-systole (as defined above), excluding the papillary muscles (Figure 1). The LV long-axis (L ‘length’) is measured as the line from the LV apex to the mitral valve annulus. Single-plane volumes are then calculated using the following formula:
Biplane volumes are calculated as:
Figure 1).
A An example of the biplane area-length method in a patient with a large apical myocardial infarction. Horizontal long-axis multiplanar reformat at end-diastole (top left) and end-systole (top right). Vertical long-axis view at end-diastole (bottom left) and end-systole (bottom right). B A right anterior oblique left ventriculogram, in the same patient, which was approximately in the same orientation as the vertical long-axis view of the multidetector computed tomographic image. End-diastole (left) and end-systole (right). RA Right atrium
LMin is the shorter of the horizontal and vertical long-axis dimensions, and Area1 and Area2 are the two areas (9).
For Simpson’s method, the technique previously described (4) is summarized. The LV long-axis is defined separately at end-diastole and end-systole by marking the locations of the apex and base (centre of the mitral valve annulus). Nine equally spaced short-axis reformations with a thickness of 3 mm are then created, orthogonal to the LV long axis. Next, detailed contours of the LV endocardial border, including the papillary muscles, are automatically traced. If necessary, manual editing of the traced contours of the endocardial border is performed.
LV angiography
Except for one patient, MDCT and LV angiography were performed within an interval of 2.6±2.3 days. The remaining patient with atypical chest pain and normal LV function had LV angiography performed six weeks after MDCT. The mean heart rate during LV angiography (70.2±12.6 beats/min, range 52 beats/min to 99 beats/min) was not significantly different from that during MDCT (P=0.44). LV angiography was performed using a 6 Fr pigtail catheter with automated injection of 40 mL of contrast material (Ultravist, 300 mgI/mL; Schering AG) at a flow rate of 20 mL/s. Images were acquired in the right anterior oblique projection at 25 frames/s and were digitally recorded on a Coroskop Top system (Siemens Medical Solutions, Germany). A cardiologist (SY) blinded to other diagnostic examination results and to patients’ histories interpreted all ventriculograms using a dedicated software package (Medcon Quantitative Measurements; QCA, USA). The end-systolic and end-diastolic images were selected and manually segmented. A geometric assumption method was applied to calculate the LVEF using the single-plane AL method.
Statistical analysis
The Bland-Altman analysis (10) was used to compare LV volumes and LVEF results using the different methods. In addition, Pearson correlation coefficients were calculated. Interobserver variability and repeatability was expressed as 95% CI, based on Bland-Altman analysis. All results are expressed as mean ± SD unless specified otherwise. Generally, P<0.05 was regarded to be significant. When multiple tests were performed, P<0.01 was required for statistical significance. Statistical analysis was performed using a Microsoft Excel worksheet (Microsoft Corp, USA) and the GB-Stat version 6.5 software package (Dynamic Microsystems, USA).
RESULTS
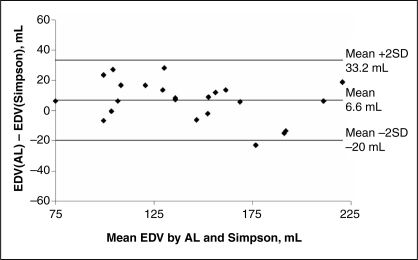
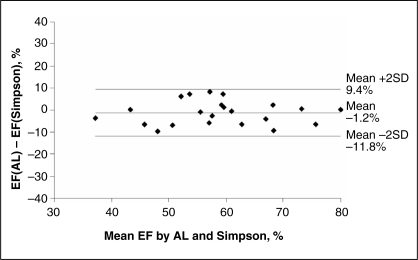
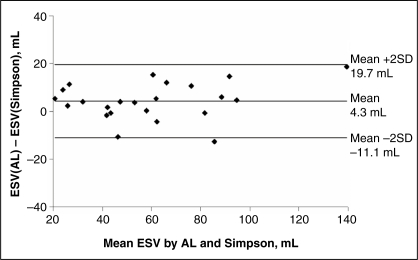
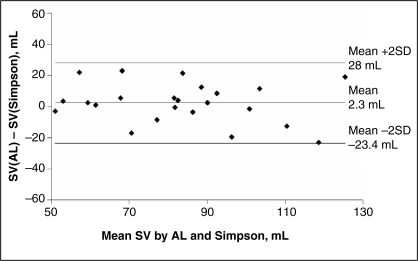
Table 1 and Figures 2 to 5 show the results of the agreement between the AL method and the gold standard, Simpson’s method, for end-diastolic volume, end-systolic volume, stroke volume and EF. Results show minimal bias and a good 95% CI for volumes (less than 30 mL) and EF (lower than 11%). Agreement was consistent for the entire spectrum of volumes and EFs studied, as can be seen in the Bland-Altman plots (Figures 2 to 5). The two methods were also closely correlated in terms of all parameters (0.82 to 0.97; Table 1). Compared with the gold standard, the AL method erred by, at most, 10% in the estimation of EF. Agreement between the AL method by MDCT and the same method by right anterior oblique LV angiography was moderate (Table 2). The biplane EF took a mean of 3.2±0.6 min to complete compared with 4.7±1.1 min for Simpson’s method (P<0.001).
TABLE 1.
Bland-Altman analysis and correlation for volumes and ejection fraction (EF) for biplane area-length (AL) method versus Simpson’s method for three different users
| Expert user | Regular user | Novice user | ||
|---|---|---|---|---|
| EDV | Mean ± SD (mL) | 146±37*** | 162±45 | 160±40 |
| Bias ± SD (mL) | 7±13 | 23±18 | 21±14 | |
| r (versus Simpson’s) | 0.95 | 0.92 | 0.94 | |
| ESV | Mean ± SD (mL) | 62±30*** | 73±34 | 73±31 |
| Bias ± SD (mL) | 4±8 | 15±11 | 16±11 | |
| r (versus Simpson’s) | 0.97 | 0.96 | 0.94 | |
| SV | Mean ± SD (mL) | 84±20* | 90±23 | 87±25 |
| Bias ± SD (mL) | 2±13 | 8±15 | 5±15 | |
| r (versus Simpson’s) | 0.82 | 0.79 | 0.81 | |
| EF | Mean ± SD (%) | 59±12*** | 57±11 | 55±12 |
| Bias ± SD (%) | –1±5 | –4±5 | –5±7 | |
| r (versus Simpson’s) | 0.89 | 0.90 | 0.91 |
The biplane AL method was performed by three different users and Simpson’s method was performed by one user.
*P<0.01 experienced user versus regular user;
**P<0.01 experienced user versus novice user. EDV End-diastolic volume; ESV End-systolic volume; r Pearson’s correlation coefficient; SV Stroke volume
Figure 2).
Bland-Altman analysis for the biplane area-length (AL) method versus Simpson’s method by multidetector computed tomography for end-diastolic volume (EDV)
Figure 5).
Bland-Altman analysis for the biplane area-length (AL) method versus Simpson’s method by multidetector computed tomography for ejection fraction (EF)
TABLE 2.
Bland-Altman analysis and correlation for volumes and ejection fraction (EF) for biplane and single-plane area-length method versus Simpson’s method and left ventricular angiography
| Biplane | HLA | VLA | ||
|---|---|---|---|---|
| EDV | Mean ± SD (mL) | 146±37*** | 126±36*** | 165±42 |
| Bias ± SD (mL) | 7±13 | –13±17 | 26±21 | |
| r (versus Simpson’s) | 0.95 | 0.91 | 0.88 | |
| ESV | Mean ± SD (mL) | 62±30** | 56±25 | 66±36 |
| Bias ± SD (mL) | 4±8 | –1±9 | 8±15 | |
| r (versus Simpson’s) | 0.97 | 0.95 | 0.92 | |
| SV | Mean ± SD (mL) | 84±20*** | 70±20*** | 100±27 |
| Bias ± SD (mL) | 2±13 | –12±17 | 18±18 | |
| r (versus Simpson’s) | 0.82 | 0.71 | 0.76 | |
| EF | Mean ± SD (%) | 59±12* | 57±11 | 62±14 |
| Bias ± SD (%) | –1±5 | –3±8 | 1±6 | |
| r (versus Simpson’s) | 0.89 | 0.78 | 0.90 | |
| EF† | Mean ± SD (%) | 59±12* | 57±11 | 62±14 |
| Bias ± SD (%) | 4±13† | 2±15† | 2±14† | |
| r (versus LVG) | 0.74 | 0.61 | 0.77 |
*P<0.01 biplane versus horizontal long-axis (HLA);
**P<0.01 biplane versus vertical long-axis (VLA);
***P<0.01 HLA versus VLA.
†Versus EF by right anterior oblique left ventricular angiography. EDV End-diastolic volume; ESV End-systolic volume; SV Stroke volume
All three users achieved comparable results, with similar 95% CI (Table 1); however the regular user and the novice user tended to overestimate the LV volumes relative to the gold standard, with slightly larger 95% CI. For EF, the novice obtained more bias and larger 95% CI, as well as a lower correlation coefficient, than the other two users.
The biplane results tended to agree better with the gold standard than either of the single-plane methods for the LV volumes and stroke volume (Table 2). For EF, however, results using the vertical long-axis were very similar to biplane EF. When comparing results of the AL method by MDCT versus right anterior oblique LV angiography, EF measured from the vertical long-axis plane (being approximately in the same anatomical plane as the right anterior oblique LV angiography) correlated better with LV angiography than the horizontal long-axis plane (r=0.77 versus r=0.61), as expected.
Interobserver variability was close between all users; however, variability for the AL method tended to be slightly worse than that achieved using Simpson’s method (Table 3).
TABLE 3.
Interobserver reproducibility (correlation coefficients and Bland-Altman analysis)
| Correlation coefficient
|
Bias ± SD (versus Simpson’s)
|
|||||
|---|---|---|---|---|---|---|
| Area-length method
|
Simpson’s method
|
Area-length method
|
Simpson’s method
|
|||
| Expert versus regular users | Expert versus novice users | Regular versus novice users | Expert versus regular users | Expert versus novice users | Regular versus novice users | |
| End-diastolic volume (mL) | 0.98 | 0.96 | 0.98 | –16.5±11.3 | –14.0±11.1 | 8.1±8.5 |
| End-systolic volume (mL) | 0.99 | 0.96 | 0.99 | –10.8±6.6 | –8.6±8.2 | 2.7±4.2 |
| Stroke volume (mL) | 0.94 | 0.89 | 0.94 | –5.7±7.8 | –2.6±11.9 | 5.4±8.4 |
| Ejection fraction (%) | 0.96 | 0.87 | 0.95 | 2.4±3.1 | 4.2±6.2 | 0.7±4.3 |
DISCUSSION
Expanding use of MDCT for evaluation of coronary artery disease is accompanied by the need to obtain accessory information from the same study regarding LV function, which is critical in clinical decision making for optimal management of this patient group. For this aim, a simple, quick assessment of LV volumes and EF is required. The long-axis AL method is highly accepted for this purpose in echocardiography and LV angiography; however, it has not, to the best of our knowledge, been validated for use in MDCT.
The AL method for calculating LV function is simple and quick to apply, not requiring sophisticated software packages or the creation of multiple short-axis reformations of short-axis slices, compared with the more conventional Simpson’s method. On the other hand, it is based on geometric assumptions of ellipsoidal geometry and requires some educated ‘guesswork’ on exactly how to cut through the papillary muscles. This may lead to inaccurate estimates of true volumes, especially in patients with regional dysfunction. Thus, in the present study, we compared the AL method with Simpson’s method, which is not based on any geometric assumptions, and to LV angiography, which is also based on the AL method. Our results, based on a group of patients with a high proportion of regional dysfunction, show a close agreement between the AL and Simpson’s methods, and a moderate agreement with LV angiography, suggesting that the AL method may be substituted for Simpson’s method. This enables EF calculations to be performed in a simple and time-effective way, and to therefore come into routine use as part of MDCT coronary angiography. Our results also support the accuracy of this method in abnormally shaped ventricles with regional ischemic damage, which make up a large proportion of the population studied.
Because the method requires some degree of expertise, we compared results between users of differing experience in cardiac imaging and found a mild improvement in agreement associated with increasing experience. However, clinically, it appears that the AL method is reasonably robust even when applied by novice users, on the condition that they receive prior training in the technique.
We also examined whether the use of only a single plane may be acceptable. Our results indicate, as expected, that biplane results are more accurate than single-plane measures; however, if only one plane is used, the vertical long-axis (or two-chamber) plane is preferable to the horizontal long-axis (or four-chamber) plane. It may be reasonable to rely on a single plane for EF in the absence of regional dysfunction, although this was not examined in the current study.
Previous studies have also shown only a moderate agreement between MDCT and two-dimensional imaging techniques, such as LV angiography and echocardiography (11–13), but an excellent agreement with three-dimensional methods, such as magnetic resonance imaging (1,2,4,13). Because MDCT is a true three-dimenional imaging modality with excellent spatial and contrast resolutions, it is not surprising that functional analysis with MDCT is more accurate than two-dimensional methods compared with magnetic resonance imaging, as found by Yamamuro et al (13).
Another approach to speeding up the time required for evaluation of LV volumes and function involves automatic segmentation of the LV volumes. One study (14) attempted this approach using computed tomography, but the segmentation was successful in only 65% of cases attempted. Future algorithmic improvements will most likely make this the method of choice.
Limitations of the present study include the time difference between performance of MDCT and LV angiography in the setting of acute myocardial infarction, which may partly explain the relatively moderate agreement between the two. LV angiography was performed in only a single projection, because this is the clinical standard in our hospital and many other hospitals. It should be stressed that single-plane LV angiography only allows assessment of certain portions of the LV anatomy and is therefore unreliable in the evaluation of patients with regional LV dysfunction. In addition, the number of patients studied was relatively small.
In summary, the present study demonstrates that the AL method is a clinically acceptable alternative for evaluating LV volumes and func tion by MDCT, even in the hands of inexperienced users, although it may overestimate LV volumes relative to Simpson’s method and may slightly underestimate EF.
Figure 3).
Bland-Altman analysis for the biplane area-length (AL) method versus Simpson’s method by multidetector computed tomography for end-systolic volume (ESV)
Figure 4).
Bland-Altman analysis for the biplane area-length (AL) method versus Simpson’s method by multidetector computed tomography for stroke volume (SV)
REFERENCES
- 1.Kopp AF, Heuschmid M, Reimann A, et al. Evaluation of cardiac function and myocardial viability with 16- and 64-slice multidetector computed tomography. Eur Radiol. 2005;15(Suppl 4):D15–20. doi: 10.1007/s10406-005-0133-6. [DOI] [PubMed] [Google Scholar]
- 2.Dewey M, Müller M, Teige F, et al. Multisegment and halfscan reconstruction of 16-slice computed tomography for assessment of regional and global left ventricular myocardial function. Invest Radiol. 2006;41:400–9. doi: 10.1097/01.rli.0000201233.42994.9b. [DOI] [PubMed] [Google Scholar]
- 3.Lawson MA, Blackwell GG, Davis ND, Roney M, Dell’Italia LJ, Pohost GM. Accuracy of biplane long-axis left ventricular volume determined by cine magnetic resonance imaging in patients with regional and global dysfunction. Am J Cardiol. 1996;77:1098–104. doi: 10.1016/s0002-9149(96)00140-3. [DOI] [PubMed] [Google Scholar]
- 4.Belge B, Coche E, Pasquet A, Vanoverschelde JL, Gerber BL. Accurate estimation of global and regional cardiac function by retrospectively gated multidetector row computed tomography: Comparison with cine magnetic resonance imaging. Eur Radiol. 2006;16:1424–33. doi: 10.1007/s00330-006-0169-6. [DOI] [PubMed] [Google Scholar]
- 5.Ghersin E, Litmanovich D, Dragu R, et al. 16-MDCT coronary angiography versus invasive coronary angiography in acute chest pain syndrome: A blinded prospective study. AJR Am J Roentgenol. 2006;186:177–84. doi: 10.2214/AJR.04.1232. [DOI] [PubMed] [Google Scholar]
- 6.Manzke R, Grass M, Nielsen T, Shechter G, Hawkes D. Adaptive temporal resolution optimization in helical cardiac cone beam CT reconstruction. Med Phys. 2003;30:3072–80. doi: 10.1118/1.1624756. [DOI] [PubMed] [Google Scholar]
- 7.Vembar M, Garcia MJ, Heuscher DJ, et al. A dynamic approach to identifying desired physiological phases for cardiac imaging using multislice spiral CT. Med Phys. 2003;30:1683–93. doi: 10.1118/1.1582812. [DOI] [PubMed] [Google Scholar]
- 8.Lessick J, Mutlak D, Rispler S, et al. Comparison of multidetector computed tomography versus echocardiography for assessing regional left ventricular function. Am J Cardiol. 2005;96:1011–5. doi: 10.1016/j.amjcard.2005.05.062. [DOI] [PubMed] [Google Scholar]
- 9.Dodge HT, Sandler H, Ballew DW, Lord JD., Jr The use of biplane angiocardigraphy for the measurement of left ventricular volume in man. Am Heart J. 1960;60:762–76. doi: 10.1016/0002-8703(60)90359-8. [DOI] [PubMed] [Google Scholar]
- 10.Bland JM, Altman DG. Statistical methods for assessing agreement between two methods of clinical measurement. Lancet. 1986;1:307–10. [PubMed] [Google Scholar]
- 11.Hundt W, Siebert K, Wintersperger BJ, et al. Assessment of global left ventricular function: comparison of cardiac multidetector-row computed tomography with angiocardiography. J Comput Assist Tomogr. 2005;29:373–81. doi: 10.1097/01.rct.0000160426.41014.b1. [DOI] [PubMed] [Google Scholar]
- 12.Heuschmid M, Rothfuss JK, Schroeder S, et al. Assessment of left ventricular myocardial function using 16-slice multidetector-row computed tomography: Comparison with magnetic resonance imaging and echocardiography. Eur Radiol. 2006;16:551–9. doi: 10.1007/s00330-005-0015-2. [DOI] [PubMed] [Google Scholar]
- 13.Yamamuro M, Tadamura E, Kubo S, et al. Cardiac functional analysis with multi-detector row CT and segmental reconstruction algorithm: Comparison with echocardiography, SPECT, and MR imaging. Radiology. 2005;234:381–90. doi: 10.1148/radiol.2342031271. [DOI] [PubMed] [Google Scholar]
- 14.Mühlenbruch G, Das M, Hohl C, et al. Global left ventricular function in cardiac CT. Evaluation of an automated 3D region-growing segmentation algorithm. Eur Radiol. 2006;16:1117–23. doi: 10.1007/s00330-005-0079-z. [DOI] [PubMed] [Google Scholar]


