Abstract
Rationale: Markers of inflammatory activity are important for assessment and management of many respiratory diseases. Markers that are currently unrecognized may be more valuable than those presently believed to be useful.
Objectives: To identify potential biomarkers of suppurative and inflammatory lung disease in induced sputum samples.
Methods: Induced sputum was collected from 20 healthy control subjects, 24 patients with asthma, 24 with chronic obstructive pulmonary disease, 28 with cystic fibrosis (CF), and 19 with bronchiectasis. Twelve patients with CF had sputum sampled before and after antibiotic therapy for an infective exacerbation. The fluid phase of induced sputum was analyzed by surface-enhanced laser desorption/ionization time-of-flight (SELDI-TOF) mass spectroscopy on three protein array surfaces. Some protein markers were selected for identification, and relevant ELISA assays sought. For 12 patients with CF, both SELDI-TOF and ELISA monitored changes in inflammatory responses during infective exacerbations.
Measurements and Main Results: SELDI-TOF identified potential biomarkers that differentiated each of the disease groups from healthy control subjects: at a significance of P < 0.01, there were 105 for asthma, 113 for chronic obstructive pulmonary disease, 381 for CF, and 377 for bronchiectasis. Peaks selected for protein identification yielded calgranulin A, calgranulin B, calgranulin C, Clara cell secretory protein, lysosyme c, proline rich salivary peptide, cystatin s, and hemoglobin α. On treatment of an infective CF exacerbation, SELDI-TOF determined falls in levels of calgranulin A and calgranulin B that were mirrored by ELISA-measured falls in calprotectin (heterodimer of calgranulins A and B).
Conclusions: Proteomic screening of sputum yields potential biomarkers of inflammation. The early development of a clinically relevant assay from such data is demonstrated.
Keywords: biomarkers, calprotectin, cystic fibrosis
AT A GLANCE COMMENTARY
Scientific Knowledge on the Subject
Induced sputum cytology has been used to investigate a number of respiratory diseases, including asthma. The fluid phase is less well characterized and likely to contain undiscovered biomarkers that may be used to monitor disease.
What This Study Adds to the Field
High-throughput mass spectrometry identifies key biomarkers in sputum, allowing quantitative measurement with immunoassay, and potential development of new clinically applicable tests of inflammation in lung disease.
Although there is considerable clinical and research need for good assessment of inflammation in airway diseases, the requirement of relatively invasive procedures, such as bronchoscopy and bronchoalveolar lavage (BAL), precludes sampling from a wide range of patients and on repeated occasions. This has encouraged investigators to use techniques of exhaled gases and exhaled breath condensate (EBC) analysis, although there may be limitations of value (1–10). The cellular phase of induced sputum is helpful in evaluating and monitoring asthma (11), but its use in suppurative lung diseases such as cystic fibrosis (CF) is less clear, although in children induced sputum measurements have been shown to correlate with lung function (12). The fluid phase of sputum has been rather underutilized; however, potential problems of variability in noncellular material may be encountered and as yet there is no agreed-upon correction factor as in BAL sampling.
Surface-enhanced laser desorption/ionization time-of-flight (SELDI-TOF) technology has been used to discover biomarkers of disease groups in direct comparison to control groups. The primary focus of much of this research has been to determine diagnostic biomarkers in a wide range of diseases, such as rheumatoid arthritis, HIV infection (13), prostate cancer (14), ovarian cancer (15, 16), motor neurone disease (17), ischemic heart disease (18), and infectious diseases (19, 20), using a diverse range of body fluids, such as serum, urine, cerebrospinal fluid, and joint fluid. The generated protein profiles demonstrate differences between disease groups and individual proteins may be identified to act as biomarkers either alone or in tandem with others. SELDI-TOF data may be used to generate serum “protein fingerprints” using bioinformatics to provide a potential diagnostic test in cancer and infectious diseases (15, 19, 20). This approach relies on interpretation of mass spectral patterns rather than identifying individual proteins and has been widely criticized in the literature and, in some cases, such as the work of Petricoin and colleagues (15), analysis of data sets independently have led to completely different conclusions (21). Baggerly and coworkers (21) demonstrated that inconsistent data processing can alter the ultimate outcome of these sorts of experiments. A different, and more direct, approach is to identify the actual proteins responsible for the mass spectral peaks provided by mass spectrometry (MS) data. Indeed, the identification of key biomarkers after initial proteomic studies may provide a more viable route to clinical application (22) and furthermore may allow the functional importance of such markers to be investigated. Therefore, using SELDI-TOF as a screening tool to identify individual potential biomarkers for further characterization may be a more valid and robust approach. SELDI-TOF has been applied to a small number of patients with chronic obstructive pulmonary disease (COPD) demonstrating a protein profile in BAL (23), and in pulmonary sarcoidosis (24). SELDI-TOF has been used to demonstrate protein expression in BAL in CF (25, 26). There is as yet a lack of published data using SELDI-TOF to profile sputum, although complementary proteomic approaches of two-dimensional electrophoresis (27), shotgun protein sequencing (28), and affinity immunoproteomics (29) have been applied to sputum in an effort to discover new biomarkers.
We applied SELDI-TOF to induced sputum from patients with inflammatory (asthma, COPD) and suppurative (CF, bronchiectasis) airway diseases to determine whether a high-throughput proteomics screening method can reveal differential protein expression between disease groups and therefore candidate biomarkers, which may then be developed into point assays of inflammation with potential application in the clinic. This work was driven by the need to develop biomarkers to monitor suppurative lung disease, in particular CF.
METHODS
Subjects and Selection
The Lothian Ethics Committee (Edinburgh, UK) granted ethical approval and all participants gave written consent. Sputum was obtained from 28 patients with CF, 19 with bronchiectasis, 24 with asthma, 24 with COPD, and 20 healthy control subjects. All patients were clinically stable and recruited from the outpatient clinic of a respiratory medicine unit. All subjects were recruited from specialist respiratory clinics at a major teaching hospital where they were attending with a diagnosis of their respective illness. In the absence of preexisting data on intersubject variability, formal statistical powering was not possible, but we approached this problem by recruiting similar numbers of subjects to previous biomarker studies. The patient groups represented respiratory diseases with clinical features that both complement and contrast with each other.
Longitudinal Data
To determine the usefulness of discovered markers in the assessment of lung disease during a changing level of inflammation, longitudinal samples were collected from 12 patients with CF during an infective exacerbation. Samples were collected at onset and completion of intravenous antibiotic therapy (duration, 14–21 d). The biomarkers were assessed both by SELDI-TOF and by ELISA.
Induced Sputum
Sputum induction was performed as previously described (30). Subjects inhaled nebulized hypertonic saline at concentrations of 3, 4, and 5%. Sputum was processed within 2 hours of collection (31). Sputum plugs were selected and processed with 4 × weight/volume of 0.1% dithiothreitol after which 4 × weight/volume of phosphate-buffered saline was added. Samples were filtered through 48-μm mesh and centrifuged to remove the cells. Supernatants were stored at −80°C until further analysis. Cytospins were stained with May-Grunwald-Giemsa for differential cell counting.
SELDI-TOF MS
Three different chromatographic chip surfaces were used to cover a wide range of protein characteristics: a weak cation exchange at pH 4 (CM10), an anion exchange at pH 10 (Q10), and an immobilized metal affinity surface activated with nickel (IMAC nickel [IMACNi]). Induced sputum samples were adjusted to contain 1 mg/ml protein at a concentration of 0.1% dithiothreitol. Ten microliters of sample were added to CM10 and Q10 surfaces in a bioprocessor unit (Ciphergen, Freemont, CA) and 1 μl of sample was added to the preactivated IMACNi surface for on-spot incubation (more reproducible for IMACNi surfaces). All chips were treated with sinapinic acid (SPA) matrix (2 × 0.8 μl/spot) and allowed to air dry. Samples were analyzed on the Protein Biology System 2 SELDI-TOF mass spectrometer (Ciphergen). Chips were read with a laser intensity of 205 with the deflector set at 4,000 D and a focus mass of 7,500 D. Profiles were then exported to Ciphergen Express (Ciphergen) for clustering and data analysis. Intra- and interassay coefficients of variation were assessed with the CM10 surface as outlined in the online supplement.
Data Analysis
Data were normalized to total ion current to take into account any spot to spot variability in chip surface binding. Data with high normalization coefficients were identified and individual spectra examined. Poor-quality spectra or absent signal were excluded from further analysis. Protein peaks were automatically clustered to identify biomarkers of similar molecular weight. Mann-Whitney rank testing was performed to demonstrate statistical differences in clusters between disease groups. Values of P < 0.01 were taken to be significant. For longitudinal data, paired t test analysis was performed using Prism 4 software (GraphPad, San Diego, CA). For a further description of methods, please refer to the online supplement.
Protein Identification
Highly significant peaks (P < 0.0001), assessed on relative abundance and quality of original spectral data, were selected for protein identification. Pooled sputum was used. Samples were applied to 18% trisene/glycine acrylimide gel for electrophoresis. Bands of appropriate molecular weight were excised and destained and the protein eluted. The eluate was digested with proteomics grade trypsin (Sigma, Gillingham, UK), applied to a normal-phase chromatography chip surface and analyzed with SELDI-TOF MS or MALDI (matrix-assisted laser desorption/ionization)-TOF MS using a Voyager DE STR mass spectrometer (Applied Biosystems, Foster City, CA). The resultant mass fingerprint was used to identify the parent protein through reference to protein identification databases (MS-Fit; University of California, San Francisco, San Francisco, CA). Proteins were identified based on molecular weight search (MOWSE) score and cross-checked with online MASCOT (http://www.matrixscience.com), which allows a probability-based MOWSE score. Protein identification was only accepted when P values were less than 0.05. Tandem MS/MS analysis was performed to confirm identification of proteins using a Q-star tandem MS instrument (Applied Biosystems) with SELDI chip interface (Ciphergen). This approach provided additional protein identification based on amino acid sequence from the MS/MS analysis.
Commercial antibodies, when available, were used for protein confirmation by Western blotting. For calgranulins A and B, we were also able to use an in-house quantitative immunoassay measuring calprotectin (calgranulin A/B complex). An in-house double antibody sandwich ELISA (antibodies and calprotectin standard courtesy of E. Sundrehagen, M.D.) was developed for use in the 12 patients with CF monitored longitudinally, and results compared with data from SELDI-TOF.
RESULTS
Demographics
Patient demographics are given in Table 1. Of the patients with CF, 18 were chronically infected with Pseudomonas aeruginosa.
TABLE 1.
DEMOGRAPHIC, LUNG FUNCTION, AND SPUTUM NEUTROPHIL DATA OF THE PATIENTS STUDIED
| Group | Age (yr) | Sex | FEV1 (% pred) | Sputum Neutrophil (%) |
|---|---|---|---|---|
| Asthma | 47.8 (2.9) | 15 F/8 M | 82.3 (4.4) | 50.6 (5.0) |
| COPD | 65.2 (1.2) | 10 F/14 M | 57.7 (4.1) | 79.1 (2.7) |
| Bronchiectasis | 61.8 (3.5) | 15 F/3 M | 71.7 (11.6) | 83.2 (5.6) |
| CF | 28.8 (1.7) | 8 F/19 M | 59.2 (3.9) | 91.6 (2.0) |
| Control | 36.4 (2.1) | 11 F/9 M | 101.4 (3.1) | 54.2 (5.3) |
Definition of abbreviations: CF = cystic fibrosis; COPD = chronic obstructive pulmonary disease; F = females; M = males.
Values are mean (SEM).
Reproducibility of SELDI-TOF Assay in Sputum
This was assessed as described in the online supplement. The intraassay coefficient of variation ranged from 11.5 to 44% with an average coefficient of variation (CV) of 22.4%. Interassay variation demonstrated a CV ranging from 6 to 43%, with an average CV of 16.2%.
Protein Profiles Generated by SELDI-TOF
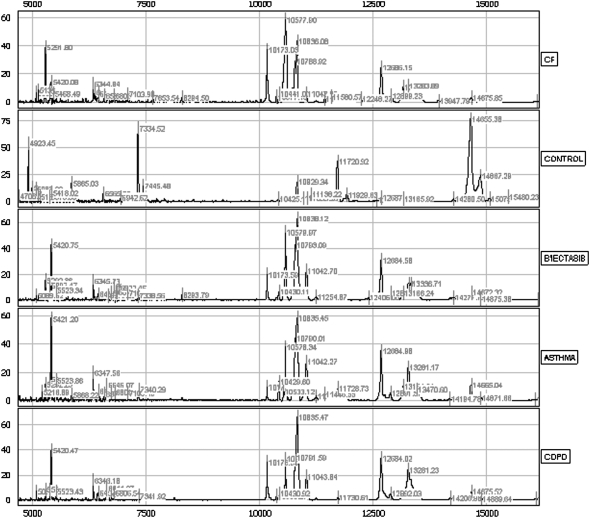
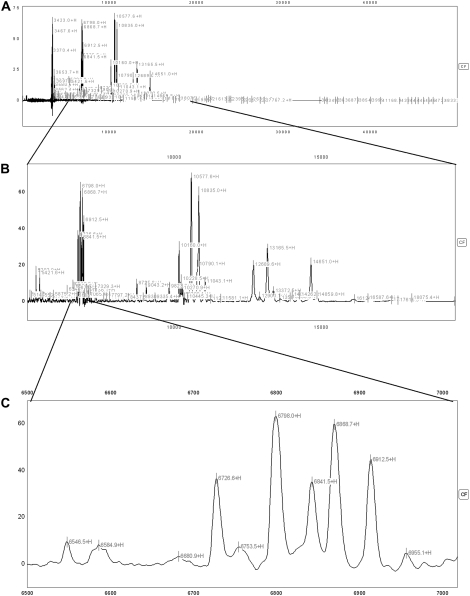
An example of generated data is demonstrated in Figures 1 and 2. Cluster analyses determined a large number of peaks present in relative proportions that differentiated between disease groups and healthy controls (Table 2). Three chip surfaces yielded a total of 621 clustered protein peaks, 105 of those significantly different at P < 0.01 and 56 at P < 0.001 for asthma versus healthy controls. For COPD compared with healthy controls, the respective figures were 625 protein peaks, with 113 significant at P < 0.01 and 50 at P < 0.001 for three surfaces. For bronchiectasis versus healthy controls, the respective figures were 671 protein peaks, with 377 significant at P < 0.01 and 314 at P < 0.001 for three surfaces. For the CF group, the respective figures were 660 protein peaks, with 381 significant at P < 0.01 and 315 at P < 0.001 for three surfaces (Table 2; for full summary, see Table E1 in the online supplement).
Figure 1.
This figure demonstrates spectra from individual subjects on the immobilized metal affinity chromatography (IMAC) nickel surface in the mass range of 5 to 15 kD. Even in this mass range, there is an abundance of peptide peaks, and noticeable differences are observed between groups. B'iectasis = bronchiectasis; CF = cystic fibrosis; COPD = chronic obstructive pulmonary disease.
Figure 2.
This figure demonstrates spectra from an individual with cystic fibrosis (CF) on the CM10 (cationic exchange) surface shown at different magnifications demonstrating the abundance of peaks in an individual sample. (A) demonstrates the entire spectrum (3,000–50,000 D); each label (most of which cannot be discerned individually at this magnification) represents a peak with signal-to-noise ratio of more than 3. (B) demonstrates some magnification to cover the spectrum from 5,000 to 20,000 D; again, most of the individual labels cannot be seen clearly at this magnification. (C) demonstrates magnified spectrum from 6,500 to 7,000 D, and at this level the individual peaks can be easily discerned.
TABLE 2.
THE TOTAL NUMBER OF PEAKS DETECTED BY SELDI-TOF
| IMAC Nickel | Weak Cation Exchange (CM10) | Anion Exchange (Q10) | |
|---|---|---|---|
| Asthma vs. control | 4 (n = 22 vs. 20) | 16 (n = 20 vs. 19) | 36 (n = 16 vs. 18) |
| COPD vs. control | 11 (n = 23 vs. 20) | 13 (n = 22 vs. 19) | 26 (n = 21 vs. 18) |
| CF vs. control | 108 (n = 28 vs. 19) | 111 (n = 22 vs. 19) | 96 (n = 22 vs. 19) |
| Bronchiectasis vs. control | 112 (n = 19 vs. 20) | 103 (n = 17 vs. 19) | 99 (n = 18 vs. 19) |
| CF vs. bronchiectasis | 19 (n = 28 vs.19) | 18 (n = 28 vs. 17) | 21 (n = 22 vs. 19) |
| Asthma vs. COPD | 10 (n = 23 vs. 22) | 5 (n = 21 vs. 20) | 1 (n = 21 vs. 25) |
Definition of abbreviations: CF = cystic fibrosis; COPD = chronic obstructive pulmonary disease; SELDI-TOF = surface-enhanced laser desorption/ionization time-of-flight.
Significantly different (P < 0.001) for disease versus control are shown. The two suppurative airway diseases, CF and bronchiectasis, and the two inflammatory airway diseases, asthma and COPD, were also compared in terms of numbers of differentiating proteins (P < 0.01). Proteins could be increased or decreased in their abundance. Spectra that failed normalization were excluded from analysis (see text). n = number of normalized spectra used in each analysis, as per order in table legend. The spectra failing to normalize were not the same for each analysis. The data are displayed for each of the three chip surfaces that were used in the study.
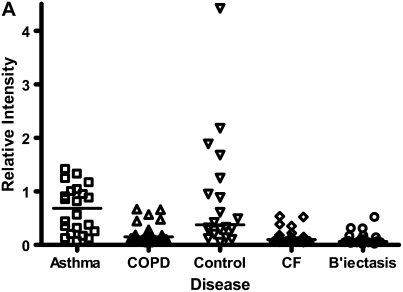
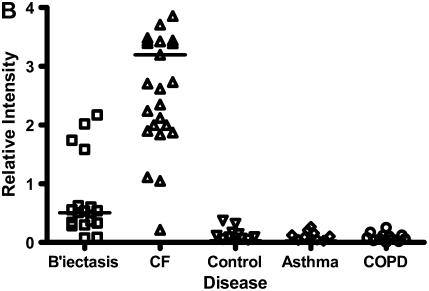
Although all four groups of patients yielded a substantial number of differential proteins compared with healthy control subjects, there were much closer similarities between the two obstructive airway diseases and between the two suppurative airway diseases. For asthma and COPD, only 16 proteins, on the three chip surfaces, were different at P < 0.01, and one protein was different at P < 0.001 (Table 2; Table E1). This latter protein, molecular weight (MW) 29 kD, was seen on the IMACNi surface (Figure 3A) but had low signal intensity. This marker has not yet been identified. CF and bronchiectasis demonstrated relatively similar biomarker profiles compared with each other, albeit the abundance of protein in the CF group was greater. Fifty-eight proteins differentiated the groups at P < 0.01 and 9 proteins differentiated the groups at P < 0.001 (Table 2; Table E1) over the three surfaces. Five of these nine proteins were observed on the IMACNi surface, two on CM10 and two on Q10. The marker that showed the greatest separation between the disease groups and had the highest signal intensity had an MW of 12.246 kD (Figure 3B). We have not identified this protein.
Figure 3.
(A) The protein that gave the statistically greatest differentiation between asthma and chronic obstructive pulmonary disease (COPD) (P < 0.001) had a MW of 29 kD, and was detected on the IMAC nickel (IMACNi) surface. The individual data and the median bars are shown. The data are for 22 patients with asthma and 23 patients with COPD (see explanation in footnote to Table 2). Other disease groups are demonstrated for comparison. (B) The protein that gave the statistically greatest differentiation between cystic fibrosis (CF) and bronchiectasis (B'iectasis) (P < 0.001) had an MW of 12.246 kD, and was detected on the IMACNi surface. The individual data and the median bars are shown. The data are for 28 patients with CF and 19 patients with bronchiectasis (see explanation in footnote to Table 2). Other disease groups are demonstrated for comparison.
The top 20 protein peaks that showed the most statistically significant differences between individual disease groups and healthy controls are shown in Table E2, indicating their molecular weight and the chip surface on which they were identified. There are common peaks found in asthma and COPD, and CF and bronchiectasis.
Biomarker Identification
The proteins we have formally identified from the induced sputum samples are calgranulin A, calgranulin B, calgranulin C, Clara cell secretory protein (CCSP, CC16, CCSP10, uteroglobin), lysosyme c, proline rich salivary peptide, cystatin s, and hemoglobin α (Table 3).
TABLE 3.
PROTEIN IDENTIFICATIONS CONFIRMED FROM PRESENT STUDY
| Protein | Molecular Weight (D) | Accession Number | Corresponding SELDI Peak (D) | Confirmed by PMF | Confirmed by MS/MS | Confirmed By Antibody | Direction of Change in Suppuration |
|---|---|---|---|---|---|---|---|
| Calgranulin A | 10,834 | P05109 | 10,834, 10,596 | Yes | Yes | Yes | Increased |
| Calgranulin B | 12,960 | P06702 | 12,960, 13,200 | Yes | Yes | Yes | Increased |
| Calgranulin C | 10,100 | P80511 | 10,100 | Yes | Yes | No | Increased |
| Clara cell secretory protein | 7,900 | P11684 | 7,900 | Yes | Yes | Yes | Decreased |
| Proline rich salivary peptide | 8,188 | P02814 | 8,119 | No | Yes | No | Decreased |
| Lysosyme C precursor | 16,537 | P61626 | 14,600 | Yes | Yes | No | No Change |
| Cystatin s | 16,204 | P01036 | 16,079 | No | Yes | No | No Change |
| hemoglobin alpha | 15,117 | P69905 | 15,080 | No | Yes | No | No Change |
Definition of abbreviations: PMF = peptide mass fingerprinting; SELDI = surface-enhanced laser desorption/ionization.
Proteins were identified by trypsin digest and PMF and well as tandem MS/MS. When available, antibodies were used to confirm protein identification by Western blot. Molecular weight refers to the theoretical molecular weight of each protein as derived from sequence. Corresponding SELDI peak refers to the protein peak seen on SELDI analysis of sputum fluid phase (differences in molecular weight may represent post-translational modifications).
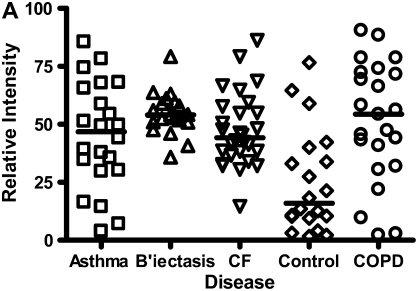
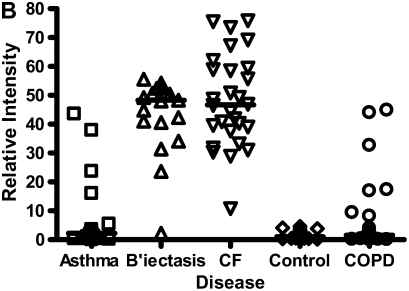
Calgranulins A, B, and C were highly abundant in CF and bronchiectasis, but were also seen in the other disease groups. These proteins are represented by mass spectral peaks at 10.831 kD, 12.700 kD, and 10.100 kD, respectively. These peaks were preferentially expressed on the IMACNi surface but were also bound to the weak cation exchange surface. Some binding of calgranulin A was also demonstrated on the anion exchange surface. A separate form of calgranulin A with a lower molecular weight (10.574 kD) was seen in the CF and bronchiectasis groups. This was identified by mass fingerprinting of both molecular weights after purification on sodium dodecyl sulfate–polyacrylamide gel electrophoresis (data not shown). The relative expression of calgranulin A across all groups is shown in Figure 4A and the relative expression of the smaller form of calgranulin A in Figure 4B. The presence of calgranulin A was confirmed with Western blotting in pooled sputum samples from all disease and control groups (Figure 4C).
Figure 4.
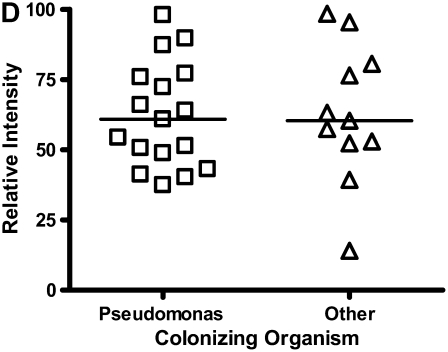
Calgranulin A in all disease groups: (A) shows the relative expression, on surface-enhanced laser desorption/ionization time-of-flight (SELDI-TOF), of the 10,831-D protein, which was elevated (P < 0.001) in all disease groups versus control; (B) shows the expression of the 10,576-D form of calgranulin A, which was specifically elevated in patients with cystic fibrosis (CF) and bronchiectasis (B'iectasis) (P < 0.001 vs. all other groups) (the data in A and B were obtained using the IMAC Nickel surface); (C) is a Western blot of calgranulin A. The blot represents the overall abundance of calgranulin A from both 10,834- and 10,576-D forms in the sample groups (lanes are labeled as Bl = blank, A = asthma; Br = bronchiectasis; CF = cystic fibrosis; Con = control; CO = COPD). Note the strong staining for CF and bronchiectasis groups and very weak staining in asthma. (D) demonstrates the effect of bacterial colonization on the signal intensity of the 10,576-D form of calgranulin A; the majority of patients were colonized with Pseudomonas aeruginosa (shown in the first column labeled “Pseudomonas”); other organisms included Staphylococcus aureus, Haemophilus, Stenotrophomonas, and Burkholderia (labeled “Other”).
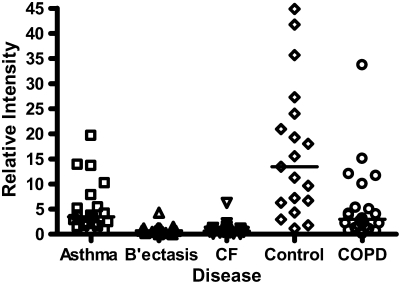
In contrast to the calgranulins, CCSP was in lower abundance in all disease groups compared with controls, but to the greatest extent in CF and bronchiectasis. This had a mass spectral peak of 7.900 kD on the CM10 surface. The relative expression of CCSP across all groups is shown on Figure 5. CCSP was confirmed on Western blot (data not shown).
Figure 5.
Clara cell secretory protein, molecular weight (MW) 7.9 kD, was in lower abundance for all disease groups compared with controls, but to the greatest extent in cystic fibrosis (CF) and bronchiectasis (B'ectasis). These data were obtained using the cation exchange (CM10) surface. The individual data and the median bars are shown. The data are for 20 patients with asthma, 17 with bronchiectasis, 22 with CF, 22 patients with chronic obstructive pulmonary disease (COPD), and 19 control subjects (see explanation in footnote to Table 2).
Correlation of Biomarkers with FEV1 and Sputum Cytology
In the CF group, the most abundant biomarker, calgranulin A, showed a weak inverse correlation with FEV1% predicted, which failed to reach statistical significance (Spearman r = 0.63, P = 0.08). There was no correlation of calgranulin A with the percentage of sputum neutrophils (data not shown).
Longitudinal Assessment of Identified Biomarker and Application of Specific ELISA
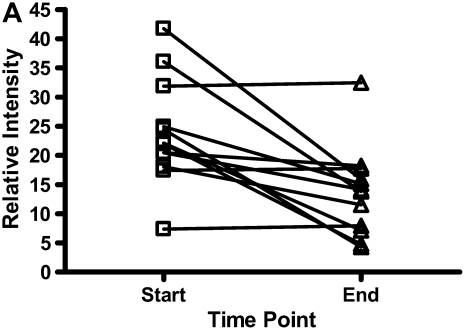
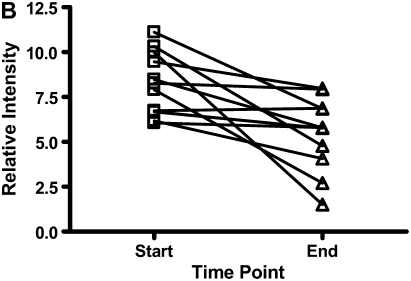
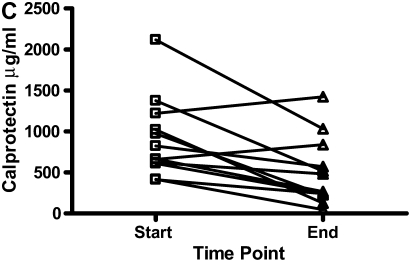
There were decreases in the levels of both calgranulin A and B, as assessed by SELDI-TOF, during treatment of an exacerbation of CF (Figures 6A and 6B; P < 0.01). Calprotectin (heterodimer of calgranulins A and B), measured by ELISA, similarly showed significant reduction (Figure 6C).
Figure 6.
The results for calgranulins A and B/calprotectin for 12 patients with cystic fibrosis are shown at the onset of an infective exacerbation and at the completion of antibiotic therapy, when there was a decrease (P < 0.01) of the proteins measured. (A) shows data for calgranulin A; (B) shows data for calgranulin B; (C) shows data for calprotectin measured by ELISA.
DISCUSSION
The use of SELDI-TOF MS has allowed us to generate sputum protein profiles of several diseases. We have shown there are substantial numbers of potential protein biomarkers that differentiate patients with inflammatory airway diseases from healthy subjects. We have proceeded to identify several of these candidate biomarkers and, using the example of calgranulins A and B, have demonstrated clinical relevance with longitudinal evaluation during altered disease activity. We have demonstrated that, having identified a biomarker by primary screening rather than empirical preselection, a standard assay, ELISA, can then be applied to the same clinical samples and deliver quantitative measures of the biomarker. Thus, screening with high-technology SELDI-TOF proteomics can be converted into clinically applicable measures.
Because this is the first study of its kind to investigate the proteomics of induced sputum using SELDI-TOF, we sought to determine the reproducibility of this assay. The average intraassay CV was 22.41% and average interassay CV was 16.25%. This compares well to published data for serum (intraassay CV of 15.6%, interassay variation of 24.4% [19], urine (intraassay CV, 8–30%) (32), and saliva (intraassay CV, 18%, and interassay CV, 31%) (33).
Previous studies have demonstrated the utility of SELDI-TOF in the diagnosis of illnesses in a range of body fluids. We used the fluid phase of sputum as a noninvasive means of assessing the airways. Although previous work has suggested a correlation of induced sputum with bronchial washings but not BAL (34), and therefore suggests that it reflects the pathophysiology of more central airways, induced sputum has been demonstrated useful in inflammatory respiratory diseases (11, 12, 35–46). Therefore, we would conclude that the proteomic assessment of induced sputum is a valid means of assessing airway disease.
As described previously, SELDI-TOF technology has been used as a technique in a number of inflammatory and neoplastic diseases, mainly using serum as a sampling medium. It was suggested as a diagnostic platform using bioinformatic algorithms to separate subjects with ovarian cancer from healthy control subjects (15). This initial approach, however, was widely criticized in the literature because the results were not reproducible when the same data sets were examined by independent investigators (21). Baggerly and colleagues (21) drew particular notice to the impact of different modes of data preparation after acquisition, such as baseline subtraction in some groups of data and not in others. They also suggested that inaccuracies in sample collection protocol and mass calibration could lead to misinformed results in these sorts of experiments. To ensure uniformity in this study, all data in our analysis underwent the same steps of preparation before analysis. We also ensured that all sample preparation was uniform as outlined in Methods and below. Mass calibration was performed before each experiment using protein and peptide standards (Ciphergen All in One protein and peptide standards; Ciphergen). Furthermore, the widely criticized Petricoin study also used mass spectral data at less than 1,000 D, a mass range at which the discrimination of genuine protein peaks from background noise may be difficult. Our approach of excluding data from below 4,000 D from analysis further strengthens the findings of this study. Other studies using SELDI-TOF as a diagnostic platform in infectious diseases using more robust sample collection and data preparation algorithms have proved more promising (19, 20). However, in this study, we used SELDI-TOF as a high-throughput screening platform for biomarker discovery rather than as a primary diagnostic assay. Although, on initial observation, our data demonstrate a large number of differentiating peaks when we look at the combined data set, the actual clinical significance of this observation is less clear and should be interpreted with caution.
Previous work by our group suggested an optimum mass range for respiratory biomarker discovery with this platform to be 3 to 20 kD (25). This may lead to biomarkers of a higher mass being ignored. Other proteomics methods, such as two-dimensional gel electrophoresis and immunocapture, may be better in assessing larger molecular weight proteins, and has been applied to CF (27, 29).
The largest numbers of differentiating proteins between disease and control were found in CF and bronchiectasis. This may suggest greater numbers of inflammatory and disease-related proteins in these groups or, alternatively, samples obtained from these groups had greater abundance of protein overall. Sputum samples obtained from subjects with CF and bronchiectatic subjects were of greater volume and better quality subjectively. However, selected mucus plugs were used for analysis and processed with equal ratios of buffer as previously described (46). Moreover, to ensure samples were comparable, supernatants were adjusted to a total protein concentration of 1 mg/ml before applying to chip surfaces. Also, mass spectral data were normalized to total ion current before data analysis, thus minimizing effects of possible variation in protein binding to chip surfaces. After normalization, samples were excluded because they had absent or very poor signals. We would therefore suggest that the differences expressed between groups represent real differences in protein expression rather than confounding due to issues of sample quality and abundance.
Our data revealed large numbers of potential biomarkers. The preset parameters we created may have limited the possible number. A lower limit cutoff of 4 kD may have been too harsh. Indeed, our spectra showed the human α defensins in all groups, but these were excluded from analysis because their average mass was less than 4 kD. Alternatively, we may have overestimated true numbers of differentiating markers because some proteins were detected on more than one chip surface. Also, a proportion of some proteins may be doubly protonated. Because the “time of flight” is related to both MW and charge, such proteins will appear “twice,” once with half the MW of the original protein. Furthermore, different peaks may represent cleavage products of the same (higher molecular weight) proteins and this may in part explain the high numbers of potential differentiating peaks we recorded, particularly when comparing our CF and bronchiectasis groups with control subjects.
Despite finding a large number of peaks differentiating CF and bronchiectasis from controls, we were surprised not to have identified any of these as known biomarkers of inflammation, such as IL-8 or neutrophil elastase. In our study, SELDI-TOF was most efficient at demonstrating peaks in the 5–20-kD range and this may in part explain these findings as the predicted molecular weights of neutrophil elastase is 29.5 kD (47). Furthermore, the chip surface chemistry and binding conditions may simply not have favored preferential selection of IL-8.
Despite the limitations in this technique, we found large numbers of potential biomarkers from which we have so far identified a modest number, although further identification of other peaks is ongoing. We used one of these biomarkers, calprotectin (calgranulin A and B), to show that it was possible to monitor disease activity and to apply an ELISA to the same clinical samples, obtaining the same results as with MS.
In all disease groups, we identified calgranulin A at higher levels than in control subjects. This S100 protein is produced by neutrophils, macrophages, and epithelial cells. In the CF and bronchiectasis groups, a protein at 10.574 kD was also identified as calgranulin A. Theoretical removal of glutamic acid and lysine from the N terminus of calgranulin A would result in an identical mass shift from 10.831 to 10.574 kD. Calgranulin 10.574 may therefore be the product of specific cleavage or post-translational modification in CF and bronchiectasis. Whether this finding may be of functional significance is as yet unclear. Calgranulins A and B have also been described recently in BAL fluid from subjects with CF (25, 26); a similar finding of a separate peak representing calgranulin A at a lower molecular weight was also described in BAL fluid by McMorran and colleagues (26).
Calgranulin has previously been described in the sera of subjects who were homo- and heterozygous for CF mutations and was referred to as CF antigen (48). Calgranulin A may provide a robust and sensitive marker of airway inflammation in CF. The likely source of calgranulin A is from neutrophils in the airway, although in this study we failed to demonstrate any significant correlation between neutrophil % in sputum and calgranulin A as measured by SELDI-TOF. This may in part be explained by the finding that the majority of the patients with CF had a profound neutrophilia in sputum in excess of 95%, regardless of other clinical details. Furthermore, there was a weak relationship between decreasing FEV1 and higher levels of calgranulin A, implying that calgranulin A may be a marker of disease severity in CF. We replicated our SELDI-TOF results using an ELISA to calprotectin, the heterodimer of calgranulins A and B. Thus, a more practical assay can be applied to induced sputum and yield the same clinical information. Calprotectin has previously been recognized as a marker in other inflammatory disorders, including inflammatory bowel disease and arthritis (49–51). Calgranulin C, another S100 protein, was also identified in our samples. This is in keeping with previous work demonstrating its presence in sputum and its potential usefulness as a biomarker in serum for CF (52).
A second abundant protein identified showed opposite effects to calgranulin A. CCSP was reduced in all disease groups compared with controls. CCSP is an antiinflammatory protein mainly expressed in the epithelial cells of the airways. Low serum levels have been reported in patients with asthma (53), and low nasal lavage levels in patients with allergic rhinitis (54). CCSP has a number of possible activities, including inhibition of phospholipase A2, chelation of calcium, and down-regulation of IFN-γ, IL-1, and tumor necrosis factor-α. Our findings are consistent with these previous studies, and raise the possibility that resolution of inflammatory processes might be monitored by rising levels of CCSP.
In conclusion, we have demonstrated the utility of SELDI-TOF MS as a tool for biomarker discovery in induced sputum. We have positively identified proteins of biological significance in the fluid phase of sputum. These proteins may form the basis of clinical point assays to assess the presence and activity of inflammation in a variety of lung diseases, with a particular emphasis being placed on disease monitoring.
Supplementary Material
Acknowledgments
The authors gratefully acknowledge the support of the Cystic Fibrosis Trust in their sponsorship of this study through the U.K. CF Gene Therapy Consortium. They thank Nathan Harris for his technical advice and support in the use of SELDI-TOF.
G.M. and A.C.B. were funded through the U.K. Cystic Fibrosis Gene Therapy Consortium. R.D.G. was supported by the Medical Research Council (program grant G9313618). D.N. was supported by an unrestricted Investigator Grant from GlaxoSmithKline.
This article has an online supplement, which is accessible from this issue's table of contents at www.atsjournals.org
Originally Published in Press as DOI: 10.1164/rccm.200703-409OC on June 19, 2008
Conflict of Interest Statement: None of the authors has a financial relationship with a commercial entity that has an interest in the subject of this manuscript.
References
- 1.Franklin PJ, Taplin R, Stick SM. A community study of exhaled nitric oxide in healthy children. Am J Respir Crit Care Med 1999;159:69–73. [DOI] [PubMed] [Google Scholar]
- 2.Ho LP, Innes JA, Greening AP. Exhaled nitric oxide is not elevated in the inflammatory airways diseases of cystic fibrosis and bronchiectasis. Eur Respir J 1998;12:1290–1294. [DOI] [PubMed] [Google Scholar]
- 3.Gaston B, Drazen JM, Loscalzo J, Stamler JS. The biology of nitrogen oxides in the airways. Am J Respir Crit Care Med 1994;149:538–551. [DOI] [PubMed] [Google Scholar]
- 4.Ho LP, Wood FT, Robson A, Innes JA, Greening AP. Atopy influences exhaled nitric oxide levels in adult asthmatics. Chest 2000;118:1327–1331. [DOI] [PubMed] [Google Scholar]
- 5.Horvath I, Hunt J, Barnes PJ, Alving K, Antczak A, Baraldi E, Becher G, van Beurden WJ, Corradi M, Dekhuijzen R, et al. Exhaled breath condensate: methodological recommendations and unresolved questions. Eur Respir J 2005;26:523–548. [DOI] [PubMed] [Google Scholar]
- 6.Hunt JF, Fang K, Malik R, Snyder A, Malhotra N, Platts-Mills TA, Gaston B. Endogenous airway acidification: implications for asthma pathophysiology. Am J Respir Crit Care Med 2000;161:694–699. [DOI] [PubMed] [Google Scholar]
- 7.Kharitonov SA, Yates D, Robbins RA, Logan-Sinclair R, Shinebourne EA, Barnes PJ. Increased nitric oxide in exhaled air of asthmatic patients. Lancet 1994;343:133–135. [DOI] [PubMed] [Google Scholar]
- 8.Rutgers SR, van der Mark TW, Coers W, Moshage H, Timens W, Kauffman HF, Koeter GH, Postma DS. Markers of nitric oxide metabolism in sputum and exhaled air are not increased in chronic obstructive pulmonary disease. Thorax 1999;54:576–580. [DOI] [PMC free article] [PubMed] [Google Scholar]
- 9.Smith AD, Cowan JO, Brassett KP, Herbison GP, Taylor DR. Use of exhaled nitric oxide measurements to guide treatment in chronic asthma. N Engl J Med 2005;352:2163–2173. [DOI] [PubMed] [Google Scholar]
- 10.Tate S, MacGregor G, Davis M, Innes JA, Greening AP. Airways in cystic fibrosis are acidified: detection by exhaled breath condensate. Thorax 2002;57:926–929. [DOI] [PMC free article] [PubMed] [Google Scholar]
- 11.Green RH, Brightling CE, McKenna S, Hargadon B, Parker D, Bradding P, Wardlaw AJ, Pavord ID. Asthma exacerbations and sputum eosinophil counts: a randomised controlled trial. Lancet 2002;360:1715–1721. [DOI] [PubMed] [Google Scholar]
- 12.Sagel SD, Sontag MK, Wagener JS, Kapsner RK, Osberg I, Accurso FJ. Induced sputum inflammatory measures correlate with lung function in children with cystic fibrosis. J Pediatr 2002;141:811–817. [DOI] [PubMed] [Google Scholar]
- 13.Zhang L, Yu W, He T, Yu J, Caffrey RE, Dalmasso EA, Fu S, Pham T, Mei J, Ho JJ, et al. Contribution of human alpha-defensin 1, 2, and 3 to the anti-HIV-1 activity of CD8 antiviral factor. Science 2002;298:995–1000. [DOI] [PubMed] [Google Scholar]
- 14.Xiao Z, Adam BL, Cazares LH, Clements MA, Davis JW, Schellhammer PF, Dalmasso EA, Wright GL Jr. Quantitation of serum prostate-specific membrane antigen by a novel protein biochip immunoassay discriminates benign from malignant prostate disease. Cancer Res 2001;61:6029–6033. [PubMed] [Google Scholar]
- 15.Petricoin EF, Ardekani AM, Hitt BA, Levine PJ, Fusaro VA, Steinberg SM, Mills GB, Simone C, Fishman DA, Kohn EC, et al. Use of proteomic patterns in serum to identify ovarian cancer. Lancet 2002;359:572–577. [DOI] [PubMed] [Google Scholar]
- 16.Kozak KR, Su F, Whitelegge JP, Faull K, Reddy S, Farias-Eisner R. Characterization of serum biomarkers for detection of early stage ovarian cancer. Proteomics 2005;5:4589–4596. [DOI] [PubMed] [Google Scholar]
- 17.Ranganathan S, Williams E, Ganchev P, Gopalakrishnan V, Lacomis D, Urbinelli L, Newhall K, Cudkowicz ME, Brown RH Jr, Bowser R. Proteomic profiling of cerebrospinal fluid identifies biomarkers for amyotrophic lateral sclerosis. J Neurochem 2005;95:1461–1471. [DOI] [PMC free article] [PubMed] [Google Scholar]
- 18.Peronnet E, Becquart L, Poirier F, Cubizolles M, Choquet-Kastylevsky G, Jolivet-Reynaud C. SELDI-TOF MS analysis of the cardiac troponin I forms present in plasma from patients with myocardial infarction. Proteomics 2006;6:6288–6299. [DOI] [PubMed] [Google Scholar]
- 19.Agranoff D, Fernandez-Reyes D, Papadopoulos MC, Rojas SA, Herbster M, Loosemore A, Tarelli E, Sheldon J, Schwenk A, Pollok R, et al. Identification of diagnostic markers for tuberculosis by proteomic fingerprinting of serum. Lancet 2006;368:1012–1021. [DOI] [PMC free article] [PubMed] [Google Scholar]
- 20.Papadopoulos MC, Abel PM, Agranoff D, Stich A, Tarelli E, Bell BA, Planche T, Loosemore A, Saadoun S, Wilkins P, et al. A novel and accurate diagnostic test for human African trypanosomiasis. Lancet 2004;363:1358–1363. [DOI] [PubMed] [Google Scholar]
- 21.Baggerly KA, Morris JS, Coombes KR. Reproducibility of SELDI-TOF protein patterns in serum: comparing datasets from different experiments. Bioinformatics 2004;20:777–785. [DOI] [PubMed] [Google Scholar]
- 22.White MY, Gundry RL, Cordwell SJ. When does a fingerprint constitute a diagnostic? Lancet 2006;368:971–973. [DOI] [PubMed] [Google Scholar]
- 23.Merkel D, Rist W, Seither P, Weith A, Lenter MC. Proteomic study of human bronchoalveolar lavage fluids from smokers with chronic obstructive pulmonary disease by combining surface-enhanced laser desorption/ionization-mass spectrometry profiling with mass spectrometric protein identification. Proteomics 2005;5:2972–2980. [DOI] [PubMed] [Google Scholar]
- 24.Kriegova E, Melle C, Kolek V, Hutyrova B, Mrazek F, Bleul A, du Bois RM, von Eggeling F, Petrek M. Protein profiles of bronchoalveolar lavage fluid from patients with pulmonary sarcoidosis. Am J Respir Crit Care Med 2006;173:1145–1154. [DOI] [PubMed] [Google Scholar]
- 25.Macgregor G, Gray RD, Hilliard TN, Imrie M, Boyd AC, Alton EW, Bush A, Davies JC, Innes JA, Porteous DJ, et al. Biomarkers for cystic fibrosis lung disease: application of SELDI-TOF mass spectrometry to BAL fluid [in press]. J Cyst Fibros 2008. [DOI] [PubMed]
- 26.McMorran BJ, Patat SA, Carlin JB, Grimwood K, Jones A, Armstrong DS, Galati JC, Cooper PJ, Byrnes CA, Francis PW, et al. Novel neutrophil-derived proteins in bronchoalveolar lavage fluid indicate an exaggerated inflammatory response in pediatric cystic fibrosis patients. Clin Chem 2007;53:1782–1791. [DOI] [PubMed] [Google Scholar]
- 27.Sloane AJ, Lindner RA, Prasad SS, Sebastian LT, Pedersen SK, Robinson M, Bye PT, Nielson DW, Harry JL. Proteomic analysis of sputum from adults and children with cystic fibrosis and from control subjects. Am J Respir Crit Care Med 2005;172:1416–1426. [DOI] [PubMed] [Google Scholar]
- 28.Nicholas B, Skipp P, Mould R, Rennard S, Davies DE, O'Connor CD, Djukanovi R. Shotgun proteomic analysis of human-induced sputum. Proteomics 2006;6:4390–4401. [DOI] [PubMed] [Google Scholar]
- 29.Pedersen SK, Sloane AJ, Prasad SS, Sebastian LT, Lindner RA, Hsu M, Robinson M, Bye PT, Weinberger RP, Harry JL. An immunoproteomic approach for identification of clinical biomarkers for monitoring disease: application to cystic fibrosis. Mol Cell Proteomics 2005;4:1052–1060. [DOI] [PubMed] [Google Scholar]
- 30.Pizzichini E, Pizzichini MM, Efthimiadis A, Evans S, Morris MM, Squillace D, Gleich GJ, Dolovich J, Hargreave FE. Indices of airway inflammation in induced sputum: reproducibility and validity of cell and fluid-phase measurements. Am J Respir Crit Care Med 1996;154:308–317. [DOI] [PubMed] [Google Scholar]
- 31.Efthimiadis A, Spanevello A, Hamid Q, Kelly MM, Linden M, Louis R, Pizzichini MMM, Pizzichini E, Ronchi C, Van Overveld F, et al. Methods of sputum processing for cell counts, immunocytochemistry and in situ hybridisation. Eur Respir J 2002;20(37 Suppl):19S–23S. [DOI] [PubMed] [Google Scholar]
- 32.Schaub S, Wilkins J, Weiler T, Sangster K, Rush D, Nickerson P. Urine protein profiling with surface-enhanced laser-desorption/ionization time-of-flight mass spectrometry. Kidney Int 2004;65:323–332. [DOI] [PubMed] [Google Scholar]
- 33.Schipper R, Loof A, de Groot J, Harthoorn L, Dransfield E, van Heerde W. SELDI-TOF-MS of saliva: methodology and pre-treatment effects. J Chromatogr B Analyt Technol Biomed Life Sci 2007;847:45–53. [DOI] [PubMed] [Google Scholar]
- 34.Moodley YP, Krishnan V, Lalloo UG. Neutrophils in induced sputum arise from central airways. Eur Respir J 2000;15:36–40. [DOI] [PubMed] [Google Scholar]
- 35.Berry MA, Parker D, Neale N, Woodman L, Morgan A, Monk P, Bradding P, Wardlaw AJ, Pavord ID, Brightling CE. Sputum and bronchial submucosal IL-13 expression in asthma and eosinophilic bronchitis. J Allergy Clin Immunol 2004;114:1106–1109. [DOI] [PubMed] [Google Scholar]
- 36.Birring SS, Berry M, Brightling CE, Pavord ID. Eosinophilic bronchitis: clinical features, management and pathogenesis. Am J Respir Med 2003;2:169–173. [DOI] [PubMed] [Google Scholar]
- 37.Birring SS, Parker D, McKenna S, Hargadon B, Brightling CE, Pavord ID, Bradding P. Sputum eosinophilia in idiopathic pulmonary fibrosis. Inflamm Res 2005;54:51–56. [DOI] [PubMed] [Google Scholar]
- 38.Brightling CE. Clinical applications of induced sputum. Chest 2006;129:1344–1348. [DOI] [PubMed] [Google Scholar]
- 39.Brightling CE, McKenna S, Hargadon B, Birring S, Green R, Siva R, Berry M, Parker D, Monteiro W, Pavord ID, et al. Sputum eosinophilia and the short term response to inhaled mometasone in chronic obstructive pulmonary disease. Thorax 2005;60:193–198. [DOI] [PMC free article] [PubMed] [Google Scholar]
- 40.Brightling CE, Monteiro W, Ward R, Parker D, Morgan MD, Wardlaw AJ, Pavord ID. Sputum eosinophilia and short-term response to prednisolone in chronic obstructive pulmonary disease: a randomised controlled trial. Lancet 2000;356:1480–1485. [DOI] [PubMed] [Google Scholar]
- 41.Chalmers GW, Macleod KJ, Sriram S, Thomson LJ, McSharry C, Stack BH, Thomson NC. Sputum endothelin-1 is increased in cystic fibrosis and chronic obstructive pulmonary disease. Eur Respir J 1999;13:1288–1292. [DOI] [PubMed] [Google Scholar]
- 42.Demedts IK, Morel-Montero A, Lebecque S, Pacheco Y, Cataldo D, Joos GF, Pauwels RA, Brusselle GG. Elevated MMP-12 protein levels in induced sputum from COPD patients. Thorax 2006;61:196–201. [DOI] [PMC free article] [PubMed] [Google Scholar]
- 43.Green RH, Brightling CE, Woltmann G, Parker D, Wardlaw AJ, Pavord ID. Analysis of induced sputum in adults with asthma: identification of subgroup with isolated sputum neutrophilia and poor response to inhaled corticosteroids. Thorax 2002;57:875–879. [DOI] [PMC free article] [PubMed] [Google Scholar]
- 44.Hargreave FE, Leigh R. Induced sputum, eosinophilic bronchitis, and chronic obstructive pulmonary disease. Am J Respir Crit Care Med 1999;160:S53–S57. [DOI] [PubMed] [Google Scholar]
- 45.Pavord ID, Sterk PJ, Hargreave FE, Kips JC, Inman MD, Louis R, Pizzichini MM, Bel EH, Pin I, Grootendorst DC, et al. Clinical applications of assessment of airway inflammation using induced sputum. Eur Respir J Suppl 2002;37:40s–43s. [DOI] [PubMed] [Google Scholar]
- 46.Pin I, Gibson PG, Kolendowicz R, Girgis-Gabardo A, Denburg JA, Hargreave FE, Dolovich J. Use of induced sputum cell counts to investigate airway inflammation in asthma. Thorax 1992;47:25–29. [DOI] [PMC free article] [PubMed] [Google Scholar]
- 47.Sinha S, Watorek W, Karr S, Giles J, Bode W, Travis J. Primary structure of human neutrophil elastase. Proc Natl Acad Sci USA 1987;84:2228–2232. [DOI] [PMC free article] [PubMed] [Google Scholar]
- 48.van Heyningen V, Dorin J. Possible role for two calcium-binding proteins of the S-100 family, co-expressed in granulocytes and certain epithelia. Adv Exp Med Biol 1990;269:139–143. [DOI] [PubMed] [Google Scholar]
- 49.Colombo C, Costantini D, Rocchi A, Cariani L, Garlaschi ML, Tirelli S, Calori G, Copreni E, Conese M. Cytokine levels in sputum of cystic fibrosis patients before and after antibiotic therapy. Pediatr Pulmonol 2005;40:15–21. [DOI] [PubMed] [Google Scholar]
- 50.Schulze zur Wiesch A, Foell D, Frosch M, Vogl T, Sorg C, Roth J. Myeloid related proteins MRP8/MRP14 may predict disease flares in juvenile idiopathic arthritis. Clin Exp Rheumatol 2004;22:368–373. [PubMed] [Google Scholar]
- 51.Silberer H, Kuppers B, Mickisch O, Baniewicz W, Drescher M, Traber L, Kempf A, Schmidt-Gayk H. Fecal leukocyte proteins in inflammatory bowel disease and irritable bowel syndrome. Clin Lab (Zaragoza) 2005;51:117–126. [PubMed] [Google Scholar]
- 52.Foell D, Seeliger S, Vogl T, Koch HG, Maschek H, Harms E, Sorg C, Roth J. Expression of S100A12 (EN-RAGE) in cystic fibrosis. Thorax 2003;58:613–617. [DOI] [PMC free article] [PubMed] [Google Scholar]
- 53.Shijubo N, Itoh Y, Yamaguchi T, Sugaya F, Hirasawa M, Yamada T, Kawai T, Abe S. Serum levels of Clara cell 10-kDa protein are decreased in patients with asthma. Lung 1999;177:45–52. [DOI] [PubMed] [Google Scholar]
- 54.Johansson S, Keen C, Stahl A, Wennergren G, Benson M. Low levels of CC16 in nasal fluid of children with birch pollen-induced rhinitis. Allergy 2005;60:638–642. [DOI] [PubMed] [Google Scholar]
Associated Data
This section collects any data citations, data availability statements, or supplementary materials included in this article.


