

Abstract
The objective of this study was to determine the effects of ethanol injections on protein expression in the nucleus accumbens shell (ACB-sh) of alcohol-preferring (P), alcohol-non-preferring (NP) and Wistar (W) rats. Rats were injected for 5 consecutive days with either saline or 1 g/kg ethanol; 24 hr after the last injection, rats were killed and brains obtained. Micro-punch samples of the ACB-sh were homogenized; extracted proteins were subjected to trypsin digestion and analyzed with a liquid chromatography-mass spectrometer procedure. Ethanol changed expression levels (1.15-fold or higher) of 128 proteins in NP rats, 22 proteins in P, and 28 proteins in W rats. Few of the changes observed with ethanol treatment for NP rats were observed for P and W rats. Many of the changes occurred in calcium-calmodulin signaling systems, G-protein signaling systems, synaptic structure and histones. Approximately half the changes observed in the ACB-sh of P rats were also observed for W rats. Overall, the results indicate a unique response to ethanol of the ACB-sh of NP rats compared to P and W rats; this unique response may reflect changes in neuronal function in the ACB-sh that could contribute to the low alcohol drinking behavior of the NP line.
Keywords: alcohol-preferring rats, alcohol-non-preferring rats, nucleus accumbens shell, protein expression, proteomics, alcohol
1. Introduction
The alcohol-preferring (P) and –non-preferring (NP) rats were selectively bred for high and low alcohol-drinking behavior, respectively (Lumeng et al., 1977). There are innate neurobiological differences within the nucleus accumbens (ACB) between P and NP rats (reviewed in Bell et al., 2005; McBride and Li, 1998; Murphy et al., 2002). In addition, the P and NP rats differ in a number of behavioral measures (reviewed in McBride and Li, 1998; Murphy et al., 2002). With regard to responses to ethanol, NP rats are more sensitive than P rats to the motor impairing effects of moderate to high dose ethanol (Lumeng et al., 1982; Rodd et al. 2004). In contrast, P rats are sensitive to the low-dose stimulating effects of ethanol, whereas NP rats are not (Waller et al., 1986; Rodd et al., 2004). P rats develop tolerance to the high dose motor impairing effects of ethanol more readily than NP rats (Waller et al., 1983), and tolerance persists longer in the P than NP rat (Gatto et al., 1987). In another study, repeated intraperitoneal (i.p.) injections of 1 g/kg ethanol produced differential changes in dopamine and serotonin neurotransmission in the ACB of P, NP and Wistar (W) rats (Smith and Weiss 1999). In addition, using the oscillating bar task, NP rats were more sensitive than P rats to the motor impairing effects of 1 g/kg i.p. ethanol; with repeated ethanol injections, the performance of the NP rats on the oscillating bar task improved, suggesting the development of tolerance (Bell et al., 2001). Overall, these results suggested that ethanol exposure produced differential neuronal alterations in the CNS between P and NP rats.
The nucleus accumbens appears to be involved in mediating alcohol drinking behavior (reviewed in Koob et al., 1998; McBride and Li 1998). The studies of Smith and Weiss (1999) and Thielen et al., (2004) suggested that repeated ethanol injections or chronic ethanol drinking could produce alterations in monoamine neurotransmission within the ACB.
The effects of ethanol in the CNS are very complex and likely to produce a number of alterations at the cellular level. In order to better understand the complex actions of ethanol at both the behavioral and cellular level, it is important to have multiple experimental approaches. One approach is to study one system at a time with a well-defined and focused hypothesis. An alternative is to take a much broader approach, using genomics and proteomics tools to obtain more information, which could better define the effects of ethanol at multiple cellular and biological systems levels. There have been several studies that applied genomics (mainly) and proteomics analyses to examining the effects of ethanol in rodent models and post-mortem human tissue (Alexander-Kaufman et al., 2006, 2007; Bell et al., 2006; Flatscher-Bader et al., 2005; Kerns et al., 2005; Lewohl et al., 2000, 2004; Liu et al., 2004; Matsumoto et al., 2007; Mayfield et al., 2002; Rodd et al., 2008; Saito et al., 2002, 2004; Treadwell and Singh 2004). The studies conducted on post-mortem human tissue measured the consequences of long-term alcohol consumption and were aimed at regions where the neurotoxic effects of alcohol have been reported (Alexander-Kaufman 2006, 2007; Flatscher-Bader et al., 2005; Lewohl et al., 2000, 2004; Liu et al., 2004; Matsumoto et al., 2007; Mayfield et al., 2002). Several studies were conducted examining the effects of chronic forced ethanol drinking by mice and rats on changes in gene expression in whole brain or cerebral cortex (Saito et al., 2002, 2004; Treadwell and Singh 2004). A more recent study (Bell et al., 2006) examined the effects of chronic alcohol drinking by P rats on protein levels in the ACB and amygdala, using a 2-dimensional gel (2-DG) electrophoresis technique with mass spectrometry (MS). Although differences in protein levels were observed, this technique is relatively insensitive, and only the most abundant proteins were detected.
The objective of the present study was to use a sensitive liquid chromatography (LC)-MS procedure (Higgs et al., 2005) to determine the effects of repeated ethanol administration on protein expression in the ACB shell of P and NP rats. The ACB shell was selected because this region of the ACB is involved in mediating reinforcement, whereas the core portion does not appear to be involved in reinforcement processes (Ikemoto et al., 1997). The repeated ethanol injection procedure was used because this protocol has been shown to produce differential effects on monoamine neurotransmission in the ACB of P, NP and W rats (Smith and Weiss, 1999). In addition, the present experimental approach permitted changes in protein levels to be detected in a key limbic region of rats that exhibit disparate alcohol drinking characteristics. In the present study, it was important to include W rats for comparison purposes to help interpret differences between P and NP rats as being mainly due to unique responses to ethanol in the P line, or unique responses to ethanol in the NP line. The hypothesis to be tested is that ethanol will differentially alter the levels of proteins involved in synaptic function in the ACB-shell between P and NP rats.
2. Methods
Adult male P, NP and W rats (n = 20/strain), 90-100 days old at the time of the experiment, were used in this study. P and NP rats were from the 60th generation, and were obtained from breeding facilities on the Indiana University School of Medicine campus. P and NP rats were originally derived from an out-bred W stock at Walter Reed Army Institute of Research (Lumeng et al., 1977). W rats used in the present study were purchased from Harlan Industries (Indianapolis, IN). Animals were received in our facilities 3 weeks prior to the experiment. Rats were double housed on a reverse 12:12 light-dark cycle with lights off at 0900 hours. Rats had water and rat chow ad libitum. Animals were habituated to handling and injection procedures for 5 days prior to initiating the experiment. The animals used in these experiments were maintained in facilities fully accredited by the Association for the Assessment and Accreditation of Laboratory Animal Care (AAALAC). All research protocols were approved by the Institutional Animal Care and Use Committee and are in accordance with the guidelines of the Institutional Animal Care and Use Committee of the National Institute on Drug Abuse, NIH, and the Guide for the Care and Use of Laboratory Animals (Institute of Laboratory Animal Resources, Commission on Life Sciences, National Research Council 1996).
2.1. Experimental protocols
Using the protocol of Smith and Weiss (1999), 10 rats in each strain were injected i.p. with saline and 10 rats in each strain were injected with 1 g/kg ethanol once each day for 5 consecutive days; 24 hr after the last injection, rats were killed by decapitation, the brains quickly removed and frozen in isopentane in dry ice. Brains were stored at -70° C until sectioned. Two samples were lost during the sample analysis, i.e., one saline injected P rat and one ethanol injected W rat. Therefore, there were 10 samples in 4 of the 6 groups, and 9 samples in the remaining 2 groups.
On the day of preparation of micro-punch samples, brains were transferred to a cryostat set at -6 to -10° C at least 2 hr prior to sectioning. Sections (300 μm) were obtained and transferred to glass slides that had been pre-cooled in the cryostat. Micro-punch sampling was done on a frozen stage (-25 to -35° C) with an anatomic microscope equipped with a cool microscope lamp. Micropunch samples (0.77 mm dia.) were obtained bi-laterally; usually samples of the ACB-shell could be obtained from 2-3 sections from each rat. The stereotaxic atlas of Paxinos and Watson (1998) was used to identify the ACB-shell. After withdrawing the micro-punch sample, a distinct demarcated hole remained; this hole was used to validate the micro-dissection method. Two trained individuals independently verified the dissections. The micro-punched samples from the same animal were pooled and stored at -70° C until samples from all rats had been collected. Samples from one animal were not pooled with samples from another animal.
2.2. Proteomics procedure
A label-free LC/MS-based protein quantification method of Higgs et al. (2005) was used to determine relative changes in protein levels. A brief description of the procedure is given below; more detailed information can be obtained from the original article of Higgs et al. (2005).
Tissue samples from individual rats were homogenized in 1 M urea and 10 mM DTT. The resulting protein extracts were reduced and alkylated by volatile reagents triethyphosphine and iodoethanol, as previously described (Hale et al., 2004); the protein extract was then digested with trypsin. The volatile reduction and alkylation steps allow all sample preparation steps to be carried out in one tube, which minimizes variations in sample preparation. The total peptide concentration was determined before and after Trypsin digestion with the Bradford Protein Assay (Bradford 1976). Values were similar for both assays. The peptide determination after digestion was done to ensure similar amounts of each sample were injected onto the column.
Digested individual samples from the 6 groups were randomized for analysis to minimize technical artifacts. For each sample, 20 μg of the tryptic peptides were injected onto a C18 microbore column (i.d. = 1 mm; length = 5 cm). Peptides were eluted with a linear gradient from 5 to 45% acetonitrile over 120 min at a flow rate of 50 μl/min; the effluent was electro-sprayed into a LTQ linear ion-trap mass spectrometer (MS; Thermo-Finnigan).
The MS data were collected in the ‘Triple-Play” mode (MS scan, Zoom scan, and MS/MS scan). Each sample was analyzed with this approach; samples were injected only once. The acquired data were then filtered and analyzed by licensed software developed and described by Higgs et al. (2005). Searches against the IPI (International Protein Index) and the Non-Redundant (NCBI) databases were carried out using both the SEQUEST and X!Tandem algorithms.
Protein quantification was carried out as described by Higgs et al. (2005). Briefly, after the raw files were acquired from the LTQ, all extracted ion chromatograms (X!C) were aligned by retention time, using the algorithm and procedure described by Higgs et al. (2005). Each aligned peak must match precursor ion, charge state, fragment ions (MS/MS data), and retention time (within a three-minute window). After alignment, the area-under-the-curve (AUC) for each individually aligned peak from each sample was measured, normalized, and compared for relative abundance. Peak intensities were transformed to a log2 scale before quantile normalization (Bolstad et al., 2003). When multiple peptides had the same protein identification, their quantile normalized log2 intensities were averaged to obtain log2 protein intensities. The log2 protein intensity was used for the Linear Mixed Model statistical analysis for each protein. For each protein, estimates of individual p-values and q-values (measure of False Discovery Rate, FDR) were determined. Fold changes were computed as the ratio of mean treated/mean control.
Chicken lysozyme was added into every sample at a constant amount before tryptic digestion to serve as an internal standard for quality assurance and quality control (QA/QC) and assess stability of the LC column and MS instrument. After tryptic digestion, 9 chicken lysozyme peptides were quantified. The quantile normalized log2 intensities of the peptides were averaged to obtain the log2 protein intensity for chicken lysozyme in each sample. The log2 protein intensities for chicken lysozyme for each sample (n = 9, 10/group) underwent a group comparison. There were no significant differences among the 6 groups in the intensity of the internal standard, suggesting that there was good procedural stability across samples and that no technical artifacts were contributing to differences between groups.
2.3. Protein identification
Proteins identified by SEQUEST and X!Tandem were categorized into priority groups based upon the quality of the protein identification. Proteins with a best peptide confidence level of 99% or higher were assigned to priority 1 (two or more unique peptide sequences) or 2 (a single unique peptide sequence). Proteins with a best peptide confidence level of 75-89% were assigned to the ‘moderate’ category. Peptides with a confidence level less than 75% were filtered out from further analysis. SEQUEST and X!Tandem database search algorithms were used for peptide sequence identification. Each algorithm compares the observed peptide MS/MS spectrum and theoretically derived spectra from the database to assign quality scores. These quality scores and other important predictors were combined in the algorithm that assigns an overall % ID confidence level for each peptide; the assignment was based on a random forest recursive partition supervised learning algorithm (Higgs et al., 2005; 2007). The priority system was based upon the quality of the amino acid sequence identification and whether one or more sequences were identified. Only proteins with priority 1 (confidence level > 99% with 2 independent peptides) were included for further analysis in the present study.
2.4. Bioinformatics analyses
Protein ID numbers were used to obtain the corresponding Entrez-Gene identifier. Testing for over-representation of Gene Ontology (GO) (Harris et al. 2004; Ashburner et al. 2000) biologic process (BP) and molecular function (MF) categories was performed using the Bioconductor package GOstats (Gentleman 2004; Gentleman et al., 2004). Identification of over-represented GO categories was then accomplished within GOstats using the hypergeometric distribution. Categories, with 5 or more proteins, are listed. Categories were called significant for p < 0.05. Ingenuity® Pathways Analyses (Ingenuity, Inc. www.ingenuity.com) were conducted on proteins that were statistically significant. Ingenuity builds networks based upon information extracted from the scientific literature that is deposited in Ingenuity proprietary database. Network Eligible Molecules are combined into networks that maximize their interconnectedness with each other relative to all molecules they are connected to in the database.
3. Results
Figure 1 shows the total ion chromatogram (TIC) from the 1st, 30th and 58th injection to demonstrate that the overall quality of the chromatograms was maintained from the 1st to the 58th injection. Figure 2 shows the extracted ion chromatogram (XIC) for a single peptide from guanine nucleotide-binding protein G(i), alpha-1 subunit (Gnai1) to illustrate how the area under the curve (AUC) was determined for two different samples. Table 1 shows the normalized average AUC values for the 5 peptides used to quantify levels of Gnai1 in the 6 experimental groups.
Fig. 1.

Total ion chromatograms of the 1st, 30th and 58th injections illustrating that the high quality of the chromatograms did not diminish from the 1st to the 58th injection.
Fig. 2.
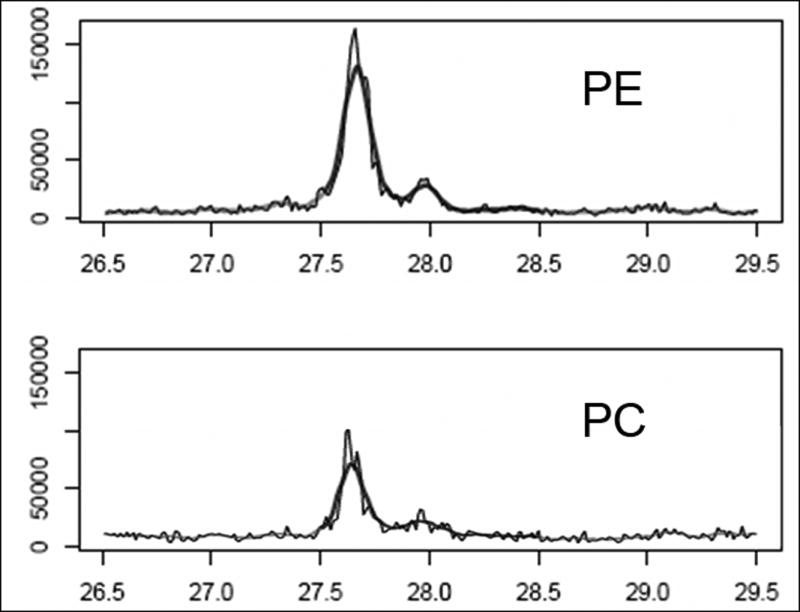
Extracted ion chromatogram for peptide EIYTHFTCATDTK from protein IPI002311733.6 (guanine nucleotide-binding protein Gi, alpha-1 subunit) showing the retention time in min along the X-axis and the intensity along the Y-axis. The heavy solid line represents the AUC for this peptide.
Table 1.
Normalized average area under the curve (AUC) values for each identified peptide for a single protein for the six experimental groups
| Protein Name | Peptides Identified | ID Confidence | Normalized Average AUC |
|---|---|---|---|
| Guanine nucleotide binding protein Gi, alpha-1 subunit (Gnai1) | LLLLGAGESGK | >99% | 32137(NC); 44318(NE); 31662(PC); 32245(PE); 31665(WC); 30949(WE) |
| EIYTHFTCATDTK | >99% | 16661(NC); 26018(NE); 15158(PC); 27247(PE); 20057(WC); 33736(WE) | |
| MFDVGGQR | >99% | 11895(NC); 13008(NE); 10822(PC); 14345(PE); 10979(WC); 13449(WE) | |
| IAQPNYIPTQQDVLR | 97.67% | 22307(NC); 26098(NE); 23441(PC); 27436(PE); 22270(WC); 23027(WE) | |
| DSGVQACFNR | >99% | 75407(NC); 78223(NE); 7152(PC); 7658(PE); 7035(WC); 7870(WE) | |
NC = saline treated NP rat; NE = ethanol treated NP rat; PC = saline treated P rat; PE = ethanol treated P rat; WC = saline treated Wistar rat; WE = ethanol treated Wistar rat
There were 875 proteins in category 1 (peptide ID confidence > 99%; with 2 independent peptides) that were identified in the ACB-shell samples of P, NP and W rats (see supplemental table A for complete list of category 1 proteins; see supplemental table B for list of all peptides that were used to identify each priority 1 protein). There were no significant differences in protein expression levels in the ACB-shell between the saline treated (control) P and NP rats. Comparison of the saline treated P and W rats yielded significant differences (q < 0.25; P < 0.015; fold change ≥ 1.15) in 2 proteins: fumarate hydratase mitochondrial precursor and fumarate hydratase-1. Both proteins had higher values in the ACB-shell of P than W rats. These same 2 proteins (and no others) also had higher expression levels in the ACB-shell of NP than W rats.
3.1. Effects of ethanol on protein levels in P rats
Repeated administration of ethanol significantly (p < 0.015; q-values < 0.25; fold change ≥ 1.15) altered the levels of 22 proteins in the ACB-shell of P rats (Table 2). Most of the changes were in the range of 1.15- to 1.25-fold, with approximately equal numbers of proteins with higher and lower levels in the ethanol-treated group. Neuronal guanine nucleotide exchange factor (Ngef) had the highest fold change (1.65 × higher in the ethanol treated group). GO analysis did not yield any significant biological processes (BP) or molecular function (MF) categories, containing at least 5 proteins.
Table 2.
Priority 1 (>99.9% confidence level) proteins that were significantly (p-values < 0.015; q-values < 0.25) different and changed by 15% or greater in the nucleus accumbens shell between the ethanol-injected (E) and control (C) alcohol-preferring (P) rats
| Protein_ID | Gene symbol | Annotation | PE/PC |
|---|---|---|---|
| IPI00207891.2 | 31_kDa protein | -1.17a | |
| IPI00562632.1 | 33_kDa_protein | 1.24b | |
| 15986733 | Rab4b | AF408432_1_GTP-binding_protein_RAB4_[Mus_musculus] | -1.20b |
| IPI00231118.4 | Calb1 | Calbindin | -1.17b |
| IPI00189995.1 | Calb2 | Calretinin | -1.24 |
| IPI00213015.1 | Dctn2 | Dynactin_2 | 1.18 |
| IPI00231733.6 | Gnai1 | Guanine_nucleotide-binding_protein_G(i),_alpha-1_subunit | 1.24a,b |
| 57829 | Nefh | heavy_neurofilament_polypeptide_(854_AA)_[Rattus sp.] | -1.17 |
| IPI00372709.3 | Igsf8 | immunoglobulin_superfamily,_member_8 | -1.18 |
| IPI00417225.1 | Synpo | Isoform_1_of_Synaptopodin | 1.16b |
| IPI00212566.3 | Syngap1 | Isoform_3_of_Ras_GTPase-activating_protein_SynGAP | -1.19 |
| 66857 | KIRTPR_pyruvate_kinase_(EC_2.7.1.40),_erythrocyte splice_form_R_-_rat | 1.23 | |
| IPI00471530.1 | Lap3 | Leucine_aminopeptidase_3 | 1.20 |
| IPI00231997.5 | Ndufa5 | NADH_dehydrogenase_[ubiquinone]_1_alpha_subcomplex subunit_5 | 1.17 |
| IPI00231641.4 | Pgm1 | Phosphoglucomutase-1 | 1.26a,b |
| IPI00369349.3 | Atp6v1e2 | PREDICTED:_similar_to_ATPase,_H+_transporting,_V1_subunit_E-like_2_isoform_2 | -1.15a |
| IPI00371946.3 | Marcks | PREDICTED:_similar_to_Myristoylated_alanine-rich_C-kinase_substrate | -1.37 |
| IPI00464820.4 | Ngef | PREDICTED:_similar_to_neuronal_guanine_nucleotide_exchange_factor | 1.65b |
| IPI00369480.3 | Otub1 | PREDICTED:_similar_to_OTU_domain,_ubiquitin_aldehyde_binding_1 | 1.24 |
| IPI00394488.2 | LOC498174 | Similar_to_NipSnap2_protein | 1.26b |
| IPI00201969.1 | Vat1 | Vesicle_amine_transport_protein_1_homolog | -1.15 |
| IPI00215349.3 | Wdr1 | WD_repeat_protein_1 | 1.18a,b |
PE/PC = fold change ethanol over control value; minus sign indicates that PC value was greater than PE value; n = 10 for PE and n = 9 for PC.
Similar ratio change found for NP rats;
similar ratio change observed for W rats. There were no values for PE/PC that changed in the opposite direction in NP or W rats.
Among the 22 proteins that were significantly different in the ACB-shell between the ethanol-treated and saline-treated P rats (Table 2), there were 5 proteins that were similarly changed in the ACB-shell of ethanol- and saline- treated NP rats (Table 3), and no proteins that changed in the opposite direction. There were 9 proteins that were similarly changed by ethanol treatment in the ACB-shell of P and W rats (Tables 1 and 4), of which 3 were also in common with NP rats (i.e., guanine nucleotide-binding protein G(i) alpha-1 subunit, phosphoglucomutase-1 and WD repeat protein 1). Therefore, it appears that ethanol altered the levels of 11 of 22 proteins uniquely in the ACB-shell of P rats.
Table 3.
Priority 1 (>99.9% confidence level) proteins that were significantly (p-values < 0.015; q-values < 0.06) different and changed by 15% or greater in the nucleus accumbens shell between the ethanol-injected (E) and control (C) alcohol-non-preferring (NP) rats
| Protein ID | Gene symbol | Annotation | NPE/NPC |
|---|---|---|---|
| IPI00231340.8 | 11_kDa_protein | 1.28 | |
| 225775 | rbcL | 1313192A_calmodulin_dependent_protein_kinase_II | 1.34 |
| IPI00362291.1 | 16_kDa_protein | -1.23b | |
| IPI00189519.1 | 19_kDa_protein | 1.28c | |
| IPI00188732.2 | 21_kDa_protein | 1.25 | |
| 1580888 | 2116232A_2-oxoglutarate_carrier_protein | 1.16 | |
| IPI00207891.2 | 31_kDa_protein | 1.26a | |
| IPI00782342.1 | 44_kDa_protein | -1.16 | |
| IPI00361239.4 | 49_kDa_protein | 1.33 | |
| IPI00200145.1 | Rplp1 | 60S_acidic_ribosomal_protein_P1 | -1.15 |
| IPI00231954.5 | Pfkp | 6-phosphofructokinase_type_C | 1.13 |
| 109966 | A35244_hexokinase_(EC_2.7.1.1),_tumor_-_mouse | 1.18 | |
| IPI00382300.3 | Rab1 | Ac2-048 | 1.21 |
| IPI00362072.2 | Actr2 | Actin-like_protein_2 | 1.15 |
| IPI00421909.3 | Spg3a | Atlastin-like_protein | 1.16 |
| IPI00196107.1 | Atp5f1 | ATP_synthase_B_chain,_mitochondrial_precursor | 1.20 |
| IPI00198620.1 | Atp5d | ATP_synthase_delta_chain,_mitochondrial_precursor | -1.21 |
| IPI00214665.2 | ATP-citrate_synthase | 1.34 | |
| IPI00193173.4 | Pcp4 | Brain-specific_polypeptide_PEP-19 | -1.35 |
| IPI00192337.1 | Camk2a | Calcium/calmodulin-dependent_protein_kinase_type_II_alpha_chain | 1.33 |
| IPI00231955.5 | Calm1 | Calmodulin | -1.28 |
| IPI00209824.2 | Camk2b | Calmodulin-dependent_protein_kinase_II_beta_M_isoform | 1.21 |
| IPI00215463.1 | Calml3 | Calmodulin-like_3 | -1.37 |
| 38014843 | Cd81 | Cd81_protein_[Rattus_norvegicus] | 1.21 |
| IPI00199076.2 | Pde2a | cGMP-dependent_3′,5′-cyclic_phosphodiesterase | 1.21 |
| 230824 | Grhl3 | Chain_,_Calmodulin | -1.31 |
| 29747871 | Csl | Citrate_synthase_like_[Mus_musculus] | 1.15 |
| IPI00193983.2 | Cltc | Clathrin_heavy_chain | 1.22 |
| 47605479 | Slc25a12 | CMC1_MOUSE_Calcium-binding_mitochondrial_carrier protein_Aralar1_(mitochondrial_aspartate_glutamate_carrier_1 | 1.23 |
| IPI00210978.1 | Cplx1 | Complexin-1 | -1.21 |
| 117104 | Cox5b | COX5B_MOUSE_Cytochrome_c_oxidase_polypeptide_Vb,_mitochondrial_precursor | -1.18 |
| IPI00188313.1 | Ckmt2 | Creatine_kinase,_sarcomeric_mitochondrial_precursor | 1.18 |
| IPI00192246.1 | Cox5a | Cytochrome_c_oxidase_polypeptide_Va,_mitochondrial_precursor | -1.18 |
| IPI00193918.1 | Cox5b | Cytochrome_c_oxidase_polypeptide_Vb,_mitochondrial_precursor | -1.17 |
| IPI00734686.2 | COII | cytochrome_c_oxidase_subunit_II | 1.31 |
| IPI00421955.1 | Ppp1r1b | Dopamine-and_cAMP-regulated_phosphoprotein_DARPP-32 | -1.27 |
| IPI00231407.4 | Dbn1 | drebrin_1 | -1.15 |
| IPI00231247.8 | Map2k1 | Dual_specificity_mitogen-activated_protein_kinase_kinase_1 | 1.17 |
| IPI00327630.1 | Dync1h1 | Dynein_heavy_chain,_cytosolic | 1.21 |
| IPI00195372.1 | Eef1a1 | Elongation_factor_1-alpha_1 | 1.15 |
| 119348 | Eno2 | ENOG_MOUSE_Gamma-enolase_(2-phospho-D-glycerate_hydro-lyase)_(Neural_enolase)_(Neuron-specific_enolase)_(NSE)_(Enolase_2) | -1.16 |
| IPI00422053.1 | Gna13 | Galpha13 | 1.23 |
| IPI00326412.3 | Eno2 | Gamma-enolase | -1.15 |
| IPI00364311.1 | Gpi | Glucose_phosphate_isomerase | 1.16 |
| IPI00191733.1 | Gad2 | Glutamate_decarboxylase_2 | 1.15 |
| IPI00199465.1 | Gls | Glutaminase_kidney_isoform,_mitochondrial_precursor | 1.18 |
| IPI00324020.5 | Glul | glutamine_synthetase_1 | 1.19 |
| IPI00231150.4 | GST | Glutathione_S-transferase_alpha_(Fragment) | 1.28 |
| IPI00287309.1 | Gpm6a | Glycoprotein_m6a | 1.17 |
| IPI00213685.1 | Rab3d | GTP-binding_protein_Rab-3D | 1.20 |
| IPI00230868.4 | Gnaq | guanine_nucleotide_binding_protein,_alpha_q_polypeptide | 1.15 |
| IPI00230866.6 | Gna12 | Guanine_nucleotide-binding_protein_alpha-12_subunit | 1.23 |
| IPI00231733.6 | Gnai1 | Guanine_nucleotide-binding_protein_G(i),_alpha-1_subunit | 1.22a,b |
| IPI00231925.7 | Gnai2 | Guanine_nucleotide-binding_protein_G(i),_alpha-2_subunit | 1.24 |
| IPI00202543.1 | Hk1 | Hexokinase-1 | 1.18 |
| IPI00231650.6 | Hist1h1c | Histone_H1.2 | 1.19b |
| IPI00188688.1 | H2a | Histone_H2a | 1.36 |
| IPI00231880.6 | H2afz | Histone_H2A.Z | 1.38 |
| IPI00368293.4 | Histh2a1 | Histone_H2A_type_1 | 1.30 |
| IPI00231475.6 | H3f3b | Histone_H3.3 | 1.36 |
| IPI00199273.1 | St13 | Hsc70-interacting_protein | -1.15 |
| IPI00205372.3 | Stxbp1 | Isoform_1_of_Syntaxin-binding_protein_1 | 1.20 |
| IPI00569103.3 | Mbp | Isoform_3_of_Myelin_basic_protein_S | 1.42 |
| IPI00196730.1 | Camk2g | Isoform_A_of_Calcium/calmodulin-dependent_protein_kinase_type_II_gamma_chain | 1.34 |
| IPI00212226.1 | Camk2d | Isoform_Delta_1_of_Calcium/calmodulin-dependent_protein_kinase_type_II_delta_chain | 1.35 |
| IPI00230956.1 | Slc1a3 | Isoform_GLAST-1A_of_Excitatory_amino_acid_transporter_1 | 1.24 |
| IPI00213663.1 | Slc1a2 | Isoform_Glt1_of_Excitatory_amino_acid_transporter_2 | 1.21 |
| IPI00188119.1 | Atp12a | Isoform_Long_of_Potassium-transporting_ATPase_alpha_chain_2 | 1.27 |
| IPI00205493.1 | Snca | Isoform_Syn1_of_Alpha-synuclein | -1.18 |
| IPI00197711.1 | Ldha | L-lactate_dehydrogenase_A_chain | 1.15 |
| IPI00231261.6 | Slc25a11 | Mitochondrial_2-oxoglutarate/malate_carrier_protein | 1.17 |
| IPI00231819.5 | Mbp1 | myelin_basic_protein_isoform_1 | 1.39 |
| IPI00231265.2 | Mbp4 | myelin_basic_protein_isoform_4 | 1.41 |
| IPI00421549.3 | Ndufa10 | NADH_dehydrogenase_(Ubiquinone)_1_alpha_subcomplex_10 | 1.15 |
| IPI00390362.1 | Ndufv3 | NADH_dehydrogenase_[ubiquinone]_flavoprotein_3,_mitochondrial_precursor | -1.19 |
| IPI00205396.1 | Ncdn | NORBIN | 1.15 |
| IPI00214262.1 | Nsfl1c | NSFL1_cofactor_p47 | -1.26 |
| IPI00230937.4 | Pebp1 | Phosphatidylethanolamine-binding_protein_1 | -1.20 |
| 9790051 | Pfkp | phosphofructokinase,_platelet_[Mus_musculus] | 1.15 |
| IPI00231641.4 | Pgm1 | Phosphoglucomutase-1 | 1.21a,b |
| 20141789 | Prdx5 | PRDX5_MOUSE_Peroxiredoxin-5,_mitochondrial_precursor_(Prx-V)_(Peroxisomal_antioxidant_enzyme)_(PLP)_(Thioredoxin_reductase) | -1.16 |
| IPI00212258.1 | Phpt | PREDICTED:_similar_to_14_kDa_phosphohistidine_Phosphatase | -1.21 |
| IPI00369349.3 | Atp6v1e2 | PREDICTED:_similar_to_ATPase,_H+_transporting,_V1_subunit_E-like_2_isoform_2 | -1.15a |
| IPI00208551.3 | 6720456B0 7Rik | PREDICTED:_similar_to_chromosome_3_open_reading_frame_10 | -1.15 |
| IPI00200624.1 | H2afj | PREDICTED:_similar_to_H2A_histone_family,_member_J | 1.36 |
| IPI00767428.1 | H3f2 | PREDICTED:_similar_to_H3_histone,_family_2_isoform_2 | 1.38 |
| IPI00566481.2 | Hist1h2ac | PREDICTED:_similar_to_histone_2,_H2ac | 1.30 |
| IPI00209163.1 | Hist1h2be | PREDICTED:_similar_to_histone_2,_H2be | 1.17 |
| IPI00764762.1 | Hist1h2a | PREDICTED:_similar_to_histone_2a | 1.43 |
| IPI00369397.5 | H2afx | PREDICTED:_similar_to_Histone_H2A.x | 1.31 |
| IPI00365775.3 | Me3 | PREDICTED:_similar_to_malic_enzyme_3,_NADP(+)-dependent,_mitochondrial | 1.26 |
| IPI00358441.1 | Ndufa9 | PREDICTED:_similar_to_NADH_dehydrogenase_(ubiquinone)_1_alpha_subcomplex,_9 | 1.20 |
| IPI00569808.2 | Nav3 | PREDICTED:_similar_to_neuron_navigator_3 | -1.30 |
| IPI00191897.4 | Nme2 | PREDICTED:_similar_to_Nucleoside_diphosphate_kinase_B | -1.15 |
| IPI00365705.6 | Atp1a1 | PREDICTED:_similar_to_Potassium-transporting_ATPase_alpha_chain_1 | 1.45 |
| IPI00207725.3 | Pnp | PREDICTED:_similar_to_purine-nucleoside_phosphorylase | 1.15 |
| IPI00388687.3 | Slc25a12 | PREDICTED:_similar_to_solute_carrier_family_25_(mitochondrial_carrier,_Aralar),_member_12 | 1.27 |
| IPI00189416.2 | Tpt1 | PREDICTED:_similar_to_tumor_protein,_translationally-controlled_1 | -1.17 |
| IPI00199600.1 | PREDICTED:_similar_to_vacuolar_H+_ATPase_G1 | -1.24 | |
| 50489 | CD207 | pro-alpha-2(I)_collagen_[Mus_musculus] | -1.25 |
| IPI00190557.2 | Phb2 | Prohibitin-2 | 1.20 |
| IPI00201797.1 | Prkcg | Protein_kinase_C_gamma_type | 1.17 |
| IPI00194324.1 | Pdhb | Pyruvate_dehydrogenase_E1_component_subunit_beta,_mitochondrial_precursor | -1.18 |
| IPI00555185.1 | Rab10 | RAB10,_member_RAS_oncogene_family | 1.21 |
| 6093900 | Rab3b | RAB3B_RAT_Ras-related_protein_Rab-3B | 1.19 |
| IPI00325762.1 | Rab3a | Ras-related_protein_Rab-3A | 1.21 |
| IPI00209150.1 | Rab3c | Ras-related_protein_Rab-3C | 1.16 |
| IPI00187747.1 | Rap1a | Ras-related_protein_Rap-1A_precursor | 1.25 |
| 631898 | Unc18 | S39345_unc-18_protein_homolog,_67K_-_rat | 1.20 |
| IPI00326305.3 | Atp1a1 | Sodium/potassium-transporting_ATPase_alpha-1_chain_precursor | 1.21 |
| IPI00205693.1 | Atp1a2 | Sodium/potassium-transporting_ATPase_alpha-2_chain_precursor | 1.23 |
| IPI00231451.4 | Atp1a3 | Sodium/potassium-transporting_ATPase_alpha-3_chain | 1.23 |
| IPI00231643.4 | Sod1 | Superoxide_dismutase | -1.17 |
| IPI00208115.4 | Sv2a | Synaptic_vesicle_glycoprotein_2A | 1.28 |
| IPI00324381.5 | Stx1a | Syntaxin-1A | 1.23 |
| IPI00188956.1 | Thy1 | Thy-1_membrane_glycoprotein_precursor | 1.18 |
| IPI00230925.4 | Tmsb4x | Thymosin_beta-4 | -1.21 |
| IPI00362927.1 | Tuba4a | Tubulin,_alpha_4 | 1.24 |
| IPI00189795.1 | Tuba1a | Tubulin_alpha-1_chain | 1.23 |
| IPI00339167.4 | Tuba1b | Tubulin_alpha-2_chain | 1.24 |
| IPI00369093.1 | Uqcrh | Ubiquinol-cytochrome_c_reductase_complex_11_kDa protein,_mitochondrial_precursor | -1.23 |
| 12847763 | Hist1h4i | unnamed_protein_product_[Mus_musculus] | 1.31 |
| 26337455 | Hdgfrp3 | unnamed_protein_product_[Mus_musculus] | -1.35 |
| IPI00364780.2 | Atp6v1h | Vacuolar_ATPase_subunit_H | 1.16 |
| IPI00198327.2 | Vdac2 | Voltage-dependent_anion-selective_channel_protein_2 | 1.28 |
| IPI00213598.1 | Wasf1 | WAS_protein_family,_member_1 | 1.19 |
| IPI00215349.3 | Wdr1 | WD_repeat_protein_1 | 1.19a,b |
| 33468975 | Zic5 | zinc_finger_protein_of_the_cerebellum_5_[Mus_musculus] | -1.27 |
NPE/NPC = fold change ethanol over control value; minus sign indicates that NPC value was greater than NPE value; n = 10 for NPE and n = 10 for NPC.
Similar ratio change found for P rats;
similar ratio change observed for W rats;
opposite ratio change found for W rats.
Table 4.
Significant GO categories containing 5 or more proteins that were different in the nucleus accumbens shell between the ethanol and control groups of NP rats
| Function/Process | Up-regulated | Down-regulated |
|---|---|---|
| GTP-binding | Hexokinase-1; alpha-tubulin; Ras-related protein Rab-3B; guanine nucleotide binding protein alpha q polypeptide; Ac2-048 (Rab1); Atlastin-like protein; Galpha 13 | none |
| ATP-binding | Hexokinase-1; sodium-potassium transporting ATPase alpha 2 chain precursor; sodium-potassium transporting ATPase alpha 1 chain precursor; Vacuolar ATPase subunit H; Ac2-048 (Rab1); NADH dehydrogenase 1 alpha subcomplex 10 | none |
| DNA-binding | Unnamed protein product; Histone H2a; Histone H1.2; Histone H2A.Z; Histone H2A type 1; Histone H3.3 | Chain calmodulin; Zinc finger protein of the cerebellum 5 |
| Protein binding | Dynein heavy chain; Unnamed protein product; Thy-1 membrane glycoprotein precursor; Prohibitin-2; Hexokinase-1; Syntaxin-binding protein-1; Sodium-potassium transporting ATPase alpha 2 chain precursor; Citrate synthase; Synaptic vesicle glycoprotein 2A; CD81 antigen; GTP-binding protein Rab-3D; Dual specificity mitogen-activated protein kinase kinase 1; Ras-related protein Rab-3A | Chain calmodulin; Prohibitin; Calmodulin; Nucleoside di-phosphate kinase B |
3.2. Effects of ethanol on protein levels in NP rats
Repeated administration of ethanol significantly (p-values < 0.015; q-values < 0.06; fold change ≥ 1.15) altered the levels of 128 proteins in the ACB-shell of NP rats (Table 3). Most of the changes were in the range of 1.15- to 1.35-fold, with 2.5 more proteins having higher than lower levels in the ethanol group. Two general classes of proteins (i.e., Histones and myelin basic proteins) had differences of approximately 1.3-fold between the control and ethanol groups, with all proteins in both classes having higher expression in the ethanol treated group (Table 3). In addition, there were several calcium-calmodulin proteins, guanine nucleotide binding proteins and Ras-related proteins that also had higher expression levels in the ACB-shell of the ethanol than saline group of NP rats.
Only 7 of the 128 proteins that were altered by ethanol treatment in the ACB-shell of the NP rats were similarly changed in the ACB-shell of P and W rats (Tables 2, 3 and 5); there was 1 protein (19 kDa protein) that was changed in the opposite direction in NP versus W rats. There were no proteins that were significantly changed in the opposite direction by ethanol in the ACB-shell of NP versus P rats. Therefore, ethanol appeared to produce unique changes in protein expression in the ACB-shell of NP rats that were not observed in P or W rats.
Table 5.
Priority 1 (>99.9% confidence level) proteins that were significantly (p-values < 0.015; q-values < 0.2) different and changed by 15% or greater in the nucleus accumbens shell between the ethanol-injected (E) and control (C) Wistar (W) rats
| Protein ID | Gene symbol | Annotation | WE/WC |
|---|---|---|---|
| IPI00782125.1 | 13_kDa_protein | -1.28 | |
| IPI00362291.1 | 16_kDa_protein | -1.15b | |
| IPI00189519.1 | 19_kDa_protein | -1.17c | |
| IPI00568873.2 | 20_kDa_protein | -1.41 | |
| IPI00562632.1 | 33_kDa_protein | 1.22a | |
| IPI00366110.3 | 47_kDa_protein | -1.16 | |
| IPI00777829.1 | 54_kDa_protein | 1.28 | |
| 15986733 | Rab4b | AF408432_1_GTP-binding_protein_RAB4_[Mus_musculus] | -1.19a |
| IPI00215523.1 | Bcat1 | Branched-chain-amino-acid_aminotransferase,_cytosolic | -1.17 |
| IPI00231118.4 | Calb1 | Calbindin | -1.15a |
| IPI00566635.2 | Discs_large_homolog_4 | 1.20 | |
| IPI00231733.6 | Gnai1 | Guanine_nucleotide-binding_protein_G(i),_alpha-1_subunit | 1.19a,b |
| IPI00231650.6 | Hist1h1c | Histone_H1.2 | 1.15b |
| IPI00417225.1 | Synpo | Isoform_1_of_Synaptopodin | 1.18a |
| IPI00202549.1 | Pklr | Isoform_R-type_of_Pyruvate_kinase_isozymes_R/L | 1.21 |
| 66857 | KIRTPR_pyruvate_kinase_(EC_2.7.1.40),_erythrocyte_splice_form_R_-_rat | 1.27 | |
| 26006161 | mKIAA0417_protein_[Mus_musculus] | 1.15 | |
| IPI00191790.1 | Efcbp2 | Neuronal_calcium_binding_protein_NECAB2 | -1.15 |
| IPI00231641.4 | Pgm1 | Phosphoglucomutase-1 | 1.30a,b |
| IPI00199203.1 | Gapdh | PREDICTED:_similar_to_glyceraldehyde-3-phosphate_dehydrogenase | 1.24 |
| IPI00358537.2 | Hspa12a | PREDICTED:_similar_to_heat_shock_protein_12A | 1.15 |
| IPI00464820.4 | Ngef | PREDICTED:_similar_to_neuronal_guanine_nucleotide_exchange_factor | 1.53a |
| IPI00763565.1 | PREDICTED:_similar_to_polyubiquitin | -1.41 | |
| IPI00190240.1 | Rps27a | Ribosomal_protein_S27a | -1.38 |
| IPI00471526.3 | LOC298795 | Similar_to_14-3-3_protein_sigma | -1.23 |
| IPI00394488.2 | LOC498174 | Similar_to_NipSnap2_protein | 1.30a |
| 54038641 | Tagln2 | Transgelin_2_[Rattus_norvegicus] | -1.15 |
| IPI00215349.3 | Wdr1 | WD_repeat_protein_1 | 1.22a,b |
WE/WC = fold change ethanol over control value; minus sign indicates that WC value was greater than WE value; n = 10 for WC, and n = 9 for WE.
Similar ratio change found for P rats;
similar ratio change observed for NP rats;
opposite ratio change found for NP rats.
GO analysis yielded 4 significant MF categories, containing at least 5 proteins (Table 4). There were no significant BP categories containing at least 5 proteins. In all 4 MF categories, there were more proteins with higher expression levels in the ACB-shell of the ethanol than saline group, i.e., GTP binding (all 7 proteins were higher in the ethanol group), ATP-binding (all 6 proteins were higher in the ethanol group), DNA-binding (6 of 8 proteins were higher in the ethanol group), and protein binding (13 of 17 proteins were higher in the ethanol group).
In the ‘GTP binding’ category (Table 4), the 7 proteins with higher expression levels in the ACB-shell of ethanol included, hexokinase-1, alpha-tubulin, Ras-related protein Rab-3B, Ac2-048 (Rab1), Atlastin-like protein, Galpha 13, and guanine nucleotide binding protein alpha q polypeptide. None of these proteins were similarly changed by ethanol in the ACB-shell of P or W rats. In addition, none of the 6 proteins in the ‘ATP binding’ category (Table 4) were similarly changed by ethanol treatment in the P or W rats. In the ‘DNA-binding’ category, all 5 histones had higher levels in the ACB-shell of the ethanol-treated NP rats, with 4 of the 5 showing fold changes between 1.30 and 1.38 (Table 3). Histone H1.2 had the smallest increase (1.19-fold) and was the only histone of the 5 that was similarly changed in the W rat.
3.3. Effects of ethanol on protein levels in W rats
Repeated administration of ethanol significantly (p < 0.015; q-values < 0.2; fold change ≥ 1.15) altered the levels of 28 proteins in the ACB-shell of W rats (Table 5). Most of the changes were in the range of 1.15- to 1.25- fold, with approximately equal numbers of proteins having increased and decreased levels in the ethanol versus saline group. Similar to the findings with P rats, neuronal guanine nucleotide exchange factor (Ngef) had the highest fold difference with 1.5-fold higher levels in the ethanol group. GO analysis did not yield any significant BP or MF categories, containing at least 5 proteins.
Among the 28 proteins that were altered by ethanol in the ACB-shell of W rats (Table 5), there were 11 that were similarly changed in P or NP rats. Only one protein changed in the opposite direction with ethanol treatment in the W rats versus either P or NP rats, i.e., 19 kDa protein had lower expression levels in the ethanol-treated W rats and higher levels in the ethanol-treated NP line. Therefore, expression levels of 17 proteins were uniquely changed by ethanol in the ACB-shell of W rats (Table 5).
3.4. Common changes among P, NP and W rats
There were only 3 proteins that had expression levels similarly changed by ethanol treatment in the ACB-shell of P, NP and W rats. These proteins are guanine nucleotide-binding protein G(i) alpha-1 subunit, phosphoglucomutase-1, and WD repeat protein 1.
4. Discussion
The major findings of this study were that repeated i.p. injections of 1 g/kg ethanol differentially altered protein expression levels in the ACB-shell of P, NP and W rats (Tables 2 – 5), with ethanol uniquely altering expression levels of 11 of 22 proteins in the P rat, 121 of 128 proteins in the NP rat, and 17 of 28 proteins in the W rat. These differential alterations in protein expression levels among the 3 rat strains suggest a significant strain × ethanol interaction.
For NP rats, more proteins were increased than decreased by ethanol in the ‘ATP-binding’, ‘GTP-binding’, and ‘DNA-binding’ categories (Table 4). Similar changes were not observed for P and W rats. The ATP- and GTP-binding categories contain proteins that are involved in intracellular signaling pathways and membrane excitability, suggesting an enhancement of these processes in the NP rat following ethanol treatment. These changes are compatible with increased synaptic function. The higher expression levels of histones in the ‘DNA-binding’ category are consistent with enhanced protein expression levels in the other GO categories for the ACB-shell of NP rats. Overall, these changes in protein expression that occurred in the ACB-shell in NP rats, as a result of ethanol injections (Tables 3 and 4), could reflect alterations associated with initial exposures to ethanol that could contribute to the low alcohol drinking characteristics of this line.
Ingenuity® analysis of the proteins altered by ethanol in the ACB-sh of NP rats indicated a calmodulin network (Fig. 3) involved in calcium signaling and long-term potentiation (LTP) and a G-protein network (Fig. 4) involved in axonal guidance signaling and long-term depression (LTD). The calmodulin-calcium intracellular signaling pathway (Fig. 3) and the G-protein intracellular signaling network (Fig. 4) are composed of proteins that have been primarily up-regulated in the ACB-shell of the NP rat, suggesting ethanol-enhanced synaptic plasticity. The up-regulation of ARP2 actin-related protein (Actr2) and WAS protein family member 1 (Wasf1) are also consistent with an interpretation of ethanol-enhanced synaptic plasticity. Actr2 facilitates neuronal actin remodeling (Soderling et al., 2007), and Wasf1 is involved in linking actin dynamics and synaptic vesicle endocytosis (Shin et al., 2007). The higher protein expression levels of clathrin heavy chain (Cltc) also support ethanol-induced postsynaptic alterations.
Fig. 3.
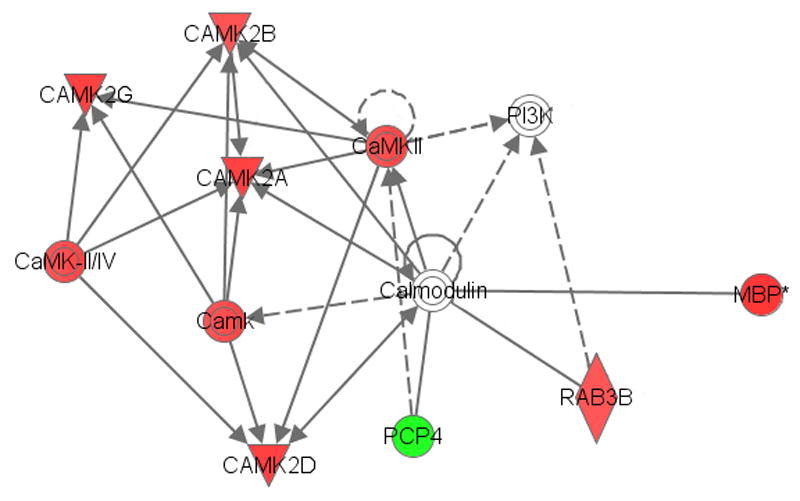
Abridged Ingenuity® Pathways Analysis of effects of ethanol in the nucleus accumbens shell of NP rats showing up-regulation of calcium/calmodulin signaling pathways. Red indicates up-regulation, green indicates down-regulation, and clear symbol indicates proteins that were not identified as differentially expressed, but were linked to multiple proteins that had changed significantly. Solid lines indicate direct interactions and dashed lines indicate indirect interactions. Abbreviations: CAMK2A – calcium/calmodulin-dependent protein kinase II alpha; CAMK2B – calcium/calmodulin-dependent protein kinase II beta; CAMK2D – calcium/calmodulin-dependent protein kinase II delta; CAMK2G – calcium/calmodulin-dependent protein kinase II gamma; MBP – myelin basic protein; PCP4 – purkinje cell protein 4 or brain-specific polypeptide PEP-19; PI3K – phosphatidylinositol 3-kinase; RAB3B – ras related GTP-binding protein Rab-3B. (For interpretation of the references to color in this figure legend, the reader is referred to the web version of this article.)
Fig. 4.
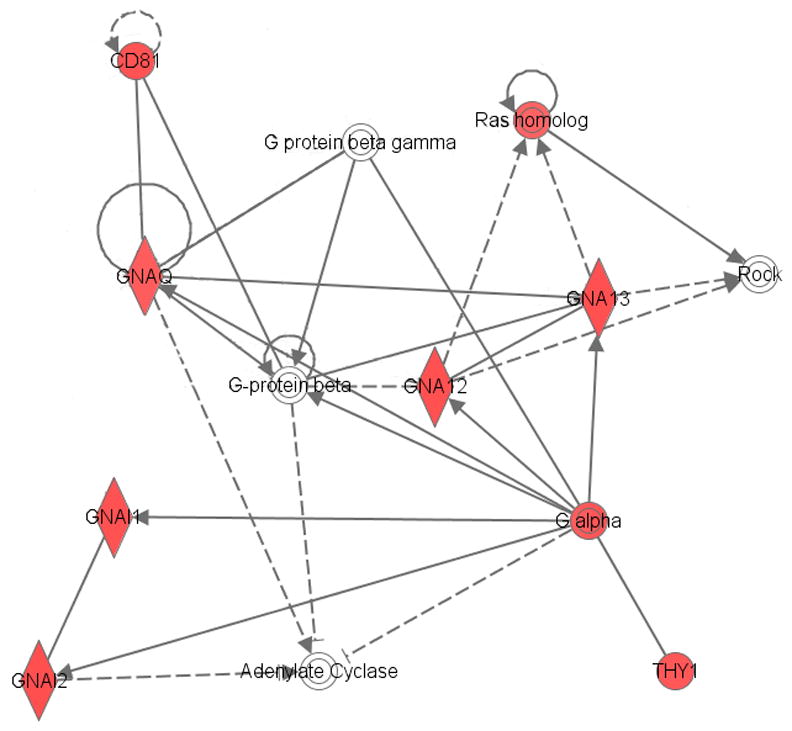
Abridged Ingenuity® Pathways Analysis of effects of ethanol in the nucleus accumbens shell of NP rats showing up-regulation of G-protein signaling pathways. Red indicates up-regulation, green indicates down-regulation, and clear symbol indicates proteins that were not identified as differentially expressed, but were linked to multiple proteins that had changed significantly. Solid lines indicate direct interactions and dashed lines indicate indirect interactions. Abbreviations: CD81 – Cd 81 protein; GNA12 – guanine nucleotide binding protein alpha 12; GNA13 – guanine nucleotide binding protein alpha 13; GNAQ - guanine nucleotide binding protein alpha q polypeptide; GNAI1 - guanine nucleotide binding protein (Gi) alpha-1 subunit; GNAI2 - guanine nucleotide binding protein (Gi) alpha-2 subunit; ROCK – Roh-associated coiled-coil containing protein kinase; THY1 – thymus cell antigen 1 theta or Thy-1 membrane glycoprotein precursor. (For interpretation of the references to color in this figure legend, the reader is referred to the web version of this article.)
Compared to the findings for NP rats, ethanol produced effects on fewer proteins in the ACB-shell of P rats (22 for P rats versus 128 for NP rats), with only 5 proteins in common between the two lines of rats (Tables 2 and 3). The altered expression of Synpo, Syngap1 and Ngef (Table 2) in the ethanol-treated group suggests that synaptic changes may have occurred in the ACB-shell of P rats. Ngef had the highest fold increase (1.65) in the ACB-shell of the P rats in the ethanol versus the saline group (Table 2). Ngef regulates ADP ribosylation factor 6, a small GTPase involved in forming a postsynaptic complex of PSD-95 and NMDA receptors at excitatory synapses (Sakagami et al., 2008; Inaba et al., 2004). The up-regulation of synaptopodin (Synpo), which is involved in maintaining activity-dependent enlargement of dendritic spines (Okubo-Suzuki et al., 2008), supports the idea that some form of ethanol-induced synaptic plasticity may have occurred within the ACB-shell of P rats. In contrast to the up-regulation of Ngef and Synpo, the protein expression level of the Ras GTPase-activating protein SynGap (Syngap1), which appears to have a role in LTP and is associated with NMDA receptors (Komiyama et al., 2002), was significantly reduced in the ACB-shell. However, in cultured neurons, over-expression of Syngap reduced AMPA receptor function and insertion of AMPA receptors into the plasma membrane (Rumbaugh et al., 2006). Therefore, in the present situation, it is possible that reduced levels of Syngap could results in enhanced AMPA receptor function. The findings that ethanol-induced synaptic plasticity may have occurred in the ACB-shell of both P and NP rats, but that different proteins are involved, suggest that different synaptic events have occurred, possibly involving alterations in different synaptic connections in the two rat lines.
The effects of the ethanol treatment on changes in protein levels in the ACB-shell of W rats (Table 5) indicated that few similar alterations were occurring in the W rats as were evident in NP rats (Tables 3 and 5). There were some changes in the levels of proteins that were observed for the W rats that suggested possible alterations in neuronal function; some of these changes were also observed for the P rat (Tables 2 and 5). For example, there were increased protein levels for NipSnap 2, involved in vesicular transport (Seroussi et al., 1998), and Synpo and Ngef, which are involved in postsynaptic function (Okubo-Suzuki et al., 2008; Sakagami et al., 2008). The overall results suggest that W rats may be undergoing ethanol-induced neuronal alterations in the ACB-shell, and that some of these alterations may be similar to changes observed for P, but different than changes observed for NP rats.
Differences in ethanol-induced changes in protein expression levels are not likely a result of differences in absorption or elimination of ethanol between the lines of rats. Previous studies indicated that similar time-course changes in blood ethanol levels following i.p. ethanol administration between P and NP rats (Lumeng et al., 1982; Strother et al., 2005).
The more widespread effects of repeated ethanol treatments on changes in protein expression levels in the NP than P rat, as exemplified by the greater number of proteins that were altered (Tables 2 and 3), are in agreement with the behavioral effects of repeated i.p. injections of 1 g/kg ethanol on performance on the oscillating bar task of P and NP rats, in which repeated injections produced significant changes in performance in the NP rats, but had little apparent effect on performance in the P rat (Bell et al., 2001).
Bell et al. (2006) reported protein expression changes in the ACB and amygdala of inbred P rats that had been chronically drinking alcohol. These investigators reported that ethanol drinking altered 14 proteins in the ACB and 27 proteins in the amygdala (Bell et al., 2006). There was no overlap between the proteins altered in the ACB by chronic alcohol drinking (Bell et al., 2006) and those altered by repeated ethanol injections in the present study (Table 2). This is likely due to differences in the alcohol-exposure protocols and analyzing the entire ACB versus the ACB-shell.
Comparison of the present findings with P rats injected with ethanol (Table 2) and proteomics studies with autopsied alcoholic brains (Matsuda-Matsumoto et al., 2007; Alexander-Kaufman et al., 2006, 2007; Lewohl et al., 2004) indicated few proteins or classes of proteins in common between the P rats and human studies. In the present study (Table 2) and the results of Matsuda-Matsumoto et al., (2007) for the hippocampus, only guanine nucleotide-binding (Gn) proteins were altered by ethanol treatment in both the present study and the post mortem study.
Comparison of the present proteomics findings (Table 2) with gene expression changes in the ACB of inbred P rats self-administering 15% ethanol (Rodd et al., 2008) indicated no common ethanol-induced differences. The lack of overlap between the operant ethanol self-administration study and the present study may likely be due, in part, to the differences in the alcohol exposure protocols.
A previous study (Kimpel et al., 2007) indicated that there were significant differences in the expression of several genes in the ACB between inbred P and NP rats. However, in the present study, there were no innate differences in protein levels in the ACB-sh between the selectively bred P and NP rats. The apparent discrepancy between the gene expression data and the current protein findings may be due to a combination of factors, including: (a) differences in mRNA may not necessarily translate into similar differences in local protein levels; (b) changes in mRNA reflect changes occurring primarily in the local glial and neurons, whereas protein levels in a given region reflect both local synthesis and protein transport; and (c) the entire ACB was analyzed in the gene expression study, whereas only a sub-region of the ACB was studied in the present study.
Over 875 proteins were identified (with a confidence level of greater than 99% with 2 independent peptides); there were another 1,700 proteins detected and identified with a lower confidence level in the individual micropunch samples. With an improved database and better bioinformatics, this proteomics approach could yield significantly more information.
In summary, the present results indicate that the repeated systemic administration of a moderate dose of ethanol produces differential effects on protein expression in the ACB-shell between P, NP and W rats, suggesting significant strain × ethanol interactions. Ethanol produced effects on proteins involved in synaptic function within the ACB-shell of NP rats that were not observed for P and W rats; these alterations might be factors contributing to the low alcohol drinking characteristics of the NP line.
Supplementary Material
Supplemental Table A lists all the proteins (and their expression levels) identified in priority category 1 in the ACB-shell of P, NP and W rats. Supplemental Table B lists all the peptides used to quantify each priority 1 protein.
Acknowledgments
Supported in part by AA07611, AA016652 [INIA project], AA013522 [INIA project] and INGEN® (which is partially funded by Lilly Endowment Inc.).
Footnotes
Publisher's Disclaimer: This is a PDF file of an unedited manuscript that has been accepted for publication. As a service to our customers we are providing this early version of the manuscript. The manuscript will undergo copyediting, typesetting, and review of the resulting proof before it is published in its final citable form. Please note that during the production process errors may be discovered which could affect the content, and all legal disclaimers that apply to the journal pertain.
References
- Alexander-Kaufman K, James G, Sheedy D, Harper C, Matsumoto I. Differential protein expression in the prefrontal white matter of human alcoholics: a proteomics study. Molecular Psych. 2006;11:56–65. doi: 10.1038/sj.mp.4001741. [DOI] [PubMed] [Google Scholar]
- Alexander-Kaufman K, Harper C, Wilce P, Matsumoto I. Cerebellar vermis proteome of chronic alcoholic individuals. Alcohol Clin Exp Res. 2007;31:1286–96. doi: 10.1111/j.1530-0277.2007.00437.x. [DOI] [PubMed] [Google Scholar]
- Ashburner M, Ball CA, Blake JA, Botstein D, Butler H, Cherry JM, et al. Gene ontology: tool for the unification of biology. The Gene Ontology Consortium Nat Genet. 2000;25:25–9. doi: 10.1038/75556. [DOI] [PMC free article] [PubMed] [Google Scholar]
- Bell RL, Stewart RB, Woods JE, II, Lumeng L, Li TK, Murphy JM, McBride WJ. Responsivity and development of tolerance to the motor impairing effects of moderate doses of ethanol in alcohol-preferring (P) and –nonpreferring (NP) rat lines. Alcohol Clin Exp Res. 2001;25:644–50. [PubMed] [Google Scholar]
- Bell RL, Rodd ZA, Murphy JM, McBride WJ. Use of selectively bred alcohol-preferring rats to study alcohol abuse, relapse and craving. In: Preedy VR, Watson RR, editors. Comprehensive Handbook of Alcohol Related Pathology. Vol. 3. New York: Academic Press, Elsevier Science; 2005. pp. 1515–33. [Google Scholar]
- Bell RL, Kimpel MW, Rodd ZA, Strother WN, Bai F, Peper CL, et al. Protein expression in the nucleus accumbens and amygdala of inbred alcohol-preferring rats given either continuous or scheduled access to ethanol. Alcohol. 2006;40:3–17. doi: 10.1016/j.alcohol.2006.10.001. [DOI] [PubMed] [Google Scholar]
- Bolstad BM, Irizarry RA, Astrand M, Speed TP. A comparison of normalization methods for high density oligonucleotide array data based on variance and bias. Bioinformatics. 2003;19:185–93. doi: 10.1093/bioinformatics/19.2.185. [DOI] [PubMed] [Google Scholar]
- Bradford MM. A rapid and sensitive method for the quantitation of microgram quantities of protein utilizing the principle of protein-dye binding. Anal Biochem. 1976;72:248–54. doi: 10.1016/0003-2697(76)90527-3. [DOI] [PubMed] [Google Scholar]
- Flatscher-Bader T, van der Brug M, Hwang JW, Gochee PA, Matsumoto I, Niwa S, Wilce PA. Alcohol-responsive genes in the frontal cortex and nucleus accumbens of human alcoholics. J Neurochem. 2005;93:359–70. doi: 10.1111/j.1471-4159.2004.03021.x. [DOI] [PubMed] [Google Scholar]
- Gatto GJ, Murphy JM, Waller MB, McBride WJ, Lumeng L, Li TK. Persistence of tolerance to a single dose of ethanol in the selectively-bred alcohol-preferring rat. Pharmacol Biochem Behav. 1987;28:105–10. doi: 10.1016/0091-3057(87)90020-7. [DOI] [PubMed] [Google Scholar]
- Gentleman RC. Using GO for statistical analysis. Proc COMPSTAT. 2004:171–180. [Google Scholar]
- Gentleman RC, Carey VJ, Bates DM, Bolstad B, Dettling M, Dudoit S, et al. Bioconductor: open software development for computational biology and bioinformatics. Genome Biol. 2004;5:R80. doi: 10.1186/gb-2004-5-10-r80. [DOI] [PMC free article] [PubMed] [Google Scholar]
- Hale JE, Butler JP, Gelfanova V, You JS, Knierman MD. A simplified procedure for the reduction and alkylation of cysteine residues in proteins prior to proteolytic digestion and mass spectral analysis. Anal Biochem. 2004;333:174–81. doi: 10.1016/j.ab.2004.04.013. [DOI] [PubMed] [Google Scholar]
- Harris MA, Clark J, Ireland A, Lomax J, Ashburner M, Foulger R, et al. The Gene Ontology (GO) database and informatics resource. Nucleic Acids Res. 2004;32:D258–61. doi: 10.1093/nar/gkh036. Database issue. [DOI] [PMC free article] [PubMed] [Google Scholar]
- Higgs RE, Knierman MD, Gelfanova V, Butler JP, Hale JE. Comprehensive label-free method for the relative quantification of proteins from biological samples. J Proteome Res. 2005;4:1442–50. doi: 10.1021/pr050109b. [DOI] [PubMed] [Google Scholar]
- Higgs RE, Knierman MD, Freeman AB, Gelbert LM, Patil ST, Hale JE. Estimating the statistical significance of peptide identifications from shotgun proteomics experiments. J Proteome Res. 2007;6:1758–67. doi: 10.1021/pr0605320. [DOI] [PubMed] [Google Scholar]
- Ikemoto S, Glazier BS, Murphy JM, McBride WJ. Role of D1 and D2 receptors in the nucleus accumbens in mediating reward. J Neurosci. 1997;17:8580–87. doi: 10.1523/JNEUROSCI.17-21-08580.1997. [DOI] [PMC free article] [PubMed] [Google Scholar]
- Inaba Y, Tian QB, Okano A, Zhang JP, Sakagami H, Miyazawa S, Li W, et al. Brain-specific potential guanine nucleotide exchange factor for Arf, synArtGEF (Po) is localized to postsynaptic density. J Neurochem. 2004;89:1347–57. doi: 10.1111/j.1471-4159.2004.02440.x. [DOI] [PubMed] [Google Scholar]
- Kerns RT, Ravindranathan A, Hassan S, Cage MP, York T, Sikela JM, Williams RW, Miles MF. Ethanol-responsive brain region expression networks: Implications for behavioral responses to acute ethanol in DBA/2J versus C57BL/6J mice. J Neurosci. 2005;25:2255–66. doi: 10.1523/JNEUROSCI.4372-04.2005. [DOI] [PMC free article] [PubMed] [Google Scholar]
- Kimpel MW, Strother WN, McClintick JN, Carr LG, Edenberg HJ, McBride WJ. Functional gene expression differences between inbred alcohol-preferring (iP) and –non-preferring (iNP) rats in five brain regions. Alcohol. 2007;41:95–132. doi: 10.1016/j.alcohol.2007.03.003. [DOI] [PMC free article] [PubMed] [Google Scholar]
- Komiyama NH, Watabe AM, Carlisle HJ, Porter K, Charlesworth P, Monti J, et al. SynGAP regulates ERK/MAPK signaling, synaptic plasticity, and learning in the complex with postsynaptic density 95 and NMDA receptor. J Neurosci. 2002;22:9721–32. doi: 10.1523/JNEUROSCI.22-22-09721.2002. [DOI] [PMC free article] [PubMed] [Google Scholar]
- Koob GF, Roberts AJ, Schulteis G, Parsons LF, Heyser CJ, Hyytia P, Merlopich E, Weiss F. Neurocircuitry targets in ethanol reward and dependence. Alcohol Clin Exp Res. 1998;22:3–9. [PubMed] [Google Scholar]
- Lewohl JM, Wang L, Miles MF, Zhang L, Dodd PR, Harris RA. Gene expression in human alcoholism: microarray analysis of frontal cortex. Alcohol Clin Exp Res. 2000;24:1873–82. [PubMed] [Google Scholar]
- Lewohl JM, Van Dyk DD, Craft GE, Innes DJ, Mayfield RD, Cobon G, Harris RA, Dodd PR. The application of proteomics to the human alcoholic brain. Ann NY Acad Sci. 2004;1025:14–26. doi: 10.1196/annals.1316.002. [DOI] [PubMed] [Google Scholar]
- Liu J, Lewohl JM, Dodd PR, Randall PK, Harris RA, Mayfield RD. Gene expression profiling of individual cases reveals consistent transcriptional changes in alcoholic human brain. J Neurochem. 2004;90:1050–58. doi: 10.1111/j.1471-4159.2004.02570.x. [DOI] [PubMed] [Google Scholar]
- Lumeng L, Hawkins DT, Li TK. New strains of rats with alcohol preference and nonpreference. In: Thurman RG, Williamson JR, Drott H, Chance B, editors. Alcohol and Aldehyde Metabolizing Systems. Vol. 3. Academic Press; New York: 1977. pp. 537–44. [Google Scholar]
- Lumeng L, Waller MB, McBride WJ, Li TK. Different sensitivities to ethanol in alcohol-preferring and –non-preferring rats. Pharmacol Biochem Behav. 1982;16:125–30. doi: 10.1016/0091-3057(82)90023-5. [DOI] [PubMed] [Google Scholar]
- Matsuda-Matsumoto H, Isazaki T, Kashem MA, Harper C, Matsumoto I. Differential protein expression profiles in the hippocampus of human alcoholics. Neurochem Int. 2007;51:370–6. doi: 10.1016/j.neuint.2007.04.001. [DOI] [PubMed] [Google Scholar]
- Matsumoto I, Alexander-Kaufman K, Iwazaki T, Kashem MA, Matsuda-Matsumoto H. CNS proteomes in alcohol and drug abuse and dependence. Expert Rev Proteomics. 2007;4:539–52. doi: 10.1586/14789450.4.4.539. [DOI] [PubMed] [Google Scholar]
- Mayfield RD, Lewohl JM, Dodd PR, Herlihy A, Liu J, Harris RA. Patterns of gene expression are altered in the frontal and motor cortices of human alcoholics. J Neurochem. 2002;81:802–13. doi: 10.1046/j.1471-4159.2002.00860.x. [DOI] [PubMed] [Google Scholar]
- McBride WJ, Li TK. Animal models of alcoholism: neurobiology of high alcohol-drinking behavior in rodents. Crit Rev Neurobiol. 1998;12:339–69. doi: 10.1615/critrevneurobiol.v12.i4.40. [DOI] [PubMed] [Google Scholar]
- Murphy JM, Stewart RB, Bell RL, Badia-Elder NE, Carr LG, McBride WJ, Lumeng L, Li TK. Phenotypic and genotypic characterization of the Indiana University rat lines selectively bred for high and low alcohol preference. Behav Genet. 2002;32:363–88. doi: 10.1023/a:1020266306135. [DOI] [PubMed] [Google Scholar]
- Okubo-Suzuki R, Okada D, Sekiguchi M, Inokuchi K. Synaptopodin maintains the neural activity-dependent enlargement of dendritic spines in hippocampal neurons. Mol Cell Neurosci. 2008;38:266–76. doi: 10.1016/j.mcn.2008.03.001. [DOI] [PubMed] [Google Scholar]
- Paxinos G, Watson C. The Rat Brain in Stereotaxic Coordinates. Academic Press; New York: 1998. [Google Scholar]
- Rodd ZA, Bell RL, McKinzie DL, Webster AA, Murphy JM, Lumeng L, Li TK, McBride WJ. Low-dose stimulatory effects of ethanol during adolescence in rat lines selectively bred for high alcohol intake. Alcohol Clin Exp Res. 2004;28:535–43. doi: 10.1097/01.alc.0000122107.08417.d0. [DOI] [PubMed] [Google Scholar]
- Rodd ZA, Kimpel MW, Edenberg HJ, Bell RL, Strother WN, McClintick JN, Carr LG, Liang T, McBride WJ. Differential gene expression in the nucleus accumbens with ethanol self-administration in inbred alcohol-preferring rats. Pharmacol Biochem Behav. 2008;89:481–98. doi: 10.1016/j.pbb.2008.01.023. [DOI] [PMC free article] [PubMed] [Google Scholar]
- Rumbaugh G, Adams JP, Kim JH, Huganir RL. SynGAP regulates synaptic strength and mitogen-activated protein kinases in cultured neurons. Proc Natl Acad Sci (USA) 2006;103:4344–4351. doi: 10.1073/pnas.0600084103. [DOI] [PMC free article] [PubMed] [Google Scholar]
- Saito M, Smiley J, Toth R, Vadasz C. Microarray analysis of gene expression in rat hippocampus after chronic ethanol treatment. Neurochem Res. 2002;27:1221–29. doi: 10.1023/a:1020937728506. [DOI] [PubMed] [Google Scholar]
- Saito M, Szakall I, Toth R, Kovacs KM, Oros M, Prasad VV, Blumenberg M, Vadasz C. Mouse striatal transcriptome analysis: effects of oral self-administration of alcohol. Alcohol. 2004;32:223–41. doi: 10.1016/j.alcohol.2004.02.005. [DOI] [PubMed] [Google Scholar]
- Sakagami H, Sanda M, Fukaya M, Miyazaki T, Sukegawa J, Yanagisawa T, Suzuki T, Fukunaga K, Watanabe M, Kondo H. IQ-ArfGEF/BRAG1 is a guanine nucleotide exchange factor for Arf6 that interacts with PSD-95 at postsynaptic density of excitatory synapses. Neurosci Res. 2008;60:199–212. doi: 10.1016/j.neures.2007.10.013. [DOI] [PubMed] [Google Scholar]
- Seroussi E, Pan HQ, Kedra D, Roe BA, Dumanski JP. Characterization of the human NIPSNAP1 gene from 22q12: a member of a novel gene family. Gene. 1998;212:13–20. doi: 10.1016/s0378-1119(98)00098-5. [DOI] [PubMed] [Google Scholar]
- Shin N, Lee S, Ahn N, Kim SA, Ahn SG, Yong-Park Z, Chang S. Sorting nexin 9 interacts with dynamin 1 and N-WASP and coordinates synaptic vesicle endocytosis. J Biol Chem. 2007;282:28939–50. doi: 10.1074/jbc.M700283200. [DOI] [PubMed] [Google Scholar]
- Smith AD, Weiss F. Ethanol exposure differentially alters central monoamine neurotransmission in alcohol-preferring versus –nonpreferring rats. J Pharmacol Exp Ther. 1999;288:1223–8. [PubMed] [Google Scholar]
- Soderling SH, Guire ES, Kaech S, White J, Zhang F, Schutz K, Langeberg LK, Banker G, Raber J, Scott JD. A WAVE-1 and WRP signaling complex regulates spine density, synaptic plasticity, and memory. J Neurosci. 2007;27:355–65. doi: 10.1523/JNEUROSCI.3209-06.2006. [DOI] [PMC free article] [PubMed] [Google Scholar]
- Strother WN, McBride WJ, Lumeng L, Li TK. Effects of acute administration of ethanol on cerebral glucose utilization in adult alcohol-preferring and alcohol-nonpreferring rats. Alcohol. 2005;35:119–128. doi: 10.1016/j.alcohol.2005.03.003. [DOI] [PubMed] [Google Scholar]
- Thielen RJ, Engleman EA, Rodd ZA, Murphy JM, Lumeng L, Li TK, McBride WJ. Ethanol drinking and deprivation alter dopaminergic and serotonergic function in the nucleus accumbens of alcohol-preferring (P) rats. J Pharmacol Exp Ther. 2004;309:216–25. doi: 10.1124/jpet.103.059790. [DOI] [PubMed] [Google Scholar]
- Treadwell JA, Singh SM. Microarray analysis of mouse brain gene expression following acute ethanol treatment. Neurochem Res. 2004;29:357–69. doi: 10.1023/b:nere.0000013738.06437.a6. [DOI] [PubMed] [Google Scholar]
- Waller MB, McBride WJ, Lumeng L, Li TK. Initial sensitivity and acute tolerance to ethanol in the P and NP lines of rats. Pharmacol Biochem Behav. 1983;19:683–6. doi: 10.1016/0091-3057(83)90345-3. [DOI] [PubMed] [Google Scholar]
- Waller MB, Murphy JM, McBride WJ, Lumeng L, Li TK. Effect of low dose ethanol on spontaneous motor activity in alcohol-preferring and –nonpreferring lines of rats. Pharmacol Biochem Behav. 1986;24:617–23. doi: 10.1016/0091-3057(86)90567-8. [DOI] [PubMed] [Google Scholar]
Associated Data
This section collects any data citations, data availability statements, or supplementary materials included in this article.
Supplementary Materials
Supplemental Table A lists all the proteins (and their expression levels) identified in priority category 1 in the ACB-shell of P, NP and W rats. Supplemental Table B lists all the peptides used to quantify each priority 1 protein.