

Abstract
Background
Differences in behavioral phenotypes between the two most common subtypes of Prader-Willi syndrome (PWS) [chromosome 15q deletions and maternal uniparental disomy 15 (UPD)] indicate that distinct neural networks may be affected. Though both subtypes display hyperphagia, the deletion subgroup demonstrates reduced behavioral inhibition around food, whereas those with UPD are generally more able to maintain cognitive control over food intake impulses.
Objective
To examine the neural basis of phenotypic differences to better understand relationships between genetic subtypes and behavioral outcomes. We predicted greater food motivation circuitry activity in the deletion subtype and greater activity in higher order cognitive regions in the UPD group, especially after eating.
Design and Subjects
Nine individuals with PWS due to UPD and 9 individuals with PWS due to (type 2) deletion, matched for age, gender, and BMI, underwent fMRI scanning while viewing food images during two food motivation states: one before (pre-meal) and one after (post-meal) eating a standardized 500 kcal meal.
Results
Both PWS subgroups demonstrated greater activity in response to food pre- and post-meal compared to the healthy-weight group. Compared to UPD, the deletion subtype showed increased food motivation network activation both pre- and post-meal, especially in the medial prefrontal cortex and amygdala. In contrast, the UPD group demonstrated greater activation than the deletion subtype post-meal in the dorsolateral prefrontal cortex and parahippocampal gyrus.
Conclusion
These preliminary findings are the first functional neuroimaging findings to support divergent neural mechanisms associated with behavioral phenotypes in genetic subtypes of PWS. Results are discussed within the framework of genetic mechanisms such as haploinsufficiency and gene dosage effects and their differential influence on deletion and UPD subtypes, respectively.
Keywords: hyperphagia, obesity, genetic phenotypes, fMRI, brain activity, Prader-Willi syndrome
INTRODUCTION
Affecting one in 20,000 live births1, Prader-Willi syndrome (PWS) is a contiguous gene syndrome which results from the lack of expression of several imprinted genes in the 15q11-q13 region from the paternal chromosome 15. Phenotypic characteristics of PWS encompass physical (short stature, hypogonadism, narrow bifrontal diameter, obesity), behavioral (skin-picking, obsessive-compulsive behaviors, temper tantrums), and cognitive (intellectual delay, jigsaw puzzle ability) domains2,3.
However, the most striking features of PWS are hyperphagia and obesity. Although initially demonstrating failure to thrive in infancy, around age 2 years, individuals with PWS begin displaying an insatiable appetite that, if left unchecked, leads to obesity by early to middle childhood. Behaviors associated with extreme overeating in PWS include food foraging and hoarding, theft of money in order to purchase food, and consumption of non-food items4,5. Zipf and Bernston6 reported a mean consumption of over three times the normal caloric intake in individuals with PWS when they were allowed to consume sandwich quarters ad libitum. Consequences of unattended hyperphagia in PWS include maintenance of over 200% ideal body weight (in 1/3 of the PWS population) and occasional stomach rupture7 (isolated cases reported). Treatment for hyperphagia and obesity in PWS requires a regimented diet and environmental control which can be successful in preventing obesity5,8,9. Recent studies also document success in obesity prevention using growth hormone treatment10,11. However, like diet and environmental control, growth hormone treatment does little to address hyperphagia in PWS.
In approximately 70% of individuals with PWS, the syndrome results from deletion of genetic material from the paternally donated chromosome number 15. The length of this deletion varies, such that two classes of individuals with the typical deletion have been identified: the longer Type I deletion and the shorter Type II deletion3,12-15. The majority of the remaining individuals with PWS (∼25%) have maternal uniparental disomy (UPD), in which both copies of chromosome 15 are donated by the mother, with no paternal copy. The remaining ∼5% of individuals with PWS have atypical deletions, imprinting center defects, or chromosome 15 translocations.
Individuals with the deletion subtype are more likely to display hypopigmentation, lower weight at birth, high pain threshold, and more “typical” PWS-related facial features2,16,17. Behaviorally, individuals with deletion exhibit more severe problems than those with UPD, including mood swings and skin-picking behaviors, and a higher tendency to overeat and steal food18-20. Conversely, subtype comparisons characterize individuals with UPD as displaying higher verbal IQ scores, greater preference for routine, higher levels of psychosis and social impairments, lower daily living skill scores, and poorer performance on tasks requiring discrimination of moving shapes16,18,21-25.
One of the main goals of specification of PWS subtype phenotypes is to further delineate the function for genes involved in PWS. Currently, approximately 20 genes have been mapped to the ∼6 Mb PWS region, including SNRPN-SNURF, snoRNAs, IPW, NDN, MAGEL2, MKRN3, UBE3A, ATP10A, GABRB3, GABRA5, GABRG3, NIPA1, and NIPA23. Genes involved in the PWS phenotype in general are maternally imprinted and paternally expressed, such that individuals with PWS either have no inherited copy of the paternally expressed genes (deletion subtype), or both maternal gene copies are imprinted and inactivated (UPD subtype), both resulting in the absence of functional paternal alleles for genes in this region.
However, subtle behavioral differences that exist between subtypes might arise from a variety of proposed genetic mechanisms. Haploinsufficiency of genes in the PWS region in the deletion subtype results in the reduced expression of non-imprinted genes in these individuals, a potential explanation for the characterization of a more severe phenotype in individuals with the typical deletion. Alternatively, individuals with PWS due to UPD inherit two copies of maternally expressed genes, resulting in a gene dosage effect with elevated expression of these genes. Furthermore, any imprinted genes distal to 15q11-q13 would be impacted in individuals with UPD but not in individuals with a deletion. When the genes involved in these subtle genetic disruptions happen to be expressed in brain tissue, the results of the disruption might be seen in behavioral differences. Specifically, these mechanisms might lead to variation in the pattern of neural activation in response to stimuli that are salient to the PWS phenotype, including hyperphagia.
Given the effects of hyperphagia on health, family functioning, and quality of life in the PWS population, delineation of its cause remains a critical research objective. Identification of the effect of gene dysregulation on brain development and function represents the overarching goal. Recent functional neuroimaging studies provide evidence for neural system dysfunction related to hyperphagia in PWS. In an fMRI study utilizing a temporal clustering approach, Shapira and colleagues found delayed signal reduction in the hypothalamus, ventromedial prefrontal cortex, insula, and nucleus accumbens following glucose administration in 3 subjects with PWS26 (subtypes not reported). Holsen and colleagues studied 9 individuals with PWS (7 deletion, 2 UPD) using fMRI and found greater activation in the PWS group compared to a matched healthy-weight group in response to food images after eating, suggesting a hyperresponsive neural network and disruption of reward circuitry relating to food motivation in PWS27. Other recent findings provide additional support for reward circuitry dysregulation and a hyperresponsive neural network related to food processing in PWS28,29. Additional reports of greater reward circuitry activation in response to foods of higher calorie content during hunger in individuals with PWS, compared to IQ-matched individuals, suggest that neural mechanisms of hyperphagia in PWS extend beyond a hyperresponsive neural network and, further, cannot be accounted for by differences in cognitive functioning level30. Finally, PET studies document elevated metabolism in prefrontal and temporal lobe regions during a fasted resting state in 16 young children with PWS31 (14 deletion, 2 UPD) and reduced [11C]FMZ binding to GABAA receptors in regions of the prefrontal, temporal, and cingulate cortices in a sample of 6 adults with PWS32 (all deletion). These studies provide evidence of abnormal brain function related to food motivation circuitry in PWS.
Given the potential to link behaviors to subtly variable genetic mechanisms and specific gene action, investigators have recently encouraged a re-examination of phenotype differences between genetic subtypes of PWS20,33. Although some behavioral reports with small sample sizes suggest subtype differences (as noted above), neuroimaging studies examining variation in PWS associated with genetic subtypes have yet to be published. The purpose of this preliminary study was to delineate differences in neural activation in response to food images in UPD and deletion subtypes. We compared individuals with deletion and UPD subtypes in brain activation during pre- and post-meal conditions using fMRI. Based on behavioral studies that suggest less behavioral inhibition related to food motivation in individuals with the deletion (higher rates of overeating, greater tendency to steal food), we expected the deletion group to exhibit greater activation in food motivation areas (i.e., amygdala, OFC, medial PFC, insula, hippocampus, parahippocampal gyrus, and fusiform gyrus) before and after eating, compared to the UPD group. Conversely, we hypothesized that the UPD group would demonstrate a more pronounced neural response than the deletion group after eating in regions associated with cognitive control over decision-making, such as the dorsolateral prefrontal cortex (DLPFC). In addition, we contrasted each group separately to a healthy-weight typical control group in order to replicate, in each subtype, our previous findings of hyperactivation of food motivation regions in a mixed-subtype group of individuals with PWS.
SUBJECTS AND METHODS
Subjects
This study was approved by the Human Subjects Committees at the University of Kansas and University of Rochester Medical Centers. We certify that all applicable institutional and governmental regulations concerning the ethical use of human volunteers were followed during this research. Written informed consent was obtained from parents and assent was obtained from nine individuals with Prader-Willi syndrome (PWS) (7 F/2 M) with the typical Type 2 deletion (DEL group), nine PWS individuals (6 F/3 M) with the UPD subtype (UPD group), and nine typically developing, healthy weight control subjects (6 F/3 M; HWC group). Diagnosis of PWS was confirmed through chromosomal and DNA molecular analysis as previously described18. Concomitant psychotropic medications included (number of subjects in parentheses): DEL group: fluvoxamine (1), quetiapine (1), divalproex (1), topiramate (1), and lorazepam (1); UPD group: fluvoxamine (1), fluoxetine (1), clonazepam (1), escitalopram (1), buspirone (1), trazodone (1), topiramate (1), ziprasidone (1), divalproex (1), risperidone (1), and lithium (1). Additionally, one DEL participant was being treated for hypothyroidism. Among the PWS participants, 5 (2 DEL, 3 UPD) were currently on growth hormone treatment; none had a history of appetite suppressant use.
Groups were matched on age [mean ages (yrs): DEL = 24.4; UPD = 20.3; HWC = 23.6; all t-tests n.s.; see Table 1 for group characteristics]. The HWC group had a significantly lower body mass index (BMI) for age and sex as determined by standardized charts from the United States Centers for Disease Control than both PWS groups (HWC vs. DEL: t = 3.52/p < .01; HWC vs. UPD: t = 3.44/p < .01). DEL and UPD groups did not differ in BMI (t = .09, n.s.) or IQ (t = 1.09, n.s.). One individual in each subject group was left-handed. All subjects were without any history of neurological illness.
Table 1.
Group characteristics: PWS-Deletion type 1 (DEL), PWS-UPD (UPD), and healthy-weight controls (HWC).
| Group | |||
|---|---|---|---|
| DEL M (SD) |
UPD M (SD) |
HWC M (SD) |
|
| Age (yrs) | 24.4 (13.6) | 20.3 (8.2) | 23.6 (11.9) |
| BMI | 32.5 (9.8) | 32.1 (9.7) | 20.7 (2.3) |
| IQ | 64.4 (10.6) | 70.2 (11.8) | N/A |
Three-Factor Eating Questionnaire (TFEQ)
Eating behavior was measured using a modified version of the TFEQ34. The TFEQ assesses degree of dietary restriction [“How often are you (is your child) dieting in a conscious effort to control your (his/her) weight?”], eating disinhibition [“Do you (Does your child) eat sensibly in front of others and splurge alone?”], and hunger level [“How often do you (does your child) feel hungry?”] in a questionnaire format. For the purposes of this study, only the 13 initial items on this questionnaire were used. These questions ask individuals to rate their behavior on a 4-point scale (with lower ratings indicating lower dietary restriction, lower eating disinhibition, and lower hunger levels). For individuals with PWS, parents or guardians completed the TFEQ on their child/ward. Individuals in the HWC group completed a self-report version of the TFEQ.
fMRI acquisition
Scanning was performed on either a 3 Tesla Siemens Allegra or Trio scanner (Siemens, Erlangen, Germany) fitted with a quadrature head coil. Participants’ heads were immobilized with head cushions. Most subjects were scanned at the University of Kansas Medical Center (n = 22; Allegra) with the remaining subjects (all PWS) scanned at the University of Rochester Medical Center (URMC; Trio). One anatomical and two functional sequences were run in each scanning session (i.e., pre-meal and post-meal). T1-weighted anatomical images were acquired using 3D MP-RAGE sequences. At KUMC, coronal orientation, repetition time/echo time (TR/TE) = 23/4 ms, flip angle = 8°, field of view (FOV) = 256 mm, matrix = 256 × 192, slice thickness = 1 mm were used. At URMC, sagittal orientation, TR/TE = 20/4 ms, flip angle = 15°, FOV = 256 mm, matrix = 256 × 256, slice thickness = 1 mm were used. Similar parameters were used at each site for fMRI studies. Single shot gradient echo planar imaging (EPI) fMRI scans were acquired in 43 contiguous coronal slices [TR/TE = 3000/40 ms, flip angle = 90°, FOV = 192 mm, matrix = 64 × 64, slice thickness = 3 mm (0.5 mm skip), in-plane resolution = 3 × 3 mm, 130 data points]. At URMC, a 36 ms echo time was used for the EPI fMRI scans.
We have calculated that one effect of a shorter TE (36 ms) is an increase in the signal-to-noise ratio (SNR) by ∼7% based on the typical T2* in cortical gray matter35, compared with the SNR at TE = 40 ms. The other effect is a decrease of task-induced BOLD signal change by ∼10% compared with that at TE = 40 ms. Since the fMRI contrast-to-noise ratio (CNR) is proportional to the product of SNR and BOLD signal changes, the change of the CNR at TE = 36 ms is estimated at ∼3% reduction compared to that at TE = 40 ms. Therefore, it is expected that the overall effect of the TE difference is not significant and within the range of the experimental variations. Moreover, given the rarity of the population of individuals with PWS (especially individuals with UPD), we believe the compromise of slightly different acquisitions is justified.
Experimental paradigm
Participants viewed pictures of food, animals, and Gaussian-blurred low-level baseline control images during two scanning sessions; one after fasting for four hours (pre-meal condition) and one immediately after eating a small uniform meal (post-meal condition) that was standardized for total number of calories [Kcal = 500], as well as macro- and micronutrient content. The order of sessions (pre-meal, post-meal) was counterbalanced across subjects. All subjects fasted for 4 hours prior to eating in the pre-meal condition. In the post-meal condition, the meal was consumed outside the scanner and the scan begun within 15 minutes of completing the meal.
Activation paradigm
Visual stimuli of two categories (food and blurred baseline control images) were obtained from LaBar and colleagues36. Due to the mental and chronological age of some of the participants in this study, the comparison stimuli were animals to keep participants attentive to the task and to control for general familiarity. All images for the animal category were obtained from professional stock CD-ROMs and matched to food and blurred control images on brightness, resolution, and size. Each image was presented one time only to each subject during the fMRI scanning.
Each functional scan involved three repetitions of each block for stimulus condition type (i.e., food, animal), alternated between blocks of blurred images. Visual stimuli were projected through 3D limited view goggles (Resonance Technology, Inc., Northridge, California) controlled by the stimuli-generating computer program (NeuroSTIM, Neuroscan, El Paso, TX). Stimulus presentation time was 2.5 seconds, with an interstimulus interval (ISI) of 0.5 seconds. Within each of the two functional scans there were 13 blocks of stimulus presentation; within each block, 10 images were presented. The order of category presentation was counterbalanced across subjects.
To ensure that participants were attending to the stimuli being presented, they were instructed to remember images for a memory test following the scanning session. From each of the food and animal groups, approximately 50% of the images used in the scanning session were chosen for recall and interspersed with novel distracter images from the same category. Participants completed a recognition memory test outside the scanner, immediately following each scanning session. Participants were instructed to press one key if they had seen the image in the scanner (old) and another key if they had not seen the image (new).
fMRI data analysis
fMRI data were analyzed using the BrainVoyager QX statistical package (version 1.8; Brain Innovation, Maastricht, Netherlands). Preprocessing steps included trilinear 3D motion correction, sinc-interpolated slice scan time correction, 3D spatial smoothing with 4 mm Gaussian filter, and high pass filter temporal smoothing. Functional images were realigned to the anatomic images obtained within each session and normalized to the BrainVoyager template image, which conforms to the space defined by Talairach and Tournoux’s stereotaxic atlas37. Motion in any run of more than 4 mm along any axis (x, y, or z) resulted in the discard of that run. In addition, behavioral evidence of diminished attention due to excessive sleepiness resulted in discard of that run. From each group, runs that met these criteria were discarded (DEL: 4 runs; UPD: 10 runs; HWC: 0 runs).
Activation maps were analyzed using statistical parametric methods38 as implemented in the BrainVoyager QX software. Statistical contrasts were conducted using multiple regression analysis with the general linear model (GLM), allowing for multiple predictors to be built into the model. Regressors representing the experimental conditions of interest wer modeled with a hemodynamic response filter and entered into the multiple-regression analysis using a fixed-effects model. Contrasts between conditions of interest were assessed with t statistics. Statistical parametric maps were overlaid on three-dimensional renderings of an averaged-group brain.
Analysis began with between-group comparisons (DEL vs. HWC, UPD vs. HWC) of response to food vs. baseline images separately within each session (pre- and post-meal). These analyses were carried out to determine whether each PWS genetic group showed activation patterns that were different from the healthy weight group and to replicate findings we previously reported comparing a group of individuals with PWS (with mixed genetic status) to healthy weight individuals. For this set of analyses, our a priori regions of interest (ROIs), based on findings from previous studies using similar paradigms36,41, included the amygdala, orbitofrontal cortex (OFC), medial prefrontal cortex (mPFC), insula, hippocampus, parahippocampal gyrus (PHG), fusiform gyrus (FG). Next, we performed direct within-group comparisons of pre-meal vs. post-meal food vs. baseline response in the PWS groups (DEL: Pre-meal vs. Post-meal; UPD: Pre-meal vs. Post-meal). This was to assess food motivation network activity modulation across different states of motivation within each individual PWS group. Finally, our main group interaction analysis (DEL vs. UPD) examined response to food (vs. baseline) within each state (pre- and post-meal) in order to investigate genetic subtype group differences in response to food stimuli. Our a priori ROIs for these sets of analyses were the amygdala, OFC, mPFC, dorsolateral prefrontal cortex (DLPFC), insula, hippocampus, PHG, and FG. For all sets of analyses, voxel values in our a priori ROIs were considered significant if the activation survived a statistical threshold of p < .0001 (uncorrected for multiple comparisons) and had a minimum cluster size of 4 voxels. Other areas were considered significant if they exceeded a threshold of p < .00001 (uncorrected for multiple comparisons) and had a minimum cluster size of 20 voxels.
RESULTS
Behavioral Data
TFEQ Scores
Group comparisons on TFEQ scores were carried out in order to establish whether groups differed in eating behavior and general level of hunger. As expected, mean scores for individuals in the HWC group were significantly lower than both PWS groups (HWC: 2.24 ± 0.17; DEL: 3.00 ± 0.41; UPD: 2.87 ± 0.45; t = 5.12/p < 0.01 and t = 3.92/p < 0.01, respectively). Deletion and UPD groups did not differ in their mean TFEQ score (t = 0.61, n.s.).
Memory Task Performance
Overall performance (defined as percent discriminibility according to signal detection theory) on the memory task (pre-meal and post-meal combined) was significantly better than chance for the DEL (t = 8.09/p < .01), UPD (t = 6.73/p < .01), and the HWC groups (t = 12.83/p < .01), with similar results achieved when broken down by session (pre-meal and post-meal). Direct comparison between the DEL and UPD groups revealed an insignificant trend towards better performance in the UPD group (70.83% ± 10.47) compared to the DEL group (64.47% ± 5.61) in the pre-meal condition (t = 1.59, p =.13). PWS groups did not differ on memory performance in the post-meal condition (DEL: 66.88% ± 8.36; UPD: 61.76 ± 10.64; t = 1.11/n.s.).
fMRI Data: Comparison of PWS subtypes to HWC group
DEL vs. HWC: Pre-meal Response
In order to establish whether the DEL group exhibited a different pattern of response compared with the HWC group, we completed a between-group comparison of activation to food vs. baseline during the pre-meal state. Individuals in the DEL group exhibited greater activation pre-meal compared to the HWC group in several a priori ROIs, including the amygdala, mPFC (BA 10), insula, hippocampus, and PHG (BA 30/34), and in the middle frontal gyrus (MFG; BA 6/8/9/10), superior frontal gyrus (SFG; BA 6/8/9/10), cingulate gyrus (CING), uncus, precentral gyrus (PreC), postcentral gyrus (PostC), middle temporal gyrus (MTG), superior temporal gyrus (STG), and inferior parietal lobule (IPL). The HWC > DEL contrast yielded activation in the OFC (BA 47), insula, FG, inferior frontal gyrus (IFG; BA 6), MFG (BA 6/9/46), SFG (BA 6/8), CING, PreC, STG, IPL, and lingual gyrus.
UPD vs. HWC: Pre-meal Response
PWS individuals in the UPD group exhibited greater activation than the HWC group in the food vs. baseline contrast pre-meal in the mPFC (BA 10), insula, hippocampus, PHG (BA 30), IFG (BA 44/46), MFG (BA 6/8/9/10), SFG (BA 6/8/9/10), CING, MTG, STG, IPL, superior parietal lobule (SPL), paracentral lobule, precuneus, and middle occipital gyrus (OG). In contrast, the HWC group demonstrated greater activation than the UPD group in the amygdala, OFC (BA 47), insula, PHG (BA 26/27/28/34), MFG (BA 6/46), SFG (BA 6/10), IFG (BA 9/44/45), CING, PreC, MTG, transverse temporal gyrus (TTG), STG, IPL, SPL, angular gyrus, lingual gyrus, and precuneus.
DEL vs. HWC: Post-meal Response
This comparison revealed greater DEL than HWC response in the amygdala, mPFC (BA 8/9), OFC (BA 47), insula, hippocampus, PHG (BA 30), IFG (BA 45/47), MFG (BA 6/10), SFG (BA 6/8), CING, PostC, MTG, TTG, STG, and SPL. The HWC group exhibited greater activation in response to food stimuli than the DEL group in regions of the mPFC (BA 6), insula, FG, MFG (BA 9/10/46), SFG (BA 10), CING, PreC, STG, IPL, SPL, angular gyrus, lingual gyrus, supramarginal gyrus (SMG), and precuneus.
UPD vs. HWC: Post-meal Response
Similar to the DEL vs. HWC comparison, the UPD group exhibited greater activation than the HWC group post-meal in the mPFC (BA 8/9), insula, hippocampus, PHG (BA 19/30), FG, IFG (BA 9/47), MFG (BA 6/8/9/10), SFG (BA 6/8/9), CING, MTG, STG, IPL, SMG, and precuneus. The HWC group demonstrated greater post-meal activation than the UPD group in the mPFC (BA 6), FG, IFG (BA 9), MFG (BA 9/46), PreC, IPL, and precuneus.
fMRI Data: Comparison of Pre-meal and Post-meal Activation in DEL and UPD Groups
DEL: Pre-meal vs. Post-meal Response
Individuals in the DEL group demonstrated greater activity pre-meal than post-meal in response to food in the mPFC (BA 10), PHG (BA 28), FG (BA 20), IFG (BA 46), MFG (BA 8), SFG (BA 6/9/10), PreC, SPL, and SMG. Conversely, the DEL group responded to a greater degree post-meal than pre-meal in the OFC (BA 47), mPFC (BA 9), PHG (BA 36), FG (BA 37), IFG (BA 47), MFG (BA 9), SFG (BA 6/9), CING, PostC, paracentral lobule, precuneus, and hypothalamus.
UPD: Pre-meal vs. Post-meal Response
In the UPD group, we found greater activity pre-meal than post-meal in the insula, CING, STG, and IPL. The UPD group demonstrated greater post-meal than pre-meal response to food vs. baseline in the DLPFC (BA 8/46), hippocampus, PHG (BA 46), FG (BA 37), IFG (BA 9), PreC, ITG, MTG, and STG.
fMRI Data: Comparison of DEL and UPD Groups
DEL vs. UPD: Pre-meal Response
The main contrasts of interest for this investigation centered on directly comparing PWS genetic subtypes in their neural response to food images before and after eating. For the pre-meal contrast, individuals in the DEL group exhibited greater activation than the UPD group in the a priori ROIs of the amygdala, mPFC, insula, hippocampus, and PHG, as well as in several frontal regions, including the IFG, MFG, SFG, PreC, PostC, and in the MTG, TTG, STG, SMG, and caudate (see Table 2 and Figure 1). The UPD group showed a stronger BOLD response to food images pre-meal compared to the DEL group in the PHG and FG, in the MFG and CING, and in several temporal lobe and posterior regions, including the ITG, SPL, angular gyrus, paracentral lobule, precuneus, and middle OG.
Table 2.
Regions reaching significance for the between-group analysis (DEL vs. UPD group) contrast between food and baseline stimuli categories in the pre-meal state (a priori regions: p < .0001, uncorrected for multiple comparisons; whole-brain: p < .00001, uncorrected for multiple comparisons).
| Contrast | Region | Brodmann’s area |
Coordinates | t | ||
|---|---|---|---|---|---|---|
| DEL > UPD: Pre-Meal: Food > Baseline | x | y | z | |||
| Inferior Frontal gyrus | 45 | 57 | 23 | 7 | 4.78 | |
| 45 | 36 | 41 | 4 | 5.41 | ||
| 45 | 51 | 35 | 4 | 5.64 | ||
| 44 | 57 | 5 | 16 | 8.66 | ||
| 13 | -42 | 20 | 7 | 4.22 | ||
| 9 | -53 | 2 | 25 | 7.63 | ||
| Middle Frontal gyrus | 9 | -24 | 29 | 34 | 5.16 | |
| 9 | -39 | 17 | 28 | 5.35 | ||
| 9 | 42 | 20 | 31 | 6.80 | ||
| Medial Frontal gyrus | 6 | 3 | -4 | 52 | 5.68 | |
| 6 | 6 | 32 | 37 | 5.98 | ||
| Superior Frontal gyrus | 10 | 9 | 60 | 25 | 4.82 | |
| 10 | -18 | 50 | 25 | 4.53 | ||
| 9 | 36 | 35 | 31 | 5.38 | ||
| 8 | 0 | 17 | 52 | 7.14 | ||
| 6 | -6 | 5 | 67 | 6.06 | ||
| 6 | 9 | -4 | 67 | 6.96 | ||
| Amygdala | -- | 24 | -1 | -18 | 4.27 | |
| -- | 21 | -7 | -20 | 4.50 | ||
| Insula | -- | -30 | 20 | 10 | 5.22 | |
| -- | -30 | -28 | 10 | 4.40 | ||
| Hippocampus | -- | 33 | -19 | -20 | 4.05 | |
| Parahippocampal gyrus | 36 | 33 | -24 | -20 | 4.23 | |
| Precentral gyrus | 44 | -51 | 5 | 10 | 6.83 | |
| 6 | -33 | -1 | 31 | 6.35 | ||
| 6 | 39 | -7 | 49 | 6.91 | ||
| 6 | 42 | 2 | 28 | 5.10 | ||
| 4 | 44 | -16 | 43 | 5.37 | ||
| 4 | 57 | -16 | 37 | 5.01 | ||
| Postcentral gyrus | 3 | 64 | -10 | 25 | 5.23 | |
| Middle Temporal gyrus | 21 | 57 | -31 | -5 | 5.31 | |
| Superior Temporal gyrus | 41 | -57 | -22 | 10 | 5.91 | |
| 38 | 33 | 5 | -20 | 6.13 | ||
| 22 | -48 | -31 | 7 | 4.99 | ||
| Supramarginal gyrus | 40 | -36 | -46 | 34 | 5.18 | |
| Caudate | -- | 12 | 8 | 22 | 5.67 | |
| UPD > DEL: Pre-Meal: Food > Baseline | x | y | z | |||
| Inferior Frontal gyrus | 47 | 36 | 17 | -14 | 3.91 | |
| Middle Frontal gyrus | 9 | 57 | 14 | 34 | 4.43 | |
| Medial Frontal gyrus | 8 | 6 | 53 | 43 | 4.33 | |
| Inferior Temporal gyrus | 37 | 45 | -64 | 1 | 8.55 | |
| Anterior Cingulate gyrus | 32 | 12 | 23 | 19 | 6.16 | |
| Parahippocampal gyrus | 37 | 33 | -37 | -5 | 4.58 | |
| 36 | 24 | -31 | -17 | 6.11 | ||
| Posterior Cingulate gyrus | 29 | 3 | -49 | 13 | 6.67 | |
| Fusiform gyrus | 37 | -36 | -40 | -8 | 5.25 | |
| Angular gyrus | 39 | -45 | -67 | 28 | 4.71 | |
| Superior Parietal lobule | 7 | -33 | -49 | 52 | 4.77 | |
| Paracentral lobule | 5 | 0 | -43 | 58 | 5.72 | |
| Precuneus | 31 | 15 | -68 | 22 | 7.15 | |
| 31 | 3 | -67 | 28 | 5.79 | ||
| Middle Occipital gyrus | 19 | -39 | -68 | 7 | 6.09 | |
Figure 1.
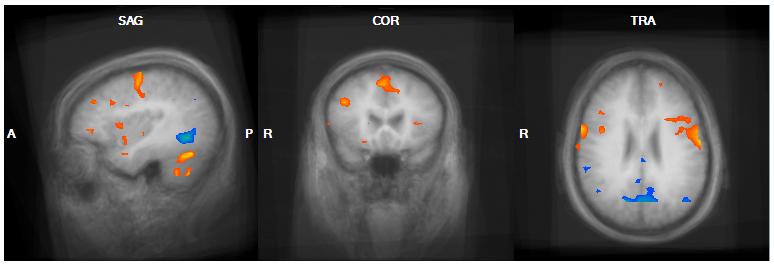
Genetic subtype comparison of the food > baseline contrast in the Pre-Meal condition. Regions demonstrating greater activation in the DEL group compared to the UPD group are shown in orange and include the bilateral DLPFC, right insula, right fusiform gyrus, and bilateral premotor and motor cortex. UPD > DEL regions in the food>baseline contrast are shown in blue and include the posterior cingulate gyrus and left MTG.
DEL vs. UPD: Post-meal Response
Comparison of DEL and UPD groups post-meal indicated greater activation in the DEL group in the mPFC, and several additional frontal regions, including the MFG, SFG, and CING (see Table 3 and Figure 2). Individuals in the UPD group, conversely, exhibited greater activation post-meal in a contrasting set of food motivation areas, including the DLPFC, PHG, and FG. In addition, the UPD>DEL contrast yielded activation in the IFG and SFG, and in several motor, temporal, and posterior regions, including the PreC, PostC, MTG, STG, IPL, and SMG.
Table 3.
Regions reaching significance for the between-group analysis (DEL vs. UPD group) contrast between food and baseline stimuli categories in the post-meal state (a priori regions: p < .0001, uncorrected for multiple comparisons; whole-brain: p < .00001, uncorrected for multiple comparisons).
| Contrast | Region | Brodmann’s area |
Coordinates | t | ||
|---|---|---|---|---|---|---|
| DEL > UPD: Post-Meal: Food > Baseline | x | y | z | |||
| Medial Frontal gyrus | 9 | 15 | 38 | 22 | 5.39 | |
| Middle Frontal gyrus | 46 | 51 | 41 | 16 | 5.82 | |
| 9 | 54 | 26 | 31 | 4.13 | ||
| 9 | 45 | 20 | 28 | 4.53 | ||
| 6 | 36 | 14 | 55 | 5.50 | ||
| Superior Frontal gyrus | 9 | 12 | 56 | 25 | 4.86 | |
| 8 | 12 | 35 | 43 | 4.25 | ||
| 6 | 9 | 26 | 58 | 5.21 | ||
| Cingulate gyrus | 31 | 15 | -52 | 25 | 4.76 | |
| 31 | 6 | -37 | 40 | 4.92 | ||
| Cerebellum | -- | 39 | -64 | -21 | 6.24 | |
| -- | -36 | -63 | -23 | 7.19 | ||
| -- | 51 | -52 | -26 | 11.00 | ||
| UPD > DEL: Post-Meal: Food > Baseline | ||||||
| Inferior Frontal gyrus | 9 | -54 | 20 | 25 | 4.13 | |
| Middle Frontal gyrus | 10 | -24 | 47 | 10 | 5.46 | |
| 10 | -36 | 50 | 13 | 4.98 | ||
| 9 | -39 | 32 | 34 | 7.78 | ||
| 6 | -27 | -10 | 61 | 5.27 | ||
| Medial Frontal gyrus | 6 | -3 | -1 | 55 | 4.69 | |
| Superior Frontal gyrus | 8 | -18 | 35 | 52 | 4.80 | |
| 8 | -21 | 41 | 43 | 4.31 | ||
| 8 | -9 | 44 | 52 | 4.96 | ||
| Parahippocampal gyrus | 36 | -30 | -31 | -17 | 4.33 | |
| 30 | -21 | -49 | 1 | 5.44 | ||
| 19 | 33 | -52 | -2 | 7.87 | ||
| Precentral gyrus | 6 | -52 | 2 | 43 | 7.47 | |
| Postcentral gyrus | 2 | -57 | -25 | 43 | 4.03 | |
| 40 | 60 | -28 | 22 | 4.90 | ||
| Middle Temporal gyrus | 37 | -36 | -61 | -2 | 7.73 | |
| Superior Temporal gyrus | 22 | 63 | -19 | 1 | 5.45 | |
| Fusiform gyrus | 37 | -39 | -43 | -17 | 5.09 | |
| 37 | 48 | -37 | -8 | 6.42 | ||
| 20 | 39 | -40 | -17 | 5.39 | ||
| Inferior Parietal lobule | 40 | -57 | -49 | 37 | 6.06 | |
| Supramarginal gyrus | 40 | 57 | -46 | 23 | 6.34 | |
Figure 2.

Genetic subtype comparison of the food > baseline contrast in the Post-Meal condition. Regions demonstrating greater activation in the DEL group compared to the UPD group in the food>baseline contrast are shown in orange; UPD > DEL regions are shown in blue. A) DEL>UPD activation centered on the right mPFC (15, 38, 28). B) UPD>DEL activation centered on the left DLPFC (-39, 32, 34). Both A and B additionally demonstrate UPD>DEL activation in the left MTG and left supramarginal gyrus and DEL>UPD activation in the posterior cingulate gyrus and left occipital lobe/cerebellum.
DISCUSSION
Recent reports identifying genetic markers in the 15q11-q13 region have allowed for more detailed delineation of gene-brain-behavior relationships in this syndrome3,39,40. In this exploratory study, we capitalized on those findings and recent advances in neuroimaging tools to examine possible variation between genetic subtypes of PWS in brain activation patterns linked to hyperphagia, the most striking phenotypic behavior associated with PWS. To our knowledge, this is the first report to examine subtype differences in brain activation in the PWS population. Current findings, though preliminary, suggest divergent patterns of neural activity in response to food images in deletion and UPD groups. Overall, individuals in the deletion group showed greater and more widespread brain activation to food images compared to the UPD group, both before and after eating. Further, consistent with our previous findings in a mixed-subtype group of individuals with PWS, we report striking differences between each genetic subtype group and the matched healthy weight control group in their brain response to food stimuli before and after eating.
Based on behavioral studies documenting poor behavioral inhibition (especially in situations involving food) amongst PWS individuals with the deletion subtype, we expected greater activation in this group compared to the UPD group in frontal and limbic regions associated with food motivation. In support of this hypothesis, the deletion group showed a more robust response than the UPD group pre-meal in several food processing regions associated with reward and affect-driven motivation, including the mPFC, insula and amygdala, and in widespread frontal regions including the IFG, MFG, and SFG. Post-meal, the deletion group exhibited greater activity than the UPD group in the mPFC. Overall, these regions are similar to those we found for differences in the comparison between a mixed-subtype PWS group compared to a healthy-weight control group27. Further, this circuitry has previously been shown to respond to food-related stimuli in the hungry state in healthy weight individuals and is associated with emotional and food-related processing36,41.
The mPFC is associated with integration of visceral and reward-based signaling, and is consistently reported to show greater activation in obese individuals after eating42,43. The mPFC is closely connected to the OFC, which is involved in stimulus reward evaluation in concert with direct multisensory input44. With these inputs and reciprocal connections to the hypothalamus, the mPFC is uniquely situated to process visceromotor signals45. Previous reports on neural mechanisms of hyperphagia have noted strong mPFC activation in individuals with PWS, most of whom had the deletion subtype27-30. Interestingly, Hinton and colleagues reported a lack of association between activation in the medial PFC and ratings of the reward value of various foods in a group of PWS individuals with deletion, suggesting that although these individuals do not have higher ratings on food desirability compared to control groups, they display hyperactivity in regions associated with behavioral disinhibition and lack of self-control46. We propose that higher levels of activation in the deletion group, especially in the mPFC, might be associated with the behavioral observation of a higher level of preoccupation with food in this group.
Consistent with our predictions, individuals with UPD demonstrated stronger brain activation post-meal in food processing regions associated with higher cognition, including the DLPFC, and PHG. The lateral PFC maintains direct connections with sensory and nearby motor networks, and is indirectly connected to limbic regions, well situating it for a role in integration of sensory cues, reward signals, and voluntary motor control47. Top-down processing in the lateral PFC allows regions such as the DLPFC to influence processing in other regions in order to obtain a common goal. This role in cognitive control might extend to decision-making related to food intake, as suggested by findings of increased DLPFC activity during satiation in a group of successful dieters48. For PWS individuals with UPD, this might imply a more intact ability to recruit the DLPFC after eating, which allows for the influence of decision making processing in response to viewing foods that, although highly reinforcing (a reward based response), would not be beneficial to their long-term health (a cognitive judgment). This evidence of more intact cognitive processing might be related to higher verbal IQ levels in this subtype group22.
The DLPFC is also involved in working memory, including holding reward value in mind while judging potential outcomes of a given set of behavioral responses47. In light of the finding of a greater BOLD response in the PHG in individuals with UPD, this suggests that cognitive processes involved in food processing in individuals with UPD relate to memory functioning, despite the fact that behavioral results failed to reveal a significant difference between UPD and deletion groups in memory task performance. Finally, PWS individuals with UPD demonstrated greater activity in posterior regions involved in visual processing, suggesting a neural basis for differential visual processing in those with UPD, which has previously been reported21.
Paternally-biased genes are susceptible to haploinsufficiency in the deletion subtype of PWS. The GABA-A receptor subunit gene GABRB3 has higher levels of expression in lymphoblastoid and frontal cortical brain tissue in individuals with UPD compared to the deletion subtype40,49. Lucignani and colleagues demonstrated reduced GABA-A receptor binding in food motivation areas using positron emission tomography (PET) in individuals with the deletion subtype32. GABRB3, which codes for the GABA-A β3 receptor subunit, is preferentially expressed in the hypothalamus50. The GABRB3 knockout mouse has a striking neurological phenotype, displaying hyperactivity and learning and memory deficits, accompanied by findings of decreased benzodiazepine binding in the cortex, hippocampus, striatum, and thalamus51,52. This suggests that the GABRB3 gene might be involved in the behavioral phenotype of PWS, especially the deletion subtype.
Paternally expressed genes include NDN, MAGEL2, and SNRPN-SNURF. Expressed in murine hypothalamus, OFC, and anterior cingulate cortex, NDN is a neuronal cell regulator that acts to attenuate apoptosis of postmitotic neurons53 and promotes differentiation of GABAergic neurons in the mouse forebrain54,55. Cytoarchitecture in the developing brain is heavily influenced by the presence of NDN, as implied through abnormal neural cell migration and irregular axonal tract projection in the NDN knockout mouse56. The NDN knockout mouse exhibits decreased oxytocin-producing cells in the paraventricular nucleus of the hypothalamus57. MAGEL2 is also highly expressed in the murine hypothalamus and has been shown to be preferentially expressed in the SCN and SON of the hypothalamus, suggesting it might be a marker for hypothalamic secretory neuron development55. The MAGEL2 gene knockout mouse has an increased vulnerability to obesity, increased fat deposition in abdomen, decreased lean muscle mass, abnormal circadian pattern of food intake58. The SNRPN-SNURF gene, highly expressed in the hypothalamus, OFC and ACC of the murine brain55, is involved in mRNA splicing in the brain and appears to aid in the regulation of imprinting in the PWS region of chromosome 15. Overall, these findings converge to suggest unique roles for NDN, MAGEL2, and SNRPN-SNURF in influencing development of behavior which might influence food motivation regions in the brain.
As opposed to haploinsufficiency mechanisms, maternally expressed genes such as UBE3A might be subject to gene dosage effects in PWS individuals with UPD. In the UPD subtype compared to the deletion subtype, this gene shows elevated expression in human lymphoblasts40,49. UBE3A is expressed in human frontal cortical tissue40, with its expression demonstrating increased specificity in certain brain regions over the course of development59. UBE3A expression is high in the developing hypothalamus, but not in mature adult hypothalamic tissue. Further, studies have demonstrated that the maternal allele is necessary for expression of UBE3A in hippocampal and cerebellar Purkinje cells59. Joseph and colleagues reported relative sparing of visual recognition skills in individuals with UPD, implying a beneficial effect of overexpression of UBE3A (i.e., a gene dosage effect) on learning and memory processes in this subtype60. These findings fit well with our current results of greater UPD activation in memory-related regions.
Although this study provides initial evidence of differences between UPD and deletion subtypes in patterns of neural activity associated with food motivation, a number of methodological challenges limit the generalizability of these preliminary findings. Despite best efforts, including nationwide recruitment, we utilized relatively small sample sizes, a fixed-effects analytic approach, and lack of correction for multiple comparisons, which might have decreased the power available to detect group differences and which prevent extrapolation to the PWS population as a whole. Several factors contributed to this issue, including rarity of the disorder, difficulty finding eligible and compliant subjects, and limited ability to use all subject data due to subject movement and tendency to fall asleep during scanning, a result of excessive daytime sleepiness common in PWS. In addition, we were only able to recruit a small number of individuals with deletion type I. This subtype is less common, and individuals with deletion type I exhibited increased behavioral problems, leading to incomplete scanning sessions for those who were recruited.
Further, although our groups were matched on age, we used subjects from a wide age range (10-48), which might have introduced age-related variation in brain structure and physiology to our combined sample. Although sampling from such a wide age range was inevitable given the rarity of the disorder, future investigations should attempt to utilize narrower age ranges. Several of our participants with PWS were also taking psychoactive medications, which might have altered neural responses to the stimuli. Psychotropic medications are commonly prescribed in the PWS population, (47% of individuals with deletion and 74% of individuals with UPD) even for those without psychopathology61. These high rates of medication use make it difficult to recruit medication-free participants. Future neuroimaging studies on PWS should attempt to include as many medication-free individuals as possible in order to reduce possible confounds. Finally, we combined data that was acquired under slightly different imaging parameters; namely a difference in TE (36 ms vs. 40 ms). However, as detailed in the methods section, the potential consequence of this difference on our between-group findings was estimated at a ∼3% difference in the contrast-to-noise ratio, suggesting an overall negligible effect not greater than the expected experimental variation.
In summary, we report greater activity, in response to food stimuli before and after eating, across the food motivation network in PWS individuals with the typical deletion (specifically Type II subtype), compared to those with UPD, especially in the medial prefrontal cortex and amygdala, regions involved in emotional processing and visceromotor integration. The UPD group also demonstrated more activity in the DLPFC and PHG than the deletion group after eating, suggesting greater utilization of regions associated with cognitive control and memory. These unique patterns of activation match closely with behavioral evidence of decreased inhibition in the deletion subtype and greater restraint in the UPD group in situations involving food. These findings provide preliminary evidence for distinct gene-brain-behavior relationships in subtypes of PWS and suggest potential avenues for exploration of specific gene functions, especially for maternally imprinted or paternally expressed genes in the 15q11-q13 region.
ACKNOWLEDGEMENTS
This study was supported by grants from the National Institutes of Health (HD041672), the Hall Family Foundation, and the Heartland Genetics and Newborn Screening Collaborative (HRSA U22MC03962-02). Dr. Brooks received support from NIH (NS039123, HD050534, AG029615, AG026482, AG026374, and RR015563). Dr. Butler is also supported by NIH (RR019478). The Hoglund Brain Imaging Center is supported by the Hoglund Family Foundation. The authors are grateful to Sang-Pil Lee, Allan Schmitt, Muriel Williams and Pat Weber for technical assistance and Stacey Ward, Jean Reeves, and Jean Guadagnino for help in project coordination.
REFERENCES
- 1).Whittington JE, Holland AJ, Webb T, Butler J, Clarke D, Boer H. Population prevalence and estimated birth incidence and mortality rate for people with Prader-Willi syndrome in one UK Health Region. J Med Genet. 2001;38:792–798. doi: 10.1136/jmg.38.11.792. [DOI] [PMC free article] [PubMed] [Google Scholar]
- 2).Butler MG. Prader-Willi Syndrome: current understanding of cause and diagnosis. Am J Med Genet. 1990;35:319–332. doi: 10.1002/ajmg.1320350306. [DOI] [PMC free article] [PubMed] [Google Scholar]
- 3).Bittel DC, Butler MG. Prader-Willi syndrome: clinical genetics, cytogenetics and molecular biology. Expert Rev Mol Med. 2005;7:1–20. doi: 10.1017/S1462399405009531. [DOI] [PMC free article] [PubMed] [Google Scholar]
- 4).Clarke DJ, Boer H. Problem behaviors associated with deletion Prader-Willi, Smith-Magenis, and cri du chat syndromes. Am J Ment Retard. 1998;103:264–271. doi: 10.1352/0895-8017(1998)103<0264:PBAWDP>2.0.CO;2. [DOI] [PubMed] [Google Scholar]
- 5).Holm VA, Pipes PL. Food and children with Prader-Willi syndrome. Am J Dis Child. 1976;130:1063–1067. doi: 10.1001/archpedi.1976.02120110025003. [DOI] [PubMed] [Google Scholar]
- 6).Zipf WB, Bernston GG. Characteristics of abnormal food-intake patterns in children with Prader-Willi syndrome and study of effects of naloxone. Am J Clin Nutr. 1987;46:277–281. doi: 10.1093/ajcn/46.2.277. [DOI] [PubMed] [Google Scholar]
- 7).Stevenson DA, Heinemann J, Angulo M, Butler MG, Loker J, Rupe N, et al. Gastric rupture and necrosis in Prader-Willi syndrome. J Pediatr Gastroenterol Nutr. 2007;45:272–274. doi: 10.1097/MPG.0b013e31805b82b5. [DOI] [PMC free article] [PubMed] [Google Scholar]
- 8).Butler MG. Management of obesity in Prader-Willi syndrome. Nat Clin Pract Endocrinol Metab. 2006;2:592–593. doi: 10.1038/ncpendmet0320. [DOI] [PMC free article] [PubMed] [Google Scholar]
- 9).Butler MG, Jacobsen D, Smith BK, Donnelly JE. Genetics and obesity: Prader-Willi syndrome, an illustrative example. In: Ling PR, editor. Focus on Obesity Research. Nova Science Publishers, Inc.; Hauppauge, NY: 2005. pp. 51–88. [Google Scholar]
- 10).Bosio L, Beccaria L, Benzi F, Sanzari A, Chiumello G. Body composition during GH treatment in Prader-Labhart-Willi syndrome. J Pediatr Endocrinol Metab. 1999;12:351–353. [PubMed] [Google Scholar]
- 11).Carrel AL, Myers SE, Whitman BY, Allen DB. Growth hormone improves body composition, fat utilization, physical strength and agility, and growth in Prader-Willi syndrome: a controlled study. J Pediatr. 1999;134:215–221. doi: 10.1016/s0022-3476(99)70418-x. [DOI] [PubMed] [Google Scholar]
- 12).Mewborn SK, Milley NL, Fantes JA, Brown RL, Butler MG, Christian SL, et al. Break point junction fragments in Prader-Willi and Angelman syndrome (PWS/AS) deletion patients reveal variable breakpoints within large duplicons. Am J Hum Genet. 2002;71:A298. [Google Scholar]
- 13).Nicholls RD, Knepper JL. Genome organization, function, and imprinting in Prader-Willi and Angelman syndromes. Annu Rev Genom Hum Genet. 2001;2:153–175. doi: 10.1146/annurev.genom.2.1.153. [DOI] [PubMed] [Google Scholar]
- 14).Ungaro P, Christian SL, Fantes JA, Mutirangura A, Black S, Reynolds J, et al. Molecular characterization of four cases of intrachromosomal triplication of chromosome 15q11–q14. Am J Med Genet. 2001;38:26–34. doi: 10.1136/jmg.38.1.26. [DOI] [PMC free article] [PubMed] [Google Scholar]
- 15).Butler MG, Fischer W, Kibiryeva N, Bittel DC. Array comparative genomic hybridization (aCGH) analysis in Prader-Willi Syndrome. Am J Med Genet. 2008;146:854–860. doi: 10.1002/ajmg.a.32249. [DOI] [PMC free article] [PubMed] [Google Scholar]
- 16).Cassidy SB, Forsythe M, Heeger S, Nicholls RD, Schork N, Benn P, Schwartz S. Comparison of phenotype between patients with Prader-Willi syndrome due to deletion 15q and uniparental disomy 15. Am J Med Genet. 1997;68:433–440. [PubMed] [Google Scholar]
- 17).Gillessen-Kaesbach G, Robinson W, Lohmann D, Kaya-Westerloh S, Passarge E, Horsthemke B. Genotype-phenotype correlation in a series of 167 deletion and non-deletion patients with Prader-Willi syndrome. Hum Genet. 1995;96:638–643. doi: 10.1007/BF00210291. [DOI] [PubMed] [Google Scholar]
- 18).Butler MG, Bittel DC, Kibiryeva N, Talebizadeh Z, Thompson T. Behavioral differences among subjects with Prader-Willi syndrome and type I or type II deletion and maternal disomy. Pediatrics. 2004;113:565–573. doi: 10.1542/peds.113.3.565. [DOI] [PMC free article] [PubMed] [Google Scholar]
- 19).Hartley SL, MacLean WE, Butler MG, Zarcone J, Thompson T. Maladaptive behaviors and risk factors among the genetic subtypes of Prader-Willi syndrome. Am J Med Genet. 2005;136:140–145. doi: 10.1002/ajmg.a.30771. [DOI] [PMC free article] [PubMed] [Google Scholar]
- 20).Webb T, Whittington J, Clarke D, Boer H, Butler J, Holland A. A study of the influence of different genotypes on the physical and behavioral phenotypes of children and adults ascertained clinically as having PWS. Clin Genet. 2002;62:273–281. doi: 10.1034/j.1399-0004.2002.620404.x. [DOI] [PubMed] [Google Scholar]
- 21).Fox R, Yang GS, Feurer ID, Butler MG, Thompson T. Kinetic form discrimination in Prader-Willi syndrome. J Intell Disabil Res. 2001;45:317–325. doi: 10.1046/j.1365-2788.2001.00326.x. [DOI] [PMC free article] [PubMed] [Google Scholar]
- 22).Roof E, Stone W, MacLean W, Feurer ID, Thompson T, Butler MG. Intellectual characteristics of Prader-Willi syndrome: comparison of genetic subtypes. J Intellect Disabil Res. 2000;44:25–30. doi: 10.1046/j.1365-2788.2000.00250.x. [DOI] [PMC free article] [PubMed] [Google Scholar]
- 23).Torrado M, Araoz V, Baialardo E, Abraldes K, Mazza C, Krochik G, et al. Clinical-etiologic correlation in children with Prader-Willi syndrome (PWS): an intradisciplinary study. Am J Med Genet. 2007;143A:460–468. doi: 10.1002/ajmg.a.31520. [DOI] [PubMed] [Google Scholar]
- 24).Vogels A, De Her M, Descheemaeker MJ, Govers V, Devriendt K, Legius E, et al. Psychotic disorders in Prader-Willi syndrome. Am J Med Genet. 2004;127A:238–243. doi: 10.1002/ajmg.a.30004. [DOI] [PubMed] [Google Scholar]
- 25).Zarcone J, Napolitano D, Peterson C, Breidbord J, Ferraioli S, Caruso-Anderson M, et al. The relationship between compulsive behaviour and academic achievement across the three genetic subtypes of Prader-Willi syndrome. J Intellect Disabil Res. 2007;51:478–487. doi: 10.1111/j.1365-2788.2006.00916.x. [DOI] [PMC free article] [PubMed] [Google Scholar]
- 26).Shapira NA, Lessig MC, He AG, James GA, Driscoll DJ, Liu Y. Satiety dysfunction in Prader-Willi syndrome demonstrated by fMRI. J Neurol Neurosurg Psychiatry. 2005;76:260–262. doi: 10.1136/jnnp.2004.039024. [DOI] [PMC free article] [PubMed] [Google Scholar]
- 27).Holsen LM, Zarcone JR, Brooks WM, Butler MG, Thompson TI, Ahluwalia JS, et al. Neural mechanisms underlying hyperphagia in Prader-Willi syndrome. Obesity. 2006;14:1028–1037. doi: 10.1038/oby.2006.118. [DOI] [PMC free article] [PubMed] [Google Scholar]
- 28).Hinton EC, Holland AJ, Gellatly MSN, Soni S, Patterson M, Ghatei MA, et al. Neural representations of hunger and satiety in Prader-Willi syndrome. Int J Obesity. 2006;30:313–321. doi: 10.1038/sj.ijo.0803128. [DOI] [PubMed] [Google Scholar]
- 29).Miller JL, James GJ, Goldstone AP, Couch JA, He G, Driscoll D, et al. Enhanced activation of reward mediating prefrontal regions in response to food stimuli in Prader-Willi syndrome. J Neurol Neurosurg Psychiatry. 2007;78:615–619. doi: 10.1136/jnnp.2006.099044. [DOI] [PMC free article] [PubMed] [Google Scholar]
- 30).Dimitropoulos A, Schultz RT.Food-related neural circuitry in Prader-Willi syndrome: response to high- versus low-calorie foods J Autism Dev Disord 2008; DOI: 10.1007/s10803-008-0546-x. [DOI] [PubMed] [Google Scholar]
- 31).Kim SE, Jin D-K, Choo SS, Kim J-H, Hong SD, Paik KH, et al. Regional cerebral glucose metabolic abnormality in Prader-Willi syndrome: a 18F-FDG PET study under sedation. J Nucl Med. 2006;47:1088–1092. [PubMed] [Google Scholar]
- 32).Lucignani G, Panzacchi A, Bosio L, Moresco RM, Ravasi L, Coppa I, et al. GABAA receptor abnormalities in Prader-Willi syndrome assessed with positron emission tomography and [11C]flumazenil. Neuroimage. 2004;22:22–28. doi: 10.1016/j.neuroimage.2003.10.050. [DOI] [PubMed] [Google Scholar]
- 33).Goldstone AP. Prader-Willi syndrome: advances in genetics, pathophysiology and treatment. Trends Endocrinol Metab. 2004;15:12–20. doi: 10.1016/j.tem.2003.11.003. [DOI] [PubMed] [Google Scholar]
- 34).Stunkard AJ, Messick S. The three-factor eating questionnaire to measure dietary restraint, disinhibition and hunger. J Psychosom Res. 1985;29:71–83. doi: 10.1016/0022-3999(85)90010-8. [DOI] [PubMed] [Google Scholar]
- 35).Gelman N, Gorell JM, Barker PB, Savage RM, Spickler EM, Windham JP, et al. MR imaging of human brain at 3.0 T: preliminary report on transverse relaxation rates and relation to estimated iron content. Radiology. 1999;210:759–767. doi: 10.1148/radiology.210.3.r99fe41759. [DOI] [PubMed] [Google Scholar]
- 36).LaBar KS, Gitelman DR, Parrish TB, Kim Y, Nobre AC, Mesulam MM. Hunger selectivity modulates corticolimbic activation to food stimuli in humans. Beh Neurosci. 2001;115:493–500. doi: 10.1037/0735-7044.115.2.493. [DOI] [PubMed] [Google Scholar]
- 37).Talairach J, Tournoux P. Co-planar Stereotaxic Atlas of the Human Brain. Thieme Medical Publishing; New York: 1988. [Google Scholar]
- 38).Friston KJ, Holmes AP, Worsley JJ. Statistical parametric maps in functional imaging: a general linear approach. Hum Brain Mapping. 1995;2:189–210. [Google Scholar]
- 39).Bittel DC, Kibiryeva N, Butler MG. Expression of 4 genes between chromosome 15 breakpoints 1 and 2 and behavioral outcomes in Prader-Willi syndrome. Pediatrics. 2006;118:1276–1283. doi: 10.1542/peds.2006-0424. [DOI] [PMC free article] [PubMed] [Google Scholar]
- 40).Bittel DC, Kibiryeva N, Sell SM, Strong TV, Butler MG. Whole genome microarray analysis of gene expression in Prader-Willi syndrome. Am J Med Genet. 2007;143:488–492. doi: 10.1002/ajmg.a.31606. [DOI] [PMC free article] [PubMed] [Google Scholar]
- 41).Holsen LM, Zarcone JR, Thompson TI, Brooks WM, Anderson MF, Ahluwalia JS, et al. Neural mechanisms underlying food motivation in children and adolescents. Neuroimage. 2005;27:669–676. doi: 10.1016/j.neuroimage.2005.04.043. [DOI] [PMC free article] [PubMed] [Google Scholar]
- 42).Gautier JF, Chen K, Salbe AD, Bandy D, Pratley RE, Heiman M, et al. Differential brain responses to satiation in obese and lean men. Diabetes. 2000;49:838–846. doi: 10.2337/diabetes.49.5.838. [DOI] [PubMed] [Google Scholar]
- 43).Rothemund Y, Preuschhof C, Bohner G, Bauknecht HC, Klingebiel R, Flor H, et al. Differential activation of the dorsal striatum by high-calorie visual food stimuli in obese individuals. Neuroimage. 2007;37:410–421. doi: 10.1016/j.neuroimage.2007.05.008. [DOI] [PubMed] [Google Scholar]
- 44).Ongur D, Price JL. The organization of networks within the orbital and medial prefrontal cortex of rats, monkeys and humans. Cereb Cortex. 2000;10:206–219. doi: 10.1093/cercor/10.3.206. [DOI] [PubMed] [Google Scholar]
- 45).Ongur D, Ferry AT, Price JL. Architectonic subdivision of the human orbital and medial prefrontal cortex. J Comp Neurol. 2003;460:425–449. doi: 10.1002/cne.10609. [DOI] [PubMed] [Google Scholar]
- 46).Hinton EC, Holland AJ, Gellatly MSN, Soni S, Owen AM. An investigation into food preferences and the neural basis of food-related incentive motivation in Prader-Willi syndrome. J Intellect Disabil Res. 2006;50:633–642. doi: 10.1111/j.1365-2788.2006.00812.x. [DOI] [PubMed] [Google Scholar]
- 47).Miller EK. The prefrontal cortex and cognitive control. Nat Rev Neurosci. 2000;1:59–65. doi: 10.1038/35036228. [DOI] [PubMed] [Google Scholar]
- 48).DelParigi A, Chen K, Salbe AD, Hill JO, Wing RR, Reiman EM, et al. Successful dieters have increased neural activity in cortical areas involved in the control of behavior. Int J Obes. 2007;31:440–448. doi: 10.1038/sj.ijo.0803431. [DOI] [PubMed] [Google Scholar]
- 49).Bittel DC, Kibiryeva N, Talebizadeh Z, Butler MG. Microarray analysis of gene/transcript expression in Prader-Willi syndrome: deletion versus UPD. J Med Genet. 2003;40:568–574. doi: 10.1136/jmg.40.8.568. [DOI] [PMC free article] [PubMed] [Google Scholar]
- 50).Tobet SA, Henderson RG, Whiting PJ, Sieghart W. Special relationship of gamma-aminobutyric acid to the ventromedial nucleus of the hypothalamus during embryonic development. J Comp Neurol. 1999;405:88–98. doi: 10.1002/(sici)1096-9861(19990301)405:1<88::aid-cne7>3.0.co;2-0. [DOI] [PubMed] [Google Scholar]
- 51).DeLorey TM, Handforth A, Anagnostaras SG, Homanics GE, Minassian BA, Asatourian A, et al. Mice lacking the beta3 subunit of the GABAA receptor have the epilepsy phenotype and many of the behavioral characteristics of Angelman syndrome. J Neurosci. 1998;18:8505–8514. doi: 10.1523/JNEUROSCI.18-20-08505.1998. [DOI] [PMC free article] [PubMed] [Google Scholar]
- 52).Homanics GE, DeLorey TM, Firestone LL, Quinlan JJ, Handforth A, Harrison NL, et al. Mice devoid of gamma-aminobutyrate type A receptor beta3 subunit have epilepsy, cleft palate, and hypersensitive behavior. Proc Natl Acad Sci USA. 1997;94:4143–4148. doi: 10.1073/pnas.94.8.4143. [DOI] [PMC free article] [PubMed] [Google Scholar]
- 53).Kurita M, Kuwajima T, Nishimura I, Yoshikawa K. Necdin downregulates CDC2 expression to attenuate neuronal apoptosis. J Neurosci. 2006;26:12003–12013. doi: 10.1523/JNEUROSCI.3002-06.2006. [DOI] [PMC free article] [PubMed] [Google Scholar]
- 54).Kuwajima T, Nishimura I, Yoshikawa K. Necdin promotes GABAergic neuron differentiation in cooperation with Dlx homeodomain proteins. J Neurosci. 2006;26:5383–5392. doi: 10.1523/JNEUROSCI.1262-06.2006. [DOI] [PMC free article] [PubMed] [Google Scholar]
- 55).Lee S, Walker CL, Wevrick R. Prader-Willi syndrome transcripts are expressed in phenotypically significant regions of the developing mouse brain. Gene Expr Patterns. 2003;3:599–609. doi: 10.1016/s1567-133x(03)00113-3. [DOI] [PubMed] [Google Scholar]
- 56).Pagliardini S, Ren J, Wevrick R, Greer JJ. Developmental abnormalities of neuronal structure and function in prenatal mice lacking the Prader-Willi syndrome gene necdin. Am J Pathol. 2005;167:175–91. doi: 10.1016/S0002-9440(10)62964-1. [DOI] [PMC free article] [PubMed] [Google Scholar]
- 57).Muscatelli F, Abrous DN, Massacrier A, Boccaccio I, Le Moal M, Cau P, et al. Disruption of the mouse Necdin gene results in hypothalamic and behavioral alterations reminiscent of the human Prader-Willi syndrome. Hum Mol Genet. 2000;9:3101–3110. doi: 10.1093/hmg/9.20.3101. [DOI] [PubMed] [Google Scholar]
- 58).Bischof JM, Stewart CL, Wevrick R. Inactivation of the mouse Magel2 gene results in growth abnormalities similar to Prader-Willi Syndrome. Hum Mol Genet. 2007;16:2713–2719. doi: 10.1093/hmg/ddm225. [DOI] [PubMed] [Google Scholar]
- 59).Albrecht U, Sutcliffe JS, Cattanach BM, Beechey CV, Armstrong D, Eichele G, et al. Imprinted expression of the murine Angelman syndrome gene, Ube3a, in hippocampal and Purkinje neurons. Nat Genet. 1997;17:75–78. doi: 10.1038/ng0997-75. [DOI] [PubMed] [Google Scholar]
- 60).Joseph B, Egli M, Sutcliffe JS, Thompson T. Possible dosage effect of maternally expressed genes on visual recognition memory in Prader-Willi syndrome. Am J Med Genet. 2001;105:71–75. [PubMed] [Google Scholar]
- 61).Soni S, Whittington J, Holland AJ, Webb T, Maina E, Boer H, et al. The course and outcome of psychiatric illness in people with Prader-Willi syndrome: implications for management and treatment. J Intellect Disabil Res. 2007;51:32–42. doi: 10.1111/j.1365-2788.2006.00895.x. [DOI] [PubMed] [Google Scholar]