Abstract
This work extends modulated imaging, a recently developed technique based on the projection of structured light on a turbid medium that is able to measure optical properties of the high-scattering medium and perform tomography. We observe that structured light obliquely projected on a turbid medium undergoes a spatial shift during propagation. We propose a method to measure the spatial phase shift of a sinusoidal fringe pattern projected in a turbid medium, and we present a model derived from the diffusion approximation to describe the light propagation. Experimental validation by measurements performed on liquid phantoms is presented.
1. INTRODUCTION
Modeling the propagation of light in turbid media is important in various scientific fields. In biomedical optics models are useful to estimate the penetration of light in tissues. Furthermore, models are used to estimate the optical properties of tissues. In particular the measurement of the absorption (μa) and the reduced scattering coefficients of tissue is the basis of several diagnostic applications [1].
Methods used to model light propagating in turbid media have been applied in the frequency domain [2] to characterize the time dependence of a photon density wave in terms of its amplitude attenuation and phase retardation. In this paper we apply this concept to the spatial frequency domain through the use of obliquely incident structured illumination.
Structured light methods have been used extensively for profilometric measurements [3] and for machine vision [4]. Recently, the utility of structured illumination for imaging and quantification of optical properties in turbid systems such as biological tissues has been demonstrated [5]. In this paper, we extend this method, called modulated imaging (MI), to model the propagation of spatially periodic waves with oblique illumination. In this geometry the propagating photon density wave undergoes both phase shift and amplitude attenuation.
The spatial shift of light obliquely incident in turbid media is a well-known process: if a collimated light beam is injected into a scattering medium, the light re-emitted at the surface will be spatially shifted with respect to its state at the injection point. Obliquely incident light sources have been used successfully in diffuse optics for the measurement of optical properties [6], for fluorescence sensing [7], and for measurement of the anisotropy of highly scattering media [8].
Here, we investigate this phenomenon in the spatial frequency domain through spatially periodic wide-field illumination. During propagation in the turbid medium, structured light undergoes scattering and absorption. As a result, when a sinusoidal fringe pattern is obliquely projected on a sample, the reflectance at the surface will be attenuated and shifted in phase. In order to characterize this reflectance we investigated both analytically and experimentally the behavior of the phase shift that a sinusoidal fringe pattern undergoes during propagation in a turbid medium.
In Section 2, a model—derived from diffusion theory—is presented for the analytic prediction of the reflectance of a turbid medium illuminated with a sinusoidal fringe pattern. In Section 3 an experimental method for the measurement of the phase shift is illustrated, and measurements on liquid phantoms are shown. In Sections 4 and 5 the theoretical and experimental results are compared and potential applications are discussed.
2. THEORY
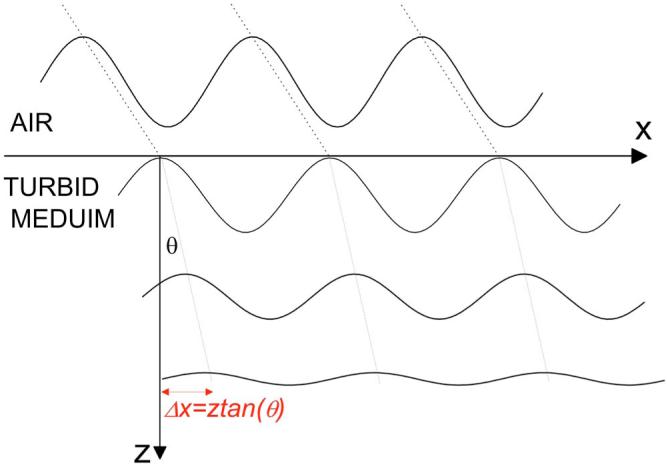
As described in Fig. 1, when a sinusoidal fringe pattern is obliquely projected on a turbid medium, the light will propagate along the direction given by Snell's law and eventually it will be absorbed and scattered. The backscattered light at the surface will be a combination of the light diffusively reflected at all depths in the sample and, assuming a linear homogenous medium, it will be sinusodally modulated at the same spatial frequency of the incident light. Compared to the incident light, it will be attenuated and spatially displaced. In the following sections, we will denote as PS the phase difference (or phase shift) between the incident light and the scattered light, detected at the surface.
Fig. 1.
(Color online) Scheme of structured light propagation in a turbid medium. The light source (a sinusoidal fringe pattern) propagates obliquely. During propagation it is attenuated and undergoes a phase shift.
According to the diffusion approximation, in a turbid medium the fluence rate φ and a light source q are related by the equation [9]
| (1) |
where and . In our geometry the light source is a fringe pattern spatially modulated along the x direction and can be modeled by the complex exponential . Here is a complex number that describes the light source.
Assuming a linear medium, the fluence rate will be modulated at the same spatial frequency as the source and will be in the form . Inserting φ and q in Eq. (1) we obtain
| (2) |
where
| (3) |
Equation (2) therefore extends the diffusion approximation in the case of a sinusoidally modulated source [5].
A planar illumination in a turbid medium can be described as an extended source [9,10], decaying exponentially. Therefore, can be described as a decreasing exponential along the direction of propagation:
| (4) |
Here P0 is the incident intensity, z is the distance from the surface, θ is the angle of propagation, and ϕq is the phase of the source. According to Fig. 1 ϕq can be expressed as a function of the propagation distance by ϕq =2πfxΔx=2πfxz tan θ. The diffusion equation becomes
| (5) |
Its solution is
| (6) |
where
| (7) |
and C depends on the choice of the boundary conditions. It should be noted that to find this solution a second boundary condition has been implicitly chosen: the fluence has been set to zero at positive infinity. Using the partial current boundary condition [11] at the surface z =0 the fluence is proportional to the module of the flux: . Here , and .
We obtain
| (8) |
Thus the fluence rate at the surface is
| (9) |
The amplitude of the reflectance at the surface is proportional to the fluence rate and its value is
| (10) |
The phase of the fluence at the surface is described as
| (11) |
3. MATERIALS AND METHODS
A. Experimental Setup
The MI system shown in Fig. 2 consists of a digital projector (BenQ PB8260) that creates a sinusoidal pattern on the surface of the sample and a 16-bit CCD camera (Roper Cascade 512F, 512×512 pixels) to image the diffusely reflected light. An interference filter in front of the camera enables the selection of a narrow wavelength band (λ=660 nm, Δλ=20 nm). The spatial frequency of the pattern is varied from 0 to 0.2 mm-1, and 38 spatial frequencies are sequentially acquired within this range. A tiltable mirror between the digital projector and the phantom enables us to perform the measurement at different angles of incidence.
Fig. 2.
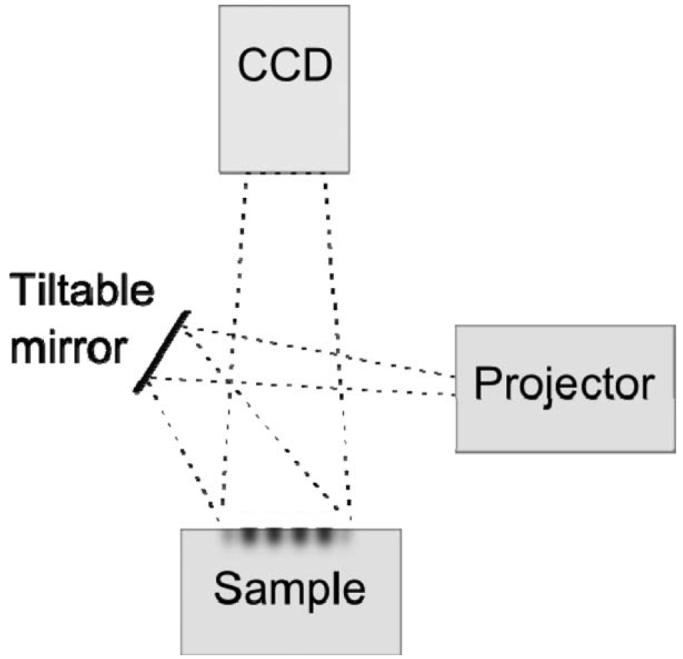
Experimental setup: a sinusoidal fringe pattern is projected on the liquid phantom. The scattered light is filtered at 660 nm and acquired by a CCD.
B. Amplitude and Phase Measurement
The sample (with surface positioned in a plane x,y) is illuminated with a sinusoidal fringe pattern modulated along the x direction at the spatial frequency fx. The reflectance is recorded for three projected fringe patterns. For each of the three projections the sinusoidal pattern is phase shifted along the x direction by 2π/3 from the others. The intensities Ii of the backscattered light at any location (x,y) will be the sum of the planar (I′) and sinusoidally modulated components along the x direction (I″):
| (12) |
The measurement of the amplitude of the reflectance has been discussed in recent publications [5]. Briefly, it can be determined using a demodulation algorithm by the formula
| (13) |
In principle the measurement of the PS could be obtained by projecting a sinusoidal pattern on the object and calculating the phase of the 2-dimensional Fourier transformation of the diffusively reflected light. However this method, like those based on the projection of a single pattern, is very challenging due to the uncertainty in the determination of the modulation frequency.
Here we propose to use a method previously developed for phase-shifting profilometry [12]. In this technique a sinusoidal fringe pattern is projected on the sample. In the presence of a curved surface the sinusoid undergoes a PS that is proportional to the height of the surface. Therefore the measurement of the phase gives a direct estimation of the height of the object. Instead, in our measurements the sample is flat and the PS is due only to the propagation through the turbid medium. The phase is derived from the intensity measured at the three phases as
| (14) |
This method takes advantage of the fact that the acquisition of three shifted images is already required for the measurement of the amplitude of the modulated light; therefore no additional acquisition time is needed to perform this measurement. The measurement is performed independently at each location (x,y position) on the sample. Thus the amplitude and phase information can be extracted for every point, creating an image of the sample. In the present work only homogeneous samples are considered and amplitude and phase are calculated by averaging over a 10×10 pixel area (corresponding to 1 × 1 cm) at the center of the image. It is worth noting that similar results could have been achieved using a structured light source and a single photodiode.
C. Calibration of Amplitude and Phase
A calibration is required in order to determine the true reflectance of the sample, and to separate it from the response of the experimental apparatus. This can be achieved by use of a phantom with known optical properties. The amplitude of the reflected light from the sample under study (ASAMPLE) can be calculated after measuring the reflectance of the sample itself and the phantom , and calculating—by use of the described model or Monte Carlo simulations—the phantom expected reflectance :
| (15) |
Similarly, the measured value of the PS is relative to the phase of the fringe pattern incident on the sample; therefore in order to measure the PS of the sample ϕSAMPLE) a calibration is required. Using Eq. (11) we can predict the PS of the calibration phantom . After measuring the PS of the sample and the phantom , we can determine ϕSAMPLE as
| (16) |
Therefore particular attention must be paid to the precise alignment of the optical setup: an error can occur if the sample and the reference phantom are not placed in the same position because an additional phase shift Δϕ=2πfxΔz tan θinc can be introduced by the different distances Δz from the light projector. For the measurements described later a displacement of 0.1 mm would give a maximum error of about ≃0.1 rad.
D. Measurement Protocol
Measurements have been performed on liquid phantoms made of scattering Intralipid diluted in water and absorbing Nigrosin (Sigma, St.Louis, Missouri) in a total volume of 300 ml contained in a plastic holder. The scattering properties of the Intralipid were characterized using literature reports [13]. The Nigrosin absorption was characterized using a spectrophotometer.
In a first experiment the measurement of the reflectance at varying scattering coefficients was performed at an angle of incidence of 50° from the normal. A phantom with absorption coefficient μa=0.0068 mm-1 and reduced scattering coefficient was initially prepared and measured. The amount of Intralipid was sequentially increased in order to vary the reduced scattering coefficient from to 8.03 mm-1 in six steps. An amount of liquid equal to the added Intralipid was removed from the container to maintain the same volume of liquid in all measurements, and the absorption coefficient is therefore decreased from μa=0.0068 mm-1 to 0.0045 mm-1. The phantom with higher scattering was used to calibrate the measurement.
In a second experiment the absorption coefficient of the sample was varied from μa=0.0004 mm-1 to 0.102 mm-1 in six steps by adding Nigrosin to a sample with reduced scattering coefficient . A last experiment was performed to test the dependence of the reflectance on the angle of incidence. A sample with μa=0.013 mm-1 and was measured at the three angles of projection of 25°, 45°, and 65° from the normal. These values of optical properties and projection angles were chosen to test the model both within the limits of diffusion theory and in other cases where diffusion theory fails with very low values of scattering.
4. RESULTS AND DISCUSSION
A. Discussion of the Model
Before discussing the measurements we focus on the PS features. The behavior of the PS as a function of spatial frequency and optical properties is shown in Fig. 3. The curves are calculated from Eq. (11), and they show that the PS increases nonlinearly with the spatial frequency. In Fig. 3(a) the transport coefficient μtr is varied and the reduced albedo is kept constant. A strong dependence of the phase shift on μtr is shown: for each spatial frequency the PS decreases as μtr is increased. This is because the light source decays more rapidly: if the attenuation in the tissue is increased (i.e., the interaction lengths decreased) the backscattered light is dominated by the part of the sample that is close to the surface, where the PS is smaller. In the extreme case of infinite μa or the PS will reduce to zero because of total absorption or total reflection at the surface.
Fig. 3.
(Color online) Effect of the transport coefficient (a) and of the reduced albedo (b) on the phase. The values of μtr and are indicated in the legend.
Conversely in Fig. 3(b) the ratio is varied and the PS is shown as a function of the normalized frequency (fx/μtr). For constant μtr a weak dependence of the phase on the albedo is shown. The reason is that the PS is a function of the sum , and since is generally smaller than μtr, the value of the phase is mainly determined by the transport coefficient, independently of the albedo.
B. Experimental Results
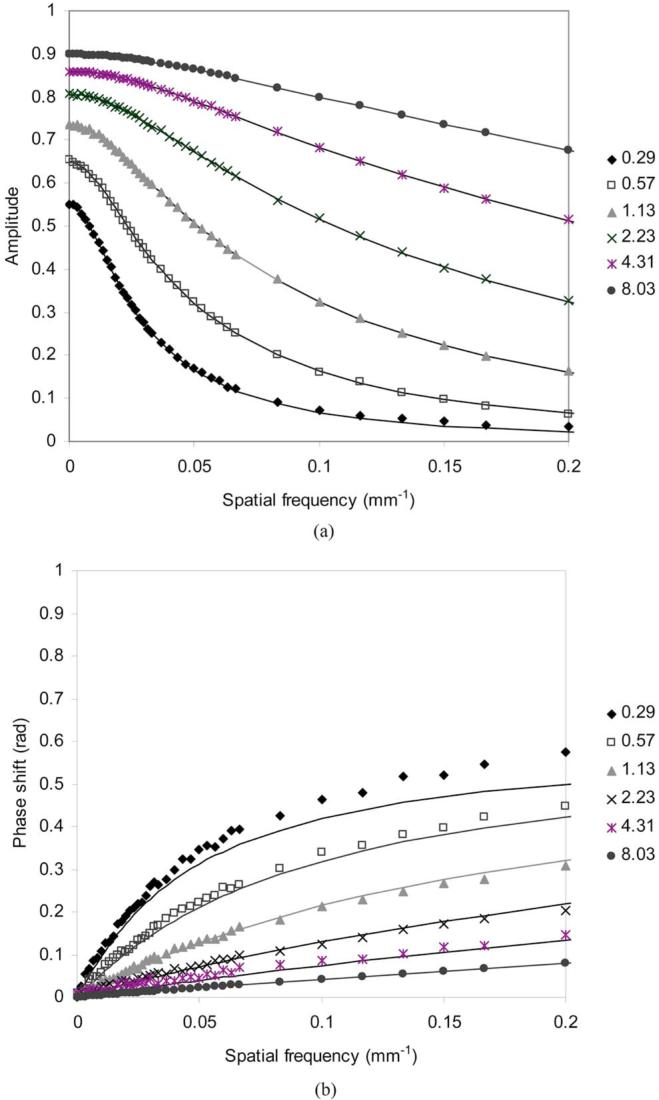
A comparison between the model and the experimental data for varying optical properties is shown in Fig. 4 and Fig. 5. The dotted curves in Figs. 4(a) and 4(b) represent, respectively, the amplitude and the PS of the reflectance obtained for the phantoms with increasing scattering. The solid curves represent the values predicted by the theoretical model using the expected values for the reduced scattering shown in the legend. For the highest value of scattering the agreement is perfect, as this phantom is used for calibration. The agreement between the amplitude predicted by the diffusion approximation and the measurement is better that 5% for all the reduced scattering values with . In Fig. 4(b) the error between the measured and predicted PS is smaller than 10% for , but at lower scattering values the model fails to accurately predict the phase. This demonstrates that the phase is more difficult to describe with the diffusion theory than the amplitude. This result is reasonable since the PS is strongly dependent on the forward propagation of the light. More advanced models—such as DeltaP1 [14] and Monte Carlo simulations—will be more appropriate to describe propagation at these values of , as well as at high spatial frequencies. Moreover at increasing frequencies the amplitude decreases, giving smaller appreciable errors.
Fig. 4.
(Color online) Calculated amplitude (a) and phase (b) of the reflectance at different scattering. The values of the reduced scattering coefficient are indicated in the legend. The expected values for the amplitude and the phase are indicated by the solid curves.
Fig. 5.
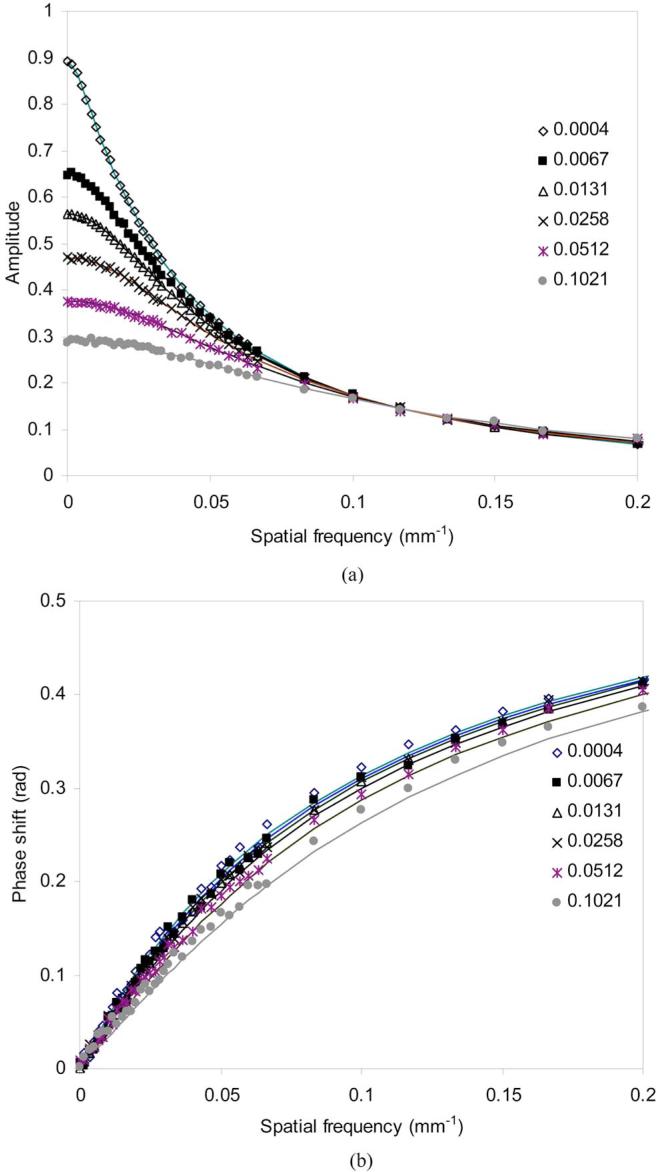
(Color online) Calculated amplitude (a) and phase (b) of the reflectance at different absorption. The values of the absorption coefficient μa are indicated in the legend. The expected values for the amplitude and the phase are indicated by the solid curves.
In Fig. 5 the experimental results (dotted curves) and the theoretically predicted values (solid curves) for the amplitude and the PS are shown for phantoms with varying absorption (the expected values of absorption are shown in the legend). The dependence of the phase on absorption is weak because, as mentioned previously, the PS is strongly dependent on , and here . The amplitude can be used to estimate the optical properties of tissues by using an inversion algorithm based on diffusion theory [5]. Instead, the curves shown in Fig. 5(b) suggest that the estimation of absorption will be challenging if only phase information is used. However the measurement of the PS could potentially increase the robustness of the estimation of μa and .
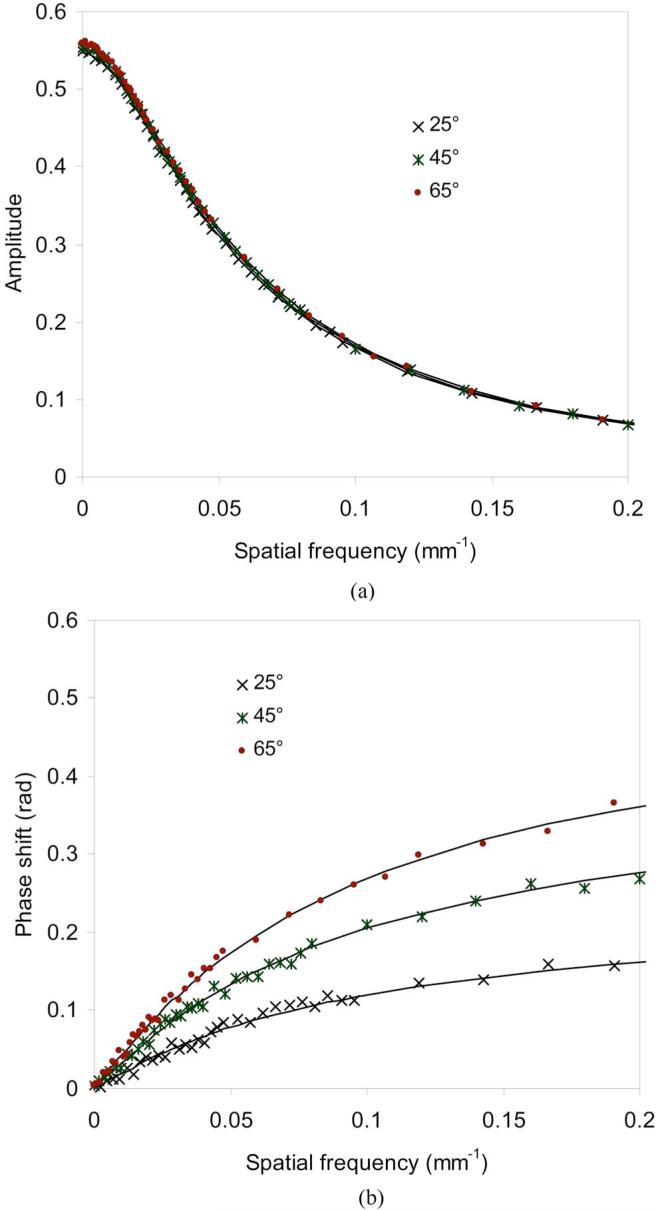
In Fig. 6 the dependence of the phase on the angle of incidence is shown. Here, in Fig. 6(a) a very small difference in the amplitude is found between the three angles. In particular the backscattered light from the sample increases with angle, and the difference reaches approximately 4%. This is in accordance with the fact that if the light is injected at larger angles, it will more easily arrive at the surface. Figure 6(b) shows that the PS increases with the angle, as expected. It is worth remembering that the propagation angles are smaller than the projection ones (they are ≃ 18°, 32°, and 43°). A good agreement (better than 5%) is found in all three cases.
Fig. 6.
(Color online) Calculated amplitude (a) and phase (b) of the reflectance at different projection angles (indicated in the legend). The expected values for the amplitude and the phase are indicated by the solid curves.
5. CONCLUSIONS
In this paper we have proposed a new analysis for the problem of propagation of light in turbid media, showing that obliquely projected spatially modulated light is attenuated and phase shifted during propagation. We proposed a method to measure the PS that sinusoidally modulated light undergoes in a turbid medium, and we presented a theoretical model based on the diffusion approximation that allowed us to predict the amplitude and the PS of the reflectance. Experiments were performed to test the theoretical model: the agreement between theory and experiments is better than 10% for typical optical properties of biological tissues () and spatial frequencies <0.2 mm-1. For lower scattering values a strong inaccuracy (>20%) was found, showing a failure of diffusion theory for these optical properties.
Potential application of this method could be the improvement of imaging and tomography of turbid media. The combined use of amplitude and phase could improve the robustness of 3-dimensional reconstruction of optical properties of the medium.
The in vivo application of the technique to biological samples will be subject to future investigation. The curvature of biological samples might be a serious limitation to this technique if profilometry is not considered. Conversely the model could be used to improve the accuracy of profilometric techniques based on structured light [3] applied to biological tissues or other highly diffusive media when optical properties are known.
Another potential application of the technique is the measurement of anisotropy of tissues. Anisotropy strongly influences nondiffusive propagation of collimated light at positions that are close to the injection point [8]; therefore we expect a dependence of the PS on anisotropy of the sample, particularly at high spatial frequencies. Monte Carlo simulations are under development to support and investigate this argument.
ACKNOWLEDGMENTS
This work was partially supported by the Ministero dell'Istruzione, dell'Università e della Ricerca (MIUR) Interlink Project (prot. II04CGM5MG); the Laser Microbeam and Medical Program (LAMMP), a National Institutes of Health (NIH) Biomedical Technology Resource, grant P41-RR01192; and the U.S. Air Force Office of Scientific Research (USAFOSR) Medical Free-Electron Laser Program (F49620-00-2-0371 and FA9550-04-1-0101). D. J. Cuccia would also like to acknowledge support from the National Science Foundation (NSF) Graduate Research Fellowship Program.
REFERENCES
- 1.Gibson AP, Hebden JC, Arridge SR. Recent advances in diffuse optical imaging. Phys. Med. Biol. 2005;50:R1–R43. doi: 10.1088/0031-9155/50/4/r01. [DOI] [PubMed] [Google Scholar]
- 2.Tromberg BJ, Svaasand LO, Tsay T-T, Haskell RC. Properties of photon density waves in multiple-scattering media. Appl. Opt. 1993;32:607–616. doi: 10.1364/AO.32.000607. [DOI] [PubMed] [Google Scholar]
- 3.Batlle J, Mouaddib E, Salvi J. Recent progress in coded structured light as a technique to solve the correspondence problem: a survey. Pattern Recogn. 1998;31:963–982. [Google Scholar]
- 4.Will PM, Pennington KS. Grid coding: a preprocessing technique for robot and machine vision. Artif. Intell. 1971;2:319–329. [Google Scholar]
- 5.Cuccia DJ, Bevilacqua F, Durkin AJ, Tromberg BJ. Modulated imaging: quantitative analysis and tomography of turbid media in the spatial-frequency domain. Opt. Lett. 2005;30:1354–1356. doi: 10.1364/ol.30.001354. [DOI] [PubMed] [Google Scholar]
- 6.Lin SP, Wang L, Jacques SL, Tittel FK. Measurement of tissue optical properties by the use of oblique-incidence optical fiber reflectometry. Appl. Opt. 1997;36:136–143. doi: 10.1364/ao.36.000136. [DOI] [PubMed] [Google Scholar]
- 7.Liu Q, Ramanujam N. Experimental proof of the feasibility of using an angled fiber-optic probe for depth-sensitive fluorescence spectroscopy of turbid media. Opt. Lett. 2004;29:2034–2036. doi: 10.1364/ol.29.002034. [DOI] [PubMed] [Google Scholar]
- 8.Joshi N, Donner C, Jensen HW. Noninvasive measurement of scattering anisotropy in turbid materials by nonnormal incident illumination. Opt. Lett. 2006;31:936–938. doi: 10.1364/ol.31.000936. [DOI] [PubMed] [Google Scholar]
- 9.Ishimaru A. Wave Propagation and Scattering in Random Media. Academic; 1978. [Google Scholar]
- 10.Svaasand LO, Spott T, Fishkin JB, Pham T, Tromberg BJ, Berns MW. Reflectance measurements of layered media with diffuse photon-density waves: a potential tool for evaluating deep burns and subcutaneous lesions. Phys. Med. Biol. 1999;44:801–813. doi: 10.1088/0031-9155/44/3/020. [DOI] [PubMed] [Google Scholar]
- 11.Haskell RC, Svaasand LO, Tsay TT, Feng TC, McAdams MS, Tromberg BJ. Boundary conditions for the diffusion equation in radiative transfer. J. Opt. Soc. Am. A. 1994;11:2727–2741. doi: 10.1364/josaa.11.002727. [DOI] [PubMed] [Google Scholar]
- 12.Srinivasan V, Liu H, Halioua M. Automated phase measuring profilometry of 3-D diffuse objects. Appl. Opt. 1984;23:3105–3108. doi: 10.1364/ao.23.003105. [DOI] [PubMed] [Google Scholar]
- 13.van Staveren HJ, Moes CJM, van Marle J, Prahl SA, van Gemert MJC. Light scattering in Intralipid-10% in the wavelength range of 400-1100 nm. Appl. Opt. 1991;30:4507–4514. doi: 10.1364/AO.30.004507. [DOI] [PubMed] [Google Scholar]
- 14.Carp SA, Prahl SA, Venugopalan V. Radiative transport in the delta-P1 approximation: accuracy of fluence rate and optical penetration depth predictions in turbid semi-infinite media. J. Biomed. Opt. 2004;9:632–647. doi: 10.1117/1.1695412. [DOI] [PubMed] [Google Scholar]


