Abstract
Metabolic and stress response gene regulation is crucial for the survival of an organism to a changing environment. Three key molecules that sense nutrients and broadly affect gene expression are the FoxO transcription factors, the transcriptional co-activator PGC-1α, and the dynamic post-translational modification, O-linked β-N-acetylglucosamine (O-GlcNAc). Here we identify novel post-translational modifications of PGC-1α, including O-GlcNAc, and describe a novel mechanism for how PGC-1α co-activates transcription by FoxOs. In liver, in cultured cells, and in vitro with recombinant proteins, PGC-1α binds to O-GlcNAc transferase and targets the enzyme to FoxOs, resulting in their increased GlcNAcylation and increased transcriptional activity. Furthermore, glucose-enhanced activation of FoxO1 occurs via this PGC-1α-O-GlcNAc transferase-mediated GlcNAcylation. Therefore, one mechanism by which PGC-1α can serve as a co-activator of transcription is by targeting the O-GlcNAc transferase to increase GlcNAcylation of specific transcription factors important to nutrient/stress sensing and energy metabolism.
The transcriptional co-activator PGC-1α plays a key role in regulating gene expression required for the stress response in neurons, adaptive thermogenesis in brown adipose tissue, muscle fiber-type switching, and multiple metabolic pathways in the liver (1, 2). PGC-1α responds to oxidative stress and activates expression of reactive oxygen species (ROS)2 detoxifying enzymes. In fact, PGC-1α knock-out mice are more sensitive to oxidative stress, particularly in neuronal tissues (3). PGC-1α regulates mitochondrial biosynthesis and respiration by stimulating the activity of a number of transcription factors including NRF-1/2, the peroxisome proliferator-activated receptors, the retinoid X receptors, and estrogen-related receptor α (1). In the liver, PGC-1α acts as a nutrient sensor through deacetylation by SIRT1 in response to fasting or pyruvate. Deacetylation of PGC-1α alters HNF4α-dependent expression of the gluconeogenicenzymes Pepck and G6pc (4). PGC-1α also enhances FoxO1-dependent activation of gluconeogenesis (5).
O-GlcNAc is a post-translational addition of β-N-acetylglucosamine to serine and threonine residues of nuclear and cytoplasmic proteins. In addition to its cellular location, it is unlike classical glycosylation in that it is not elongated and cycles on and off proteins dynamically. In fact, O-GlcNAc is functionally more analogous to phosphorylation and is crucial to cell signaling processes including insulin signaling, cell cycle progression, transcription and translation, protein turnover, and stress responses (6).
Insulin resistance and altered glucose metabolism damage cells of the nervous system, heart, vasculature, and kidneys (7). Insulin resistance can be caused by elevated flux through the UDP-GlcNAc synthesis pathway, which provides the donor sugar nucleotide for GlcNAcylation (8). In cultured adipocytes, elevating O-GlcNAc both by inhibition of O-GlcNAcase and by increasing UDP-GlcNAc levels decreased insulin-mediated glucose uptake (9). One mechanism of this phenomenon appears to involve a novel phosphatidylinositol 3,4,5-trisphosphate (PIP3)-binding domain of OGT. Insulin stimulation recruits OGT to the plasma membrane through interaction with PIP3, causing GlcNAcylation of the insulin receptor and insulin receptor substrate (10). In mice, transgenic overexpression of OGT in fat or muscle caused insulin resistance and hyperleptinemia (11). In Caenorhabditis elegans, knocking down OGT alters nutrient storage and dauer formation in a daf-2 (insulin receptor homolog) temperature-sensitive mutant.
In addition to peripheral insulin resistance, OGT also mediates the paradoxical activation of hepatic gluconeogenesis. Hyperglycemia results in increased UDP-GlcNAc levels in the liver, increasing GlcNAcylation of FoxO (12) and also increasing the GlcNAcylation of CREB-regulated transcription co-activator 2 (CRTC2 or TORC2, transducer of regulated cylic adenosine monophosphate response element-binding protein 2) (13). The transcription factor FoxO, which regulates metabolic-, stress response-, and longevity-related gene expression programs, responds to hyperglycemia through elevated GlcNAcylation in the liver. Diabetes-induced GlcNAcylation of hepatic FoxO1 elevates expression of Pepck and G6pc, two rate-limiting enzymes in gluconeogenesis, and also increases the transcription of the ROS detoxification enzymes manganese superoxide dismutase (MnSOD) and catalase. Elevated glucose also increases Pepck and G6pc expression through increased GlcNAcylation of CRTC2, which prevents its phosphorylation at sites responsible for its sequestration in the cytoplasm (12).
Thus, although elevated GlcNAcylation results in peripheral insulin resistance and increased hepatic gluconeogenesis, in the short term, increased O-GlcNAc is also key to survival during stress. O-GlcNAc is rapidly elevated following cellular stress, and increased GlcNAcylation protects cells from multiple forms of stress (14). O-GlcNAc protects against ischemic stress in the heart (15, 16), possibly through the p38 MAP kinase pathway (17). In neurons, low glucose stress induces a strong elevation of O-GlcNAc on many proteins in an AMP-activated kinase and p38 MAP kinase-dependent manner (18). p38 MAP kinase appears to target OGT to a subset of cellular proteins, including neurofilaments, in response to glucose starvation.
OGT modifies many targets in a dynamic and inducible manner, effecting broad changes in responses to a variety of stimuli. However, there does not appear to be a consensus sequence for GlcNAcylation, and unlike the multiple genes encoding kinases, there is only a single X-linked gene encoding the catalytic subunit of OGT in mammals (19). For this reason, it has been hypothesized that OGT is the catalytic subunit in large transient enzyme complexes where interacting proteins are able to target OGT to its many substrates. Here we show that PGC-1α is one such targeting subunit of OGT. A functional interaction between OGT and PGC-1α increases GlcNAcylation of FoxO, resulting in enhanced transcriptional activation in response to glucose.
EXPERIMENTAL PROCEDURES
Mass Spectrometry—FLAG-PGC-1α, purified from HEK293 cells using anti-FLAG-M2 beads (Sigma), was reduced, alkylated (20), and enzymatically digested with endoproteinase LysC (Roche Diagnostics) as described previously (12, 20). An aliquot of the digested sample was loaded onto a capillary precolumn (360-μm outer diameter × 75-μm inner diameter, Polymicro Technologies) packed with C18 reverse-phase resin (5–20-μm diameter, 120-Å pore size, YMC Inc.) (20, 21). The precolumn was rinsed with 0.1% acetic acid to remove salts and connected to a capillary analytical column (360-μm outer diameter × 50-μm inner diameter) packed with C18 resin (5-μm diameter, 120-Å pore size, YMC Inc.). The analytical column was equipped with an integrated electrospray emitter as described in Refs. 21 and 22. Proteolytic peptides were gradient eluted into the mass spectrometer at a flow rate of 60 nl/min using the high pressure liquid chromatography-reverse-phase gradient described in Ref. 21.
Samples were analyzed on a LTQ-Orbitrap mass spectrometer (Thermo Fisher Scientific) where the Orbitrap analyzer was operated at a resolving power of 30,000 (at m/z 400) to acquire high resolution MS1 spectra (21). Collision-activated dissociation (CAD) mass spectra were acquired data-dependently using the quadrupole linear ion trap analyzer. An LTQ XL mass spectrometer (Thermo Fisher Scientific) was used to acquire electron transfer dissociation (ETD) mass spectra. For ETD analyses (reagent AGC target = 3 × 10⁵ ion counts, ETD reaction time = 100 ms, precursor isolation window = 4 m/z), the LTQ XL was operated to continuously cycle through a MS1 scan followed by an ETD scan recorded on m/z 529.8 followed by four data-dependent ETD scans. All data were interpreted manually.
Plasmids—pGEX-4T3-GST-FKHR (Addgene plasmid 10706), pGEX-4T3-GST-FoxO3 wild type (Addgene plasmid 1790), pGEX-4T3-GST-FoxO3 1–525 amino acids (Addgene plasmid 10826), and pGEX-4T3-GST-FoxO3 1–525 amino acids triple mutant (Addgene plasmid 8351) (23) were used for in vitro assays. pcDNA-FLAG-FKHR (Addgene plasmid 13507) (24) and pcDNA3-FLAG-FKHR (AAA mutant) (Addgene plasmid 13508) (24) were used in cell culture experiments and luciferase assays. For in vitro assays, a PCR-amplified fragment corresponding to amino acids 200–665 of PGC-1α was cloned into pET-16b using NdeI and BamHI endonucleases. Bacterially expressed proteins were purified using glutathione-agarose (GE Healthcare) from log-phase BL21 cells after 4 h culturing with IPTG.
Adenoviral Infections—Adeno-green fluorescent protein was purchased from the Baylor College of Medicine Vector Development Laboratories. Adeno-FLAG-FoxO1 and adeno-FLAG-HA-PGC-1α were used as described (5).
Cell Culture and Treatments—Fao cells were cultured in Coon's modification of Ham's F-12 media (Sigma) with 5% fetal bovine serum. O-(2-Acetamido-2-deoxy-d-glucopyranoslidene) amino-N-phenylcarbamate (PUGNAc, Toronto Research Chemicals) was used at 100 μm overnight. Cells were treated with 1, 5, or 25 mm glucose or 25 mm glucose in serum-free Dulbecco's modified Eagle's medium overnight. Insulin was used at 100 nm for 1 h.
Luciferase Assays—FoxO1 transcriptional activation was measured using pGL3-3X FoxO1-binding sites from the insulin-like growth factor-binding protein (IGFBP) promoter (25). 20 ng/well of the FoxO1 reporter construct as well as 20 ng/well of a β-galactosidase control construct were transfected into HEK293 cells in 24-well dishes using Lipofectamine 2000 (Invitrogen). pcDNA3-HA-PGC-1α was used at 100 ng/well. Cells were transfected for 4 h in serum-free Dulbecco's modified Eagle's medium (Invitrogen). Media were then replaced with serum-free Dulbecco's modified Eagle's medium containing varying amounts of glucose and incubated overnight. Luminescence was normalized to β-galactosidase activity.
Immuno- and Lectin Blot Analysis—O-GlcNAc levels were determined by immunoprecipitation, SDS-PAGE, and blotting with antigen-purified CTD110.6 (26) (Covance) or the GlcNAc-binding lectin sWGA (27) (EY Laboratories). FoxO1 was detected with anti-FKHR (Santa Cruz Biotechnology sc-11350). PGC-1α was detected using anti-PGC-1α (Santa Cruz Biotechnology sc-13067). CREB-binding protein (CBP) was detected using anti-CBP (Santa Cruz Biotechnology sc-369), OGT was detected using DM-17 (Sigma) and AL28 (28).
Enzymatic Detection of O-GlcNAc—FLAG-PGC-1α was immunoprecipitated and washed with Tris pH 7.5 buffer containing 300 mm NaCl and 2% Triton X-100 and then labeled on beads with β-1-4-galactosyltransferase (GalT1) and UDP-Gal-NAz (Invitrogen C33368) in Hepes pH 7.9 buffer containing 5 mm MnCl. After washing, labeled protein was reacted with biotin alkyne detection reagent (Invitrogen catalog number C33372). The labeled protein was then separated from unincorporated label by SDS-PAGE, transferred to nitrocellulose, and blotted using streptavidin-horseradish peroxidase.
Protein Interaction Analysis—Co-immunoprecipitation assays were performed with lysates from Fao cells infected with Ad-FLAG-HA-PGC-1α. Anti-FLAG agarose (Sigma) or anti-OGT (AL28) was applied to cells lysed in Tris-buffered saline with 1% Nonidet P-40. The immunoprecipitates were washed three times and separated by SDS-PAGE and blotted with anti-HA (HA11) or anti-OGT (DM-17, Sigma) antibodies.
Gel filtration chromatography was performed using the SMART system with a Superose 12 column (Amersham Biosciences). Rat liver was lysed in Tris-buffered saline with 1% Nonidet P-40 and incubated for 1 h on ice with either normal rabit IgG (Santa Cruz Biotechnology) or anti-Ogt (AL28) (28).
OGT Assays—The plasmid expressing recombinant OGT was a kind gift of Suzanne Walker (29). In vitro OGT assays were performed on bead-bound FoxO for 2 h at room temperature in 50 mm Tris, pH 7.5, with 0.5 μCi of [3H]UDP-GlcNAc (American Radiolabeled Chemicals). Beads were then washed, and incorporated radioactivity was measured by scintillation counting or SDS-PAGE and autoradiography.
RESULTS
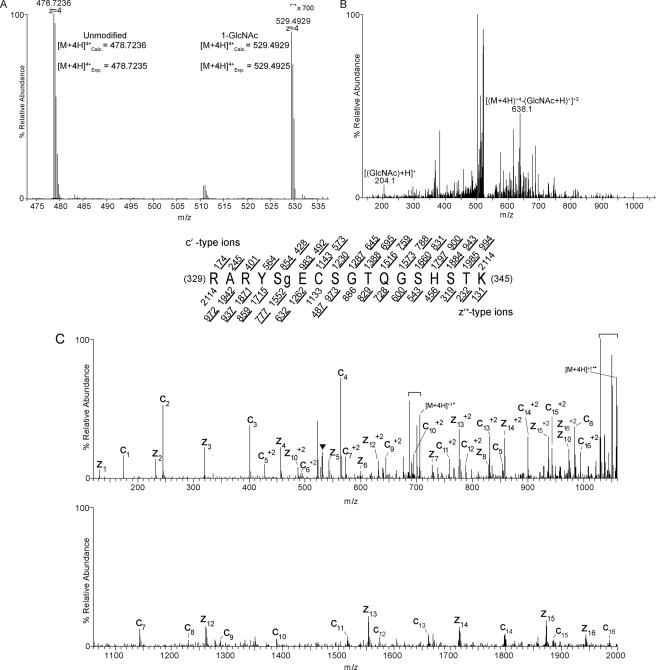
Identification of Post-translational Modifications of PGC-1α—Using ETD tandem mass spectrometry (MS/MS) and CAD-MS/MS, we identified multiple post-translational modifications of PGC-1α including O-GlcNAc, phosphorylation, acetylation, and monomethylation sites (Table 1 and supplemental Fig. S1). Some sites were previously known. For example, Ser-262, Ser-265, and Thr-298 (mouse sequence) can be phosphorylated by p38 MAP kinase (30). Thr-294 (Thr-295 in human) is phosphorylated by glycogen synthase kinase-3β (GSK-3β) (31).Methylation of PGC-1α has previously been shown to occur at Arg-665, Arg-667, and Arg-669 (human sequence) by protein arginine methyltransferase 1 (PRMT1) (32). These studies did not detect in vitro methylation in the amino acid 306–532 region (containing Arg-365, the monomethylation site we identified), indicating that PRMT1 may not be the methyltransferase responsible for Arg-365 modification or that in vitro labeling at this site was inefficient relative to the acidic Glu region. 13 acetylation sites have been found throughout PGC-1α (4). We identified two additional sites, Lys-200 and Lys-223 (Table 1). Additionally, a novel modification of PGC-1α, O-GlcNAc, was also found at serine 333 (Fig. 1).
TABLE 1.
PTMs of PGC-1α identified via mass spectrometric analysis of LysC-generated peptides Identification of post-translational modifications of PGC-1α was performed via ETD and CAD MS/MS. All modification sites have been confirmed via manual validation. Ser-262, Ser-265, and Thr-298 are known to be phosphorylated by p38 MAP kinase (30). Thr-294 (Thr-295 in human) is phosphorylated by glycogen synthase kinase-3β (GSK-3β) (31). Sites refer to the mouse sequence.
| Site | |
|---|---|
| Phosphorylation sites (p) | |
| ANQDNPFKASpPK | Ser-312 |
| QVSpPCSTRK | Ser-444 |
| TIERTLSVELSGTAGLTPPTTpPPHK | Thr-298 |
| TIERTLSVELSGTAGLTpPPTTpPPHK | Thr-294 and Thr-298 |
| YLTTNDDPPHTKPTENRNSSpRDK | Ser-231 |
| SHTQPQSQHAQAKPTTLSLPLTPESpPNDPKGSPFENK | Ser-265 |
| SHTQPQSQHAQAKPTTLSLPLTPESPNDPKGSpPFENK | Ser-272 |
| SHTQPQSQHAQAKPTTLSLPLTPESpPNDPKGSpPFENK | Ser-265 and Ser-272 |
| GlcNAc site (g) | |
| RARYSgECSGTQGSHSTK | Ser-333 |
| Acetylation sites (ac) | |
| SICQQQKacPQRRPCSELLK | Lys-200 |
| YLTTNDDPPHTKacPTENRNSSRDK | Lys-223 |
| Monomethylation site (me) | |
| SSGLSRmeGHEERK | Arg-365 |
FIGURE 1.
O-GlcNAc site mapping on Pgc-1α via liquid chromatography-MS/MS. A, a high resolution MS1 spectrum (mass range m/z 473–537) recorded using a LTQ Orbitrap mass spectrometer operated in the data-dependent mode. The [M+4H]+4 ion at m/z 478.7236 corresponds to the 12C isotope of the LysC-generated, carbamidomethylated PGC-1α peptide, RARYSECSGTQGSHSTK. This mass agrees to <1 ppm with the calculated monoisotopic mass. Signals at m/z 529.4929 correspond to the [M+4H]+412C isotope of RARYSECSGTQGSHSTK harboring one GlcNAc moiety; this mass agrees with the calculated mass to <1 ppm. Signals for the GlcNAcylated species are >700-fold lower in abundance relative to the unmodified species. B, a CAD MS/MS spectrum recorded on [M+4H]+4 ions (m/z 529.4) of GlcNAcylated peptide RARYSECSGTQGSHSTK. The CAD spectrum contains signature GlcNAc oxonium ions at m/z 204.1 that are generated from loss of the GlcNAc moiety upon collision-activated dissociation (56). Charge-reduced ions, [(M + 4H)+4-(GlcNAc +H)+1]+3 at m/z 638.1, are also observed in this spectrum (56). C, an ETD MS/MS spectrum recorded on [M+4H]+4 ions (m/z 529.8) of GlcNAcylated peptide RARYSECSGTQGSHSTK. An ETD-enabled LTQ mass spectrometer was operated to record a MS/MS spectrum on m/z 529.8 followed by four data-dependent scans after every MS1 scan to generate the ETD spectrum, which is presented as a subtracted spectrum. Predicted product ions of types c′- and z′·- are listed above and below the peptide sequence, respectively. Singly and doubly charged ions are listed as monoisotopic and average masses, respectively. Observed product ions are underlined and are sufficient to define the O-GlcNAc residue at Ser-333. ETD product ions are labeled in the ETD spectrum. A triangle (▾) is positioned above m/z peaks that are within the precursor isolation window. Signals corresponding to charge-reduced species and species resulting from neutral losses are bracketed.
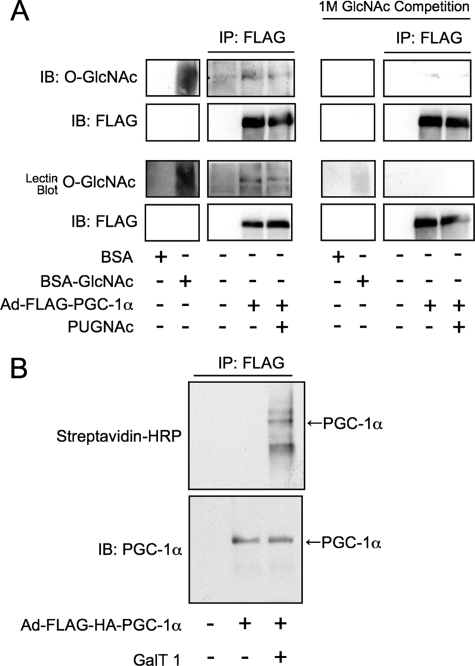
PGC-1α Is a Substrate for OGT—PGC-1α was overexpressed in Fao cells using an adenoviral vector and purified with anti-FLAG agarose and then subjected to SDS-PAGE (Fig. 2A). Blotting with the anti-O-GlcNAc antibody, CTD110.6, or the GlcNAc-binding lectin, sWGA, indicates that the co-activator is GlcNAcylated. Reactivity was competed by preincubating the antibodies or lectin with 1 m GlcNAc. Because overnight O-(2-acetamido-2-deoxy-d-glucopyranoslidene) amino-N-phenylcarbamate (PUGNAc) (an O-GlcNAcase inhibitor) treatment of cells prior to lysis did not raise O-GlcNAc levels on PGC-1α, it appears that cycling (the enzymatic addition and removal) of O-GlcNAc on this co-activator occurs at a slow rate in these cells. To further demonstrate that PGC-1α is GlcNAcylated, we enzymatically labeled PGC-1α with a GlcNAc-specific β-1-4-galactosyltransferase, using UDP-Gal-NAz as the donor substrate. PGC-1α was then reacted with a biotin-alkyne and detected using streptavidin-horseradish peroxidase (Fig. 2B).
FIGURE 2.
PGC-1α is GlcNAcylated. A, FLAG-PGC-1α was immunoprecipitated (IP) from Fao cells subjected to SDS-PAGE and blotted (IB) using anti-O-GlcNAc antibodies (CTD110.6) or a terminal GlcNAc-specific lectin (sWGA). Specificity was confirmed by GlcNAc competition. BSA, bovine serum albumin. B, FLAG-PGC-1α was GalNAz-labeled with a GlcNAc specific β-1-4-galactosyltransferase and reacted with biotin-alkyne, then subjected to SDS-PAGE and blotted using streptavidin-horseradish peroxidase (streptavidin-HRP). Immunoblots are representative of three experiments.
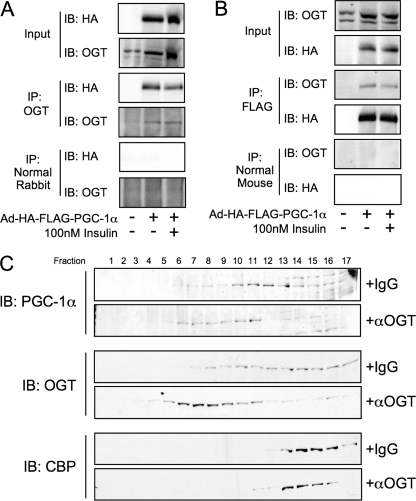
OGT and PGC-1α Interact—A putative OGT-PGC-1α interaction was previously reported from in vitro affinity chromatography experiments that used a fragment of PGC-1α (amino acids 200–400) and nuclear extracts from C2C12 myoblasts (33). We tested whether this interaction occurred in rat hepatoma (Fao) cells that were infected with an adenovirus expressing FLAG-HA-tagged PGC-1α. PGC-1α was found to co-purify in OGT immunoprecipitates (Fig. 3A), whereas OGT was present in FLAG immunoprecipitates (Fig. 3B). Exposing the cells to 100 nm insulin did not disrupt the OGT-PGC-1α interaction, indicating that the complex is not altered by insulin signaling. An endogenous OGT-PGC-1α complex was demonstrated in rat liver by gel filtration chromatography (Fig. 3C). Rat liver extracts were incubated with either normal IgG or anti-OGT antibodies and subjected to gel filtration chromatography, and the fractions were analyzed by SDS-PAGE. As expected, OGT shifted to fractions corresponding to higher molecular weights upon binding to antibodies. The fact that PGC-1α shifted its elution to the same fractions in the presence of anti-OGT, whereas CBP did not, strongly suggests that endogenous OGT and PGC-1α interact in rat liver.
FIGURE 3.
PGC-1α interacts with OGT. A, Fao cells were infected with Ad-FLAG-PGC-1α and treated with insulin for 1 h prior to harvesting and OGT co-immunoprecipitation (IP). Immunoprecipitates were subjected to SDS-PAGE and immunoblotted (IB) for the presence of PGC-1α. Membranes were then stripped and blotted for OGT. Immunoblots are representative of three experiments. B, Fao cells were infected with Ad-FLAG-PGC-1α and treated with insulin for 1 h prior to harvesting and FLAG co-immunoprecipitation. Immunoprecipitates were subjected to SDS-PAGE and immunoblotted for the presence of OGT. Membranes were then stripped and blotted for PGC-1α. C, gel filtration chromatography (SMART system, Superdex 200 column, phosphate-buffered saline, 1% Nonidet P-40 buffer) of lysates from rat liver incubated on ice for 30 min with either normal IgG or anti-OGT antibodies (AL28). Fractions were subjected to SDS-PAGE and blotted using anti-PGC-1α, anti-OGT (DM-17), and anti CPB. Data are representative of two experiments.
Additionally, we tested whether hyperglycemia affects the PGC-1α-OGT interaction. Co-immunoprecipitations were performed from HEK293 cells that had been exposed to 5 or 25 mm glucose overnight following infection with adeno-FLAG-PGC-1α. No statistically significant difference was found between normal and hyperglycemic conditions (supplemental Fig. S2).
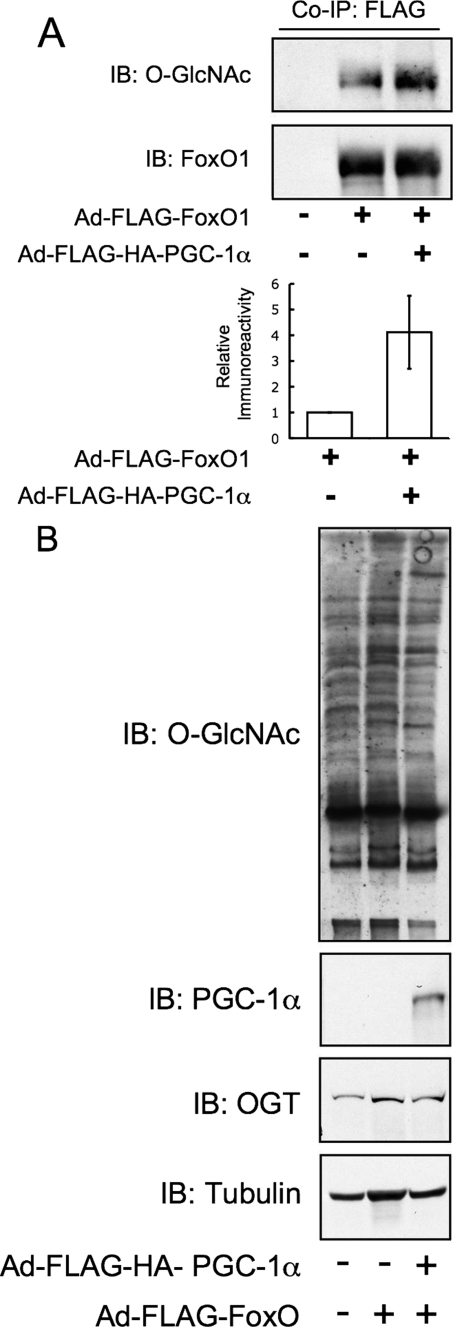
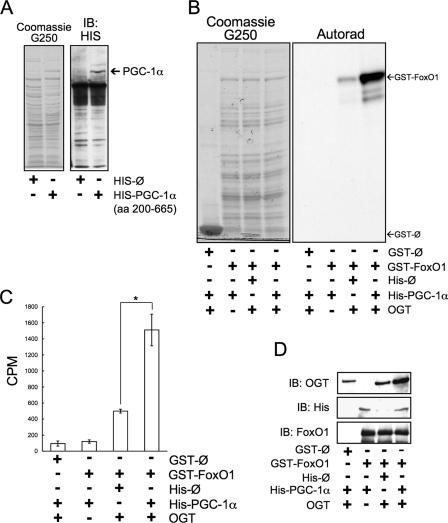
PGC-1α Targets OGT to FoxO—The interaction of OGT and PGC-1α led us to ask whether the function of this complex was to increase the activity of OGT toward the transcription factor FoxO1. In Fao cells, adenovirus-mediated overexpression of PGC-1α increased the GlcNAcylation of FoxO1 ∼4-fold (Fig. 4A and supplemental Fig. S3) but not total cellular GlcNAcylation (Fig. 4B).
FIGURE 4.
PGC-1α enhances high glucose activation and GlcNAcylation of FoxO1. A, overexpression of PGC-1α in Fao hepatoma cells increases O-GlcNAc levels on co-expressed FLAG-FoxO1. The bar graph represents densitometry of relative anti-O-GlcNAc immunoreactivity from three experiments. Co-IP, co-immunoprecipitations; IB, immunoblot. B, inputs from immunoprecipitations were subjected to SDS-PAGE and blotted for O-GlcNAc, PGC-1α, OGT, and tubulin. Total O-GlcNAc levels are unchanged by overexpression of PGC-1α.
To confirm that PGC-1α acts to target OGT to FoxO, we performed
in vitro OGT assays on GST-FoxO1 using bacterial lysates expressing
either His-PGC-1α or control
 His vectors
(Fig. 5A) and
detecting incorporated [3H]GlcNAc either by SDS-PAGE and
autoradiography (Fig.
5B) or by scintillation counting
(Fig. 5C). OGT
activity toward GST-FoxO1 was enhanced ∼3-fold when incubated with a
bacterial lysate expressing His-PGC-1α when compared with control
lysate.
FIGURE 5.
PGC-1α enhances the in vitro GlcNAcylation of FoxO1.
A, bacterial lysates expressing either HIS-PGC-1α (amino acids
(aa) 200–665) or empty
 HIS vector. B, an
autoradiograph (Autorad) of in vitro OGT labeled FoxO1 in
the presence of HIS-PGC-1α or control. Data are representative of three
experiments. C, scintillation counting of in vitro OGT
labeled FoxO1 in the presence of HIS-PGC-1α or control (*,
p < 0.05 by Student's t test). The bar graph represents
the mean of three experiments. The error bars depict stand errors.
D, a GST-pull down assay of GST-FoxO1 in the presence of
HIS-PGC-1α or control.
PGC-1α likely increases the activity of OGT toward GST-FoxO1 by increasing the OGT-FoxO1 interaction. To test this, we performed GST-FoxO pull-down assays. In the presence of bacterial lysate expressing HIS-PGC-1α, we also show that PGC-1α increases the interaction between OGT and FoxO1 (Fig. 5D).
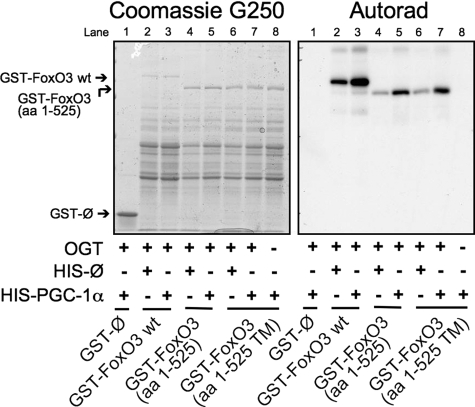
Because PGC-1α co-activates other transcription factors in addition to FoxO1, we asked whether PGC-1α increases GlcNAcylation of FoxO3. Fig. 6 shows in vitro OGT assays on recombinant GST-FoxO3 done in the presence of recombinant PGC-1α expressing bacterial lysate or control lysate. PGC-1α enhances [3H]GlcNAc labeling of full-length GST-FoxO3, a truncated form (amino acids 1–525), and a mutant FoxO3 lacking protein kinase B (PKB/AKT) phosphorylation sites (amino acids 1–525, triple mutant).
FIGURE 6.
PGC-1α enhances the in vitro GlcNAcylation of FoxO3.
An autoradiograph (Autorad) of in vitro OGT labeled FoxO3
wild type (wt), a truncated FoxO3 (amino acids (aa)
1–525), and a mutant lacking the protein kinase B (PKB/AKT)
phosphorylation sites (amino acids 1–525 triple mutant (TM)) in
the presence of lysates expressing either HIS-PGC-1α (amino acids
200–665) or empty  HIS
vector is shown.
Hyperglycemia has been shown to increase FoxO transcriptional activation via O-GlcNAc (12). We therefore performed luciferase reporter assays to test the effect of increased PGC-1α expression on FoxO activation by glucose. In HEK293 cells, overexpression of PGC-1α enhanced high glucose-mediated FoxO1 transactivation (Fig. 7A), whereas knockdown of PGC-1α reduced activation by glucose (Fig. 7B). To determine whether glucose-mediated activation of p38 MAP kinase, which is known to phosphorylate PGC-1α, plays a role in FoxO activation, we performed luciferase reporter assays in the presence of the p38 inhibitor, SB203508. The addition of 10 μm SB203508 prevents phosphorylation of p38 (supplemental Fig. S4A), an indirect indicator of activation, and reduces FoxO activation when compared with the vehicle control (supplemental Fig. S4B). This reduction, however, does not affect the -fold increase of FoxO activation by 25 mm glucose, indicating that p38 acts through a distinct mechanism.
FIGURE 7.
PGC-1α enhances high glucose activation and GlcNAcylation of FoxO1. A, PGC-1α co-transfection increases FoxO1-dependent luciferase expression (plotted as relative luciferase activity normalized to β-galactosidase; error bars indicate standard errors from three experiments; *, p < 0.05 by Student's t test). Expression was confirmed by immunoblotting (IB) for HA. B, short hairpin RNA knockdown of PGC-1α decreases FoxO-dependent luciferase expression. Knockdown was confirmed by real-time-PCR analysis of steady-state mRNA levels.
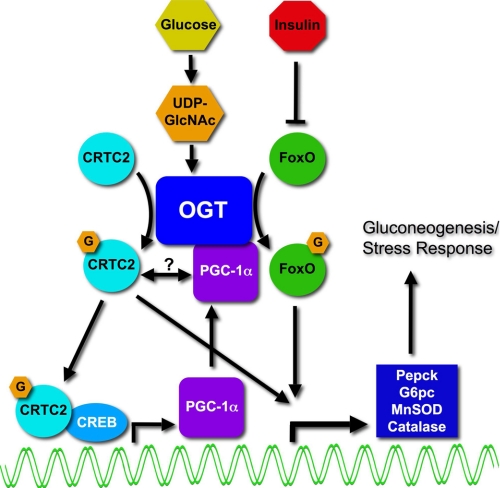
Fig. 8 depicts the regulation of FoxO-dependent transcription by an OGT-PGC-1α complex. Previously, we showed that O-GlcNAc is elevated on, and activates, FoxO in response to glucose (12). This regulation was opposed by exposing cells to insulin. The donor sugar nucleotide, UDP-GlcNAc, is elevated by high glucose in the liver and is a mechanism by which OGT senses nutrients and affects transcriptional activation. Dentin et al. (13) demonstrated that glucose is sensed via O-GlcNAcylation of the CREB co-activator CRTC2. Increased GlcNAcylation of hepatic CRTC2, following elevated glucose, lead to CRTC2 nuclear localization and promoter binding at gluconeogenic genes. PGC-1α expression is elevated by hyperglycemia (34) and, in muscle, is dependent upon CRTC2 (35) and CREB (36). Here we demonstrate that the co-activator PGC-1α impacts the glucose activation of FoxO-dependent activation by enhancing the GlcNAcylation of FoxO through targeting of OGT.
FIGURE 8.
Model depicting the regulation of FoxO by the PGC-1α-OGT complex in response to glucose. In the diabetic liver, GlcNAcylation of FoxO (12) and CRTC2 (TORC2) (13) mediates inappropriate gluconeogenesis in response to glucose by activating these key transcription factors. In a second step of activation of gluconeogenesis, elevated expression of PGC-1α, possibly through CRTC2 (35) and CREB (36), can bind and target OGT to FoxOs. Thus, glucose activates inappropriate gluconeogenesis in a two-step process. First, an O-GlcNAc-dependent activation of CRTC2/CREB drives PGC-1α expression. Second, higher levels of PGC-1α increase targeting of OGT to FoxOs. MnSOD, manganese superoxide dismutase.
DISCUSSION
Unlike the 385 human serine/threonine kinases (37), there is only one OGT gene for hundreds of targets (over 600 have so far been identified) (6, 38). Scaffolding proteins are often required for target specificity of kinases and for OGT, which has been proposed to exist in large, transient, multienzyme complexes. Thus, for OGT, there is essentially one catalytic subunit for many different holoenzymes. This mechanism is analogous to that for the catalytic subunit of RNA polymerase II (39). For example, OGT is targeted to promoters by mSin3A, where it interacts with histone deacetylases to repress SP-1-mediated transcription (40). Myosin phosphatase-targeting subunit 1 (MYPT1) and co-activator-associated arginine methyltransferase 1 (CARM1) target OGT to substrates in neuronal cell lines and in vitro (41). Additionally, the OGT-interacting protein, TRAK1 (OIP106), likely targets OGT to RNA polymerase II (42), and the p38 MAP kinase targets OGT to a subset of proteins upon glucose starvation (18). The discovery that PGC-1α can recruit OGT to FoxO1 further helps to explain how the substrate specificity of this transferase is maintained. These data also suggest that one mechanism by which PGC-1α co-activates gene transcription is through recruitment of post-translational modification processing enzymes, such as OGT, to transcription factors, such as FoxO1 and FoxO3. PGC-1α is known to activate p300-mediated histone acetylation and transcription in response to peroxisome proliferator-activated receptor γ (43); however, we did not observe an interaction between CBP and the OGT-PGC-1α complex. Interestingly, PGC-1α interacts with hyperphosphorylated RNA polymerase II (44), whereas GlcNAcylation of the C-terminal domain (CTD) of RNA polymerase II is reciprocal to phosphorylation (45).
The role of O-GlcNAcylation in the transcription cycle remains poorly understood despite being known of for several years (46). However, many transcription factors have been shown to be modified with O-GlcNAc (47), and thus far, 26% of known GlcNAcylated proteins regulate transcription (38). On PGC-1α, serine 333 falls in a putative inhibitory domain (48, 49), indicating that O-GlcNAc of PGC-1α may play a role in its repression. Recently, we showed that the transcription factor FoxO is activated by O-GlcNAc and that GlcNAcylation of FoxO is dysregulated during diabetes. Hyper-GlcNAcylated FoxO1 causes increased transcription of gluconeogenic and ROS response enzymes. Although the OGT-PGC-1α interaction was not affected by insulin, insulin signaling in the liver leads to phosphorylation of FoxO and a reduction of GlcNAc on this transcription factor. In diet-induced obese mice, there was also elevated GlcNAc on FoxO, perhaps as a result of insulin resistance.
Insulin resistance itself has been strongly tied to altered O-GlcNAc cycling. Vosseller et al. (9) demonstrated that elevated O-GlcNAc in murine adipocytes leads to reduced insulin-stimulated glucose uptake. Recently, a novel PIP3-binding domain was discovered in OGT, which causes it to target to the plasma membrane upon insulin stimulation. OGT is then able to GlcNAcylate insulin receptor and insulin receptor substrate-1, resulting in perturbed phosphorylation and reduced signaling capacity (10). In 3T3-L1 adipocytes, insulin activates tyrosine phosphorylation of OGT and increases its activity toward targets such as signal transducer and activator of transcription 3 (STAT3) (50).
In addition to insulin resistance, O-GlcNAc mediates nutrient storage and production. In C. elegans, OGT plays a role in nutrient storage and insulin signaling. Knock down of OGT results in altered trehalose and glycogen storage and suppresses the dauer formation phenotype in a daf-2 temperature-sensitive mutant (51).
In the diabetic liver, GlcNAcylation of FoxO (12) and CRTC2 (TORC2) (13) mediates inappropriate gluconeogenesis in response to glucose. In the absence of insulin, hyperglycemia elevates the expression of PGC-1α (34), possibly through CRTC2 (35) and CREB (36). Thus, glucose appears to activate inappropriate gluconeogenesis via a two-step process. First, an O-GlcNAc-dependent activation of CRTC2/CREB drives PGC-1α expression. Second, higher levels of PGC-1α increase targeting of OGT to FoxOs. In a commentary on the glucose-activated gluconeogenesis phenomenon, it was asked what is the evolutionary advantage of this seeming paradox (52). The answer may lie in the fact that ROS detoxification enzymes are increased concomitant with Pepck and G6pc, perhaps to deal with hyperglycemia-induced increases in reactive oxygen species. However, recent studies indicate that hyperglycemia-induced ROS generation itself is in part due to hyper-GlcNAcylation of mitochondrial proteins, which impairs normal mitochondrial functions (53).The discovery that PGC-1α can direct OGT further highlights the role of O-GlcNAc in the stress response (14, 18) and glucose toxicity.
In neurons, PGC-1α is induced by ROS, required for expression of the detoxification enzymes GPx1 and SOD2, and overexpression of PGC-1α is protective to oxidative damage (3). O-GlcNAc is also induced during multiple forms of stress and is protective (14). In COS7 cells, total cellular GlcNAcylation is increased by 15 min following heat-shocking cells at 45 °C and remains elevated for 24 h. Knock down of OGT reduces tolerance to heat stress. In cardiac cells, repression of PGC-1α by Cdk9 leads to increased apoptotic cardiomyopathy (54). Therefore, PGC-1α may be functioning in myocytes to increase O-GlcNAcylation, which is protective during ischemia (15, 17). Interestingly, this protection is associated with altered p38 activation (17), and low glucose stress also induces a large increase in GlcNAcylation (55) in a partially p38-dependent manner (18), and p38 is known to activate PGC-1α (30).
The dramatic increase in GlcNAc during glucose deprivation was also dependent upon AMP-activated kinase (18), indicating the importance of nutrient sensing to the stress response. Deacetylation of PGC-1α by SIRT1 in response to altered NAD+ levels provides the cell a direct control of gene expression by nutrient levels (4). Directing OGT, itself a nutrient sensor, to transcriptional targets provides further levels of transcriptional control and implies that PGC-1α can integrate multiple nutrient signals to regulate gene expression.
Acknowledgments
We thank members of the Hart Laboratory for helpful discussion and technical assistance. We thank William Sellers for use of pGEX-4T3-GST-FKHR.
This work was supported, in whole or in part, by National Institutes of Health Grants DK61671 and HD13563 (to G. W. H.) and GM37537 (to D. F. H.). G. W. H. receives a share of royalties on university sales of the CTD110.6 antibody. Arrangement managed by The Johns Hopkins University School conflict of interest policies. The costs of publication of this article were defrayed in part by the payment of page charges. This article must therefore be hereby marked “advertisement” in accordance with 18 U.S.C. Section 1734 solely to indicate this fact.
The on-line version of this article (available at http://www.jbc.org) contains four supplemental figures.
Footnotes
The abbreviations used are: ROS, reactiveoxygen species; GlcNAc, N-azidoacetylgalactosamine; GlcNAz, N-azidoacetylgalactosamine. O-GlcNAc, O-linked β-N-acetylglucosamine; OGT, O-GlcNAc transferase; PIP3, phosphatidylinositol 3,4,5-trisphosphate; CREB, cAMP-response element-binding protein; CBP, CREB-binding protein; MAP, mitogen-activated protein; CAD, collision-activated dissociation; ETD, electron transfer dissociation; GST, glutathione S-transferase; HA, hemagglutinin; CTD, C-terminal domain; MS, mass spectrometry; MS1, mass spectra; MS/MS, tandem mass spectrometry.
References
- 1.Finck, B. N., and Kelly, D. P. (2006) J. Clin. Investig. 116 615-622 [DOI] [PMC free article] [PubMed] [Google Scholar]
- 2.Rodgers, J. T., Lerin, C., Gerhart-Hines, Z., and Puigserver, P. (2008) FEBS Lett. 582 46-53 [DOI] [PMC free article] [PubMed] [Google Scholar]
- 3.St-Pierre, J., Drori, S., Uldry, M., Silvaggi, J. M., Rhee, J., Jager, S., Handschin, C., Zheng, K., Lin, J., Yang, W., Simon, D. K., Bachoo, R., and Spiegelman, B. M. (2006) Cell 127 397-408 [DOI] [PubMed] [Google Scholar]
- 4.Rodgers, J. T., Lerin, C., Haas, W., Gygi, S. P., Spiegelman, B. M., and Puigserver, P. (2005) Nature 434 113-118 [DOI] [PubMed] [Google Scholar]
- 5.Puigserver, P., Rhee, J., Donovan, J., Walkey, C. J., Yoon, J. C., Oriente, F., Kitamura, Y., Altomonte, J., Dong, H., Accili, D., and Spiegelman, B. M. (2003) Nature 423 550-555 [DOI] [PubMed] [Google Scholar]
- 6.Hart, G. W., Housley, M. P., and Slawson, C. (2007) Nature 446 1017-1022 [DOI] [PubMed] [Google Scholar]
- 7.Buse, M. G. (2006) Am. J. Physiol. 290 E1-EE8 [DOI] [PMC free article] [PubMed] [Google Scholar]
- 8.Marshall, S., Bacote, V., and Traxinger, R. R. (1991) J. Biol. Chem. 266 4706-4712 [PubMed] [Google Scholar]
- 9.Vosseller, K., Wells, L., Lane, M. D., and Hart, G. W. (2002) Proc. Natl. Acad. Sci. U. S. A. 99 5313-5318 [DOI] [PMC free article] [PubMed] [Google Scholar]
- 10.Yang, X., Ongusaha, P. P., Miles, P. D., Havstad, J. C., Zhang, F., So, W. V., Kudlow, J. E., Michell, R. H., Olefsky, J. M., Field, S. J., and Evans, R. M. (2008) Nature 451 964-969 [DOI] [PubMed] [Google Scholar]
- 11.McClain, D. A., Lubas, W. A., Cooksey, R. C., Hazel, M., Parker, G. J., Love, D. C., and Hanover, J. A. (2002) Proc. Natl. Acad. Sci. U. S. A. 99 10695-10699 [DOI] [PMC free article] [PubMed] [Google Scholar]
- 12.Housley, M. P., Rodgers, J. T., Udeshi, N. D., Kelly, T. J., Shabanowitz, J., Hunt, D. F., Puigserver, P., and Hart, G. W. (2008) J. Biol. Chem. 283 16283-16292 [DOI] [PMC free article] [PubMed] [Google Scholar]
- 13.Dentin, R., Hedrick, S., Xie, J., Yates, J., III, and Montminy, M. (2008) Science 319 1402-1405 [DOI] [PubMed] [Google Scholar]
- 14.Zachara, N. E., O'Donnell, N., Cheung, W. D., Mercer, J. J., Marth, J. D., and Hart, G. W. (2004) J. Biol. Chem. 279 30133-30142 [DOI] [PubMed] [Google Scholar]
- 15.Liu, J., Pang, Y., Chang, T., Bounelis, P., Chatham, J. C., and Marchase, R. B. (2006) J. Mol. Cell Cardiol. 40 303-312 [DOI] [PubMed] [Google Scholar]
- 16.Ngoh, G. A., Watson, L. J., Facundo, H. T., Dillmann, W., and Jones, S. P. (2008) J. Mol. Cell Cardiol. 45 313-325 [DOI] [PMC free article] [PubMed] [Google Scholar]
- 17.Fulop, N., Zhang, Z., Marchase, R. B., and Chatham, J. C. (2007) Am. J. Physiol. 292 H2227-H2236 [DOI] [PMC free article] [PubMed] [Google Scholar]
- 18.Cheung, W. D., and Hart, G. W. (2008) J. Biol. Chem. 283 13009-13020 [DOI] [PMC free article] [PubMed] [Google Scholar]
- 19.Shafi, R., Iyer, S. P., Ellies, L. G., O'Donnell, N., Marek, K. W., Chui, D., Hart, G. W., and Marth, J. D. (2000) Proc. Natl. Acad. Sci. U. S. A. 97 5735-5739 [DOI] [PMC free article] [PubMed] [Google Scholar]
- 20.Schroeder, M. J., Shabanowitz, J., Schwartz, J. C., Hunt, D. F., and Coon, J. J. (2004) Anal. Chem. 76 3590-3598 [DOI] [PubMed] [Google Scholar]
- 21.Udeshi, N. D., Compton, P. D., Shabanowitz, J., Hunt, D. F., and Rose, K. L. (2008) Nat. Protoc. 3 1709-1717 [DOI] [PMC free article] [PubMed] [Google Scholar]
- 22.Martin, S. E., Shabanowitz, J., Hunt, D. F., and Marto, J. A. (2000) Anal. Chem. 72 4266-4274 [DOI] [PubMed] [Google Scholar]
- 23.Brunet, A., Bonni, A., Zigmond, M. J., Lin, M. Z., Juo, P., Hu, L. S., Anderson, M. J., Arden, K. C., Blenis, J., and Greenberg, M. E. (1999) Cell 96 857-868 [DOI] [PubMed] [Google Scholar]
- 24.Tang, E. D., Nunez, G., Barr, F. G., and Guan, K. L. (1999) J. Biol. Chem. 274 16741-16746 [DOI] [PubMed] [Google Scholar]
- 25.Dowell, P., Otto, T. C., Adi, S., and Lane, M. D. (2003) J. Biol. Chem. 278 45485-45491 [DOI] [PubMed] [Google Scholar]
- 26.Comer, F. I., Vosseller, K., Wells, L., Accavitti, M. A., and Hart, G. W. (2001) Anal. Biochem. 293 169-177 [DOI] [PubMed] [Google Scholar]
- 27.Monsigny, M., Roche, A. C., Sene, C., Maget-Dana, R., and Delmotte, F. (1980) Eur. J. Biochem. 104 147-153 [DOI] [PubMed] [Google Scholar]
- 28.Kreppel, L. K., Blomberg, M. A., and Hart, G. W. (1997) J. Biol. Chem. 272 9308-9315 [DOI] [PubMed] [Google Scholar]
- 29.Gross, B. J., Kraybill, B. C., and Walker, S. (2005) J. Am. Chem. Soc. 127 14588-14589 [DOI] [PubMed] [Google Scholar]
- 30.Puigserver, P., Rhee, J., Lin, J., Wu, Z., Yoon, J. C., Zhang, C. Y., Krauss, S., Mootha, V. K., Lowell, B. B., and Spiegelman, B. M. (2001) Mol. Cell 8 971-982 [DOI] [PubMed] [Google Scholar]
- 31.Olson, B. L., Hock, M. B., Ekholm-Reed, S., Wohlschlegel, J. A., Dev, K. K., Kralli, A., and Reed, S. I. (2008) Genes Dev. 22 252-264 [DOI] [PMC free article] [PubMed] [Google Scholar]
- 32.Teyssier, C., Ma, H., Emter, R., Kralli, A., and Stallcup, M. R. (2005) Genes Dev. 19 1466-1473 [DOI] [PMC free article] [PubMed] [Google Scholar]
- 33.Fan, M., Rhee, J., St-Pierre, J., Handschin, C., Puigserver, P., Lin, J., Jaeger, S., Erdjument-Bromage, H., Tempst, P., and Spiegelman, B. M. (2004) Genes Dev. 18 278-289 [DOI] [PMC free article] [PubMed] [Google Scholar]
- 34.Yoon, J. C., Puigserver, P., Chen, G., Donovan, J., Wu, Z., Rhee, J., Adelmant, G., Stafford, J., Kahn, C. R., Granner, D. K., Newgard, C. B., and Spiegelman, B. M. (2001) Nature 413 131-138 [DOI] [PubMed] [Google Scholar]
- 35.Wu, Z., Huang, X., Feng, Y., Handschin, C., Feng, Y., Gullicksen, P. S., Bare, O., Labow, M., Spiegelman, B., and Stevenson, S. C. (2006) Proc. Natl. Acad. Sci. U. S. A. 103 14379-14384 [DOI] [PMC free article] [PubMed] [Google Scholar]
- 36.Handschin, C., Rhee, J., Lin, J., Tarr, P. T., and Spiegelman, B. M. (2003) Proc. Natl. Acad. Sci. U. S. A. 100 7111-7116 [DOI] [PMC free article] [PubMed] [Google Scholar]
- 37.Manning, G., Whyte, D. B., Martinez, R., Hunter, T., and Sudarsanam, S. (2002) Science 298 1912-1934 [DOI] [PubMed] [Google Scholar]
- 38.Love, D. C., and Hanover, J. A. (2005) Science's STKE 2005 re13. [DOI] [PubMed] [Google Scholar]
- 39.Thomas, M. C., and Chiang, C. M. (2006) CRC Crit. Rev. Biochem. Mol. Biol. 41 105-178 [DOI] [PubMed] [Google Scholar]
- 40.Yang, X., Zhang, F., and Kudlow, J. E. (2002) Cell 110 69-80 [DOI] [PubMed] [Google Scholar]
- 41.Cheung, W. D., Sakabe, K., Housley, M. P., Dias, W. B., and Hart, G. W. (2008) J. Biol. Chem. [DOI] [PMC free article] [PubMed]
- 42.Iyer, S. P., Akimoto, Y., and Hart, G. W. (2003) J. Biol. Chem. 278 5399-5409 [DOI] [PubMed] [Google Scholar]
- 43.Wallberg, A. E., Yamamura, S., Malik, S., Spiegelman, B. M., and Roeder, R. G. (2003) Mol. Cell 12 1137-1149 [DOI] [PubMed] [Google Scholar]
- 44.Monsalve, M., Wu, Z., Adelmant, G., Puigserver, P., Fan, M., and Spiegelman, B. M. (2000) Mol. Cell 6 307-316 [DOI] [PubMed] [Google Scholar]
- 45.Comer, F. I., and Hart, G. W. (2001) Biochemistry 40 7845-7852 [DOI] [PubMed] [Google Scholar]
- 46.Kelly, W. G., Dahmus, M. E., and Hart, G. W. (1993) J. Biol. Chem. 268 10416-10424 [PubMed] [Google Scholar]
- 47.Zachara, N. E., and Hart, G. W. (2004) Biochim. Biophys. Acta 1673 13-28 [DOI] [PubMed] [Google Scholar]
- 48.Puigserver, P., Adelmant, G., Wu, Z., Fan, M., Xu, J., O'Malley, B., and Spiegelman, B. M. (1999) Science 286 1368-1371 [DOI] [PubMed] [Google Scholar]
- 49.Knutti, D., and Kralli, A. (2001) Trends Endocrinol. Metab. 12 360-365 [DOI] [PubMed] [Google Scholar]
- 50.Whelan, S. A., Lane, M. D., and Hart, G. W. (2008) J. Biol. Chem. 283 21411-21417 [DOI] [PMC free article] [PubMed] [Google Scholar]
- 51.Hanover, J. A., Forsythe, M. E., Hennessey, P. T., Brodigan, T. M., Love, D. C., Ashwell, G., and Krause, M. (2005) Proc. Natl. Acad. Sci. U. S. A. 102 11266-11271 [DOI] [PMC free article] [PubMed] [Google Scholar]
- 52.Birnbaum, M. J. (2008) Science 319 1348-1349 [DOI] [PubMed] [Google Scholar]
- 53.Hu, Y., Suarez, J., Fricovsky, E., Wang, H., Scott, B. T., Trauger, S. A., Han, W., Hu, Y., Oyeleye, M. O., and Dillmann, W. H. (2009) J. Biol. Chem. 284 547-555 [DOI] [PMC free article] [PubMed] [Google Scholar]
- 54.Sano, M., Wang, S. C., Shirai, M., Scaglia, F., Xie, M., Sakai, S., Tanaka, T., Kulkarni, P. A., Barger, P. M., Youker, K. A., Taffet, G. E., Hamamori, Y., Michael, L. H., Craigen, W. J., and Schneider, M. D. (2004) EMBO J. 23 3559-3569 [DOI] [PMC free article] [PubMed] [Google Scholar]
- 55.Taylor, R. P., Parker, G. J., Hazel, M. W., Soesanto, Y., Fuller, W., Yazzie, M. J., and McClain, D. A. (2008) J. Biol. Chem. 283 6050-6057 [DOI] [PubMed] [Google Scholar]
- 56.Mikesh, L. M., Ueberheide, B., Chi, A., Coon, J. J., Syka, J. E., Shabanowitz, J., and Hunt, D. F. (2006) Biochim. Biophys. Acta 1764 1811-1822 [DOI] [PMC free article] [PubMed] [Google Scholar]


