Abstract
Epstein-Barr Virus (EBV) establishes a long-term latent infection and is associated with a number of human malignancies that are thought to arise from deregulation of different stages of the viral life cycle. Recently, a large number of microRNAs (miRNAs) have been described for EBV, and it has been suggested that their expression may vary between the different latency states found in normal and malignant tissue. To date, however, no technique has been utilized to comprehensively and quantitatively test this idea by profiling expression of the EBV miRNAs in primary infected tissues. We describe here a multiplex reverse transcription-PCR assay that allows the profiling of 39 of the 40 known mature EBV miRNAs from as little as 250 ng of RNA. With this approach, we present a comprehensive profile of EBV miRNAs in primary nasopharyngeal carcinoma (NPC) tumors including estimates of miRNA copy number per tumor cell. This is the first comprehensive profiling of EBV miRNAs in any EBV-associated tumor. In contrast to previous suggestions, we show that the BART-derived miRNAs are present in a wide range of copy numbers from ≤103 per cell in both primary tumors and the widely used NPC-derived C666-1 cell line. However, we confirm the hypothesis that the BHRF1 miRNAs are not expressed in NPC. Lastly, we demonstrate that EBV miRNA expression in the widely used NPC line C666-1 is, with some caveats, broadly representative of primary NPC tumors.
Epstein-Barr virus (EBV) is a ubiquitous human herpesvirus. It infects >90% of the human population, usually during childhood, and persists for life. Persistent infection is almost always benign; however, acute EBV infection causes infectious mononucleosis in some individuals (18, 24). When B cells from the blood of infected individuals are cultured they can give rise to lymphoblastoid cell lines which are latently infected with EBV and express nine latent proteins (latency III) (22, 26). However, it was discovered that in vivo, latency III is a transient state the cell passes through on the way to persistence in resting memory B cells where latent protein expression is extinguished (latency 0) (reviewed in reference 34). EBV is also associated with several malignancies, including B-cell lymphomas (Burkitt's lymphoma [BL], Hodgkin's lymphoma [HL], and immunoblastic lymphoma in the immunosuppressed) and carcinomas (nasopharyngeal [NPC] and gastric [GC]) (reviewed in references 11 and 33. Viral infection in the tumors is also latent but the infection is associated with more restricted forms of latent gene expression (latency I in BL and latency II in HL and NPC). However, when passaged in culture the tumor cells tend to drift toward latency III (36, 40). This is particularly true of BL-derived lines. Thus, the in vitro growth of in vivo-infected B or tumor cells selects for expression of a latency transcription program, latency III, that is not representative of the primary tissue. Therefore, in the EBV field it is crucial to check whether the viral gene expression patterns seen in cell lines faithfully represents what is seen in primary infected material.
In addition to the latent proteins, there are several untranslated RNAs that appear to be present in all EBV-infected cells studied thus far. These include two small RNAs (∼170 bp), termed EBER1 and EBER2, and a group of alternatively spliced RNAs from the BamHI A fragment known as BARTs (2, 4, 11, 15, 29, 31). The function of EBERs is not well understood, but they may play a role in cell survival by increasing the apoptotic threshold of infected cells (23). BARTs are particularly abundant in the EBV-associated carcinomas and encode a large number of microRNAs (miRNAs) (6, 9, 14, 16, 28, 31, 35).
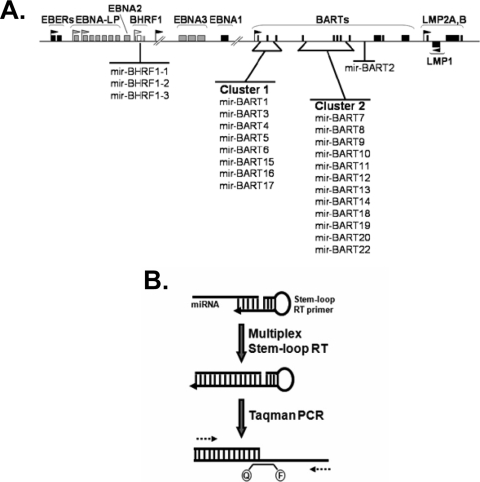
miRNAs are 19 to 24 nucleotides in length and regulate posttranscriptional gene expression by blocking translation or causing the degradation of target mRNAs (reviewed in references 12 and 17). These potent gene regulators are thought to control up to one third of all genes and have received increased attention due to their roles in a wide range of biological functions, including differentiation, cell growth, and disease, especially cancer (reviewed in reference 13). With the exception of ebv-mir-BART2, all of the BART-derived miRNAs map to two clusters, including one novel miRNA cloned in our lab named miR-BART22 (Fig. 1A) (6, 16, 28). A cluster of four miRNAs have also been identified which are derived from the BHRF1 gene (Fig. 1A) (28). This brings the total of known mature EBV miRNAs to 40, dramatically increasing the number and complexity of potentially biologically active molecules encoded by EBV during latent infection. However, like most miRNAs discovered to date, the functions of the EBV miRNAs are poorly understood. It has been shown that mir-BART2 targets the EBV DNA polymerase BALF5 for degradation, effectively inhibiting lytic replication (3). Cluster 1 BART miRNAs have been reported to downregulate the expression of the viral latent membrane protein 1 (LMP1) and miRNAs from the BHRF1 region have been associated with replication of the virus and regulation of the chemokine CXCL-11 (21, 38).
FIG. 1.
Genomic locations of the reported EBV miRNAs and the PCR technique used to profile EBV miRNAs in NPC. (A) Schematic representation of EBV miRNA locations within the EBV genome including a novel miRNA (miR-BART22) identified in our laboratory. The location and promoters for latency genes expressed in NPC are shown in black. The lytic replication-associated gene BHRF1 and its promoter are shown in white. All other latency genes and promoters are shown in gray. The BART miRNAs are grouped into two clusters based on their locations. (B) Stem-loop primers specific for the 3′ end of all EBV miRNAs are used to generate a pool of cDNA. A fraction of the total cDNA generated is used to quantify individual EBV miRNAs using miRNA-specific forward primers, a universal reverse primer, and a TaqMan MGB probe (labeled Q-F).
Systematic profiling of cellular miRNAs has become an important tool in unearthing the roles of these molecules in human cancer causation and in the development of miRNA-based screens as diagnostic and prognostic cancer indicators (20, 30). Given the strong association of EBV with human cancer, systematic quantitative profiling of the EBV miRNA expression patterns in EBV-associated diseases may help unearth their potential functions and their possible value as prognostic and diagnostic tools.
The studies to date of EBV miRNA expression have used Northern blotting, which is relatively insensitive and provides a qualitative measure of expression levels (6, 19, 21, 38). A few studies have analyzed small subsets of miRNAs in primary infected cells, but the most detailed studies have used EBV-infected cell lines to suggest differential expression of EBV miRNAs in different latency states (6, 7, 10, 16, 19, 21, 27, 38, 39). Specifically, it has been proposed by Cai et al. that the BART miRNAs are highly expressed in latency II, while the BHRF1 miRNAs are highly expressed in latency III (6). However, Edwards et al. have reported that EBV miRNA expression is not cell type specific (10) and highlight the difficulties and discrepancies that can arise when using EBV-infected cell lines. Thus far, these issues have not been confirmed or tested in a systematic way by comprehensive, quantitative profiling in primary infected tissue. This is a central issue at this point given the well-documented and powerful effect of tissue culture on latent protein expression. In the present study we describe the first systematic profiling of EBV miRNA expression in a human cancer, as well as quantitative measurements of their expression levels in biopsy samples and in cell lines. The present study confirms, in primary tumors, some of the predictions of Cai et al. (6) and provides the most complete description of EBV miRNAs in primary samples to date.
MATERIALS AND METHODS
Patient samples.
All biopsy samples were provided by the laboratory of Jaap Middeldorp at Vrije University Medical Center (VUmc) in Amsterdam, The Netherlands. Nasopharyngeal biopsy samples were collected under endoscope guidance at the ENT Department of the Cipto Mangunkusumo Hospital (Jakarta, Indonesia) as part of the routine clinical workup of patients suspected of having NPC. All biopsy samples were taken before treatment and were obtained with patients' informed consent as part of an ongoing diagnostic monitoring study of Marlinda Adham (32) as approved by the Dr. Cipto hospital. Upon collection, biopsy samples were cut into two parts. One part was snap-frozen in liquid nitrogen and stored at −80°C until transport to VUmc. The other part was fixed in buffered formalin for diagnostic histopathology. NPC diagnosis was made by the local Pathology department and confirmed independently at VUmc. EBV-positive undifferentiated NPC was confirmed on paraffin-embedded biopsy material by EBER in situ hybridization with PNA-probes (Dako, Denmark) and LMP1 immunohistochemical staining using OT21C and/or the S12 mouse monoclonal antibody (Organon Teknika, The Netherlands).
Cell lines.
C666-1 is an EBV-positive NPC-derived cell line. HONE-1 is an EBV negative NPC-derived cell line that lost EBV after multiple passages. HONE Akata is derived from HONE-1 by reinfection with the Akata strain of EBV (HONE-1 and HONE Akata kindly provided by Ronald Glaser). Akata 2A8.1 (kindly provided by Jeffery Sample) and Rael are Burkitt's lymphoma-derived cell lines, and AT is a lymphoblastoid cell line derived in our laboratory. HONE-1 and HONE Akata were cultured in Dulbecco modified Eagle medium (Gibco). All other cell lines were grown in RPMI 1640 medium. Both media were supplemented with 10% fetal calf serum, 2 mM sodium pyruvate, 2 mM l-glutamine, 100 U of penicillin/ml, 100 U of streptomycin/ml, and 10 μg of ciproflaxin/ml. Complete Dulbecco modified Eagle medium was also supplemented with 2 mg of HEPES/ml (Gibco).
EBV latency gene PCRs.
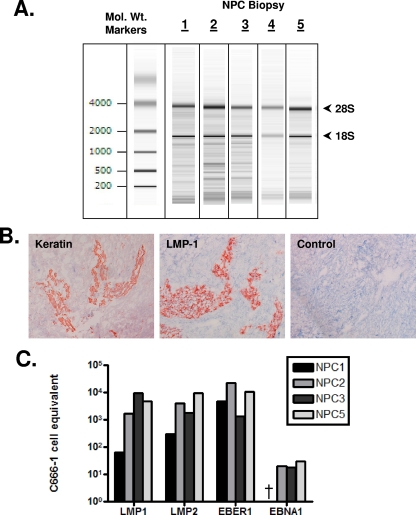
RNA from biopsy samples was isolated using the RNABee protocol according to the manufacturer's instructions (Qiagen) and from cell lines using TRIzol (Invitrogen). The integrity of the RNA was assessed with an Agilent Bioanalyzer and was considered intact based on the detection of prominent bands corresponding to 18S and 28S rRNA (see Fig. 4). LMP1, LMP2, and ENBA1 TaqMan real-time PCR primers and probes were generated by Applied Biosystems and incorporated into Assays-on-Demand gene expression kits. All primers and probes are listed below. TaqMan β-actin control reagents (Applied Biosystems) were used as a loading control. Reverse transcription (RT) reactions were performed by using the iScript cDNA synthesis reagents kit (Bio-Rad), and all samples were DNase treated using DNAfree reagents (Ambion) according to manufacturer's instructions. The 20-μl PCRs were incubated on a Bio-Rad MyIQ cycler at 95°C for 3 min, followed by 50 cycles of 95°C for 15 s and 60°C for 1 min. TaqMan PCR primers and probes for EBV gene expression were as follows: EBER1 Fwd (5′-ACCGAAGACGGCAGAAAGC-3′), EBER1 Rev (5′-CCTACGCTGCCCTAGAGGTTT-3′), and EBER1 probe (5′-6FAM-ACAGACACCGTCCTCACCACCCG-TAMRA-3′); LMP1 Fwd (5′-ACCACGACACACTGATGAACAC-3′), LMP1 Rev (5′-CTAGAATCGTCGGTAGCTTGTTGA-3′), and LMP1 probe (5′-6FAM-ACTCCCTCCCGCACCC-MGB-3′); LMP2 Fwd (5′-TTCTGGCTCTTCTGGGAACAC-3′), LMP2 Rev (5′-GGCTCTTCATTAGATTCACGTTCCT-3′), and LMP2 probe (5′-6FAM-ACCCCACCGAACGAT-MGB-3′); and EBNA1 Fwd (5′-TGAGTCGTCTCCCCTTTGGA-3′), EBNA1 Rev (5′-CCTTAGTGGGCCAGGTTGTG-3′), and EBNA1 probe (5′-6FAM-ATGGCCCCTGGACCC-MGB-3′).
FIG. 4.
RNA integrity and EBV gene expression of NPC biopsy samples. (A) RNA integrity of the five EBV-positive NPC biopsy samples used in the present study, analyzed with an Agilent Bioanalyzer. The ribosomal bands are labeled. Their presence as strong discrete bands indicates that the RNA is intact. (B) An example of an NPC biopsy sample, NPC2, that was diagnosed as containing tumor cells by keratin staining and confirmed as EBV positive with LMP1 staining. (C) The presence of EBV in the biopsy samples was confirmed using RT-PCR for the EBV-encoded small RNA EBER1 and the latent genes LMP1, LMP2, and EBNA1. The data are expressed as the estimated number of C666-1 cell equivalents used in the PCRs for each biopsy sample. This was calculated for all four PCRs by comparing the signal from each biopsy sample to those obtained with known numbers of the NPC-derived cell line C666-1. NPC4 is excluded from this analysis due to insufficient RNA. †, EBNA1 was not detected in NPC1.
Multiplexed stem-loop RT-PCR.
All EBV miRNA sequences were obtained from the Sanger miRNA Registry (http://microrna.sanger.ac.uk/; see also Table S1 in the supplemental material) and stem-loop RT primers were designed based on these sequences as previously described (8). (See Table S1 in the supplemental material for a complete list of the miRNAs used in the present study and their sequences.) Stem-loop RT primers for all EBV miRNAs were combined so that the RT reaction contained a final concentration of 12.5 nM of each RT primer. When a single RT primer was used, the final concentration was 50 nM. TaqMan MicroRNA RT kit (Applied Biosystems) was used, and the reactions were incubated according to kit instructions. The volume of the RT reaction was adjusted according to the number of PCRs to be performed. The final input of NPC biopsy RNA in RT reactions ranged from 250 to 350 ng. All RT reactions, including a no-template control, were performed in duplicate. Real-time PCR primers and probes were designed for each EBV miRNA as previously described (8). (See Table S2 in the supplemental material for a complete list of the primer and probe sequences used in the present study.) Each 10-μl miRNA PCR included 1 μl of RT product, 5 μl of 2× IQ Supermix (Bio-Rad), 1.5 μM forward primer, 0.7 μM universal reverse primer, and 0.2 μM TaqMan probe (Applied Biosystems). The samples were incubated on a Bio-Rad MyIQ cycler at 95°C for 3 min, followed by 40 cycles of 95°C for 15 s and 60°C for 30 s. All real-time PCRs were performed from the same batch of RT product for each sample and were performed in duplicate. TaqMan microRNA assay for RNU6b (Applied Biosystems) was used as a loading control.
Calculation of miRNA copy number per cell.
To calculate the copy number of each miRNA per tumor cell, it is necessary to know how many cells were used to produce the input RNA used for the PCRs. However, because of their small size it is not possible to directly count the number of cells in the biopsy samples; therefore, we derived an approach to estimate this. First, serial dilutions of the EBV positive NPC cell line C666-1 were made, and RT-PCR for expression of the cellular β-actin gene and the two EBV latent genes EBER1 and LMP1 was performed. From this, we could generate C666-1 calibration curves (cell number versus RT-PCR signal) for all three genes. In parallel, RT-PCR for β-actin, EBER1 and LMP1 was performed on the same biopsy samples used to measure EBV miRNA copy numbers. These RT-PCR signals and the C666-1 calibration curves were then used to calculate the number of C666-1 cell equivalents in each NPC biopsy sample. The actin analysis provides an estimate of the total cell input into the miRNA PCRs. However, since NPC tumors have a large non-tumor lymphoid infiltrate, we also used the EBER1 and LMP1 analysis to provide two independent estimates of the total number of EBV positive, i.e., tumor, cells used to make the RNA. Finally, we took the total miRNA copy number (see Fig. 5) and divided by the estimated cell input number derived from the C666-1 calibration curves to estimate the average miRNA copy number per cell in the biopsy samples.
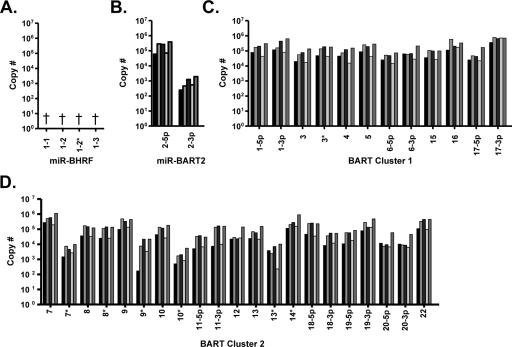
FIG. 5.
Quantitative analysis of BART miRNAs in five NPC biopsy samples. BART miRNAs were quantified using synthetic miRNAs as standard controls. The data shown are the total number of copies in the NPC biopsy RNA used in the PCR. (A) ebv-miR-BHRF1; (B) ebv-miR-BART2; (C) ebv-miR-BART cluster 1; (D) ebv-miR-BART cluster 2. †, The ebv-miR-BHRF1 miRNAs were not detected in any of the biopsy samples. *, The dominant miRNA when two are derived from the same stem-loop precursor.
RESULTS
EBV miRNA profiling with multiplex RT-PCR.
Nearly 40 mature miRNAs derived from the BHRF1 and BART regions of the EBV genome have been described. In addition, we report a novel, previously unpublished miRNA (miR-BART22) using the miRNA cloning protocol described by Ambros et al. (1). Based on the PCR protocol described by Chen et al. for detecting miRNAs (8), we developed a sensitive and specific multiplex PCR method to quantify these EBV miRNAs in the small amounts of material available from clinical biopsy samples. This technique makes use of a stem-loop primer for RT, followed by TaqMan real-time PCR using miRNA-specific forward primers and probes and a universal reverse primer specific for the constant region of the stem-loop RT primer (Fig. 1B). Using these specifications, we successfully designed specific primers and probes for the novel EBV BART miRNA discovered in our lab (miR-BART22) and 38 of 39 of the EBV miRNAs listed in the Sanger Center miRNA database, miRBase, at the time of this study.
Sensitivity and specificity of the multiplex assay.
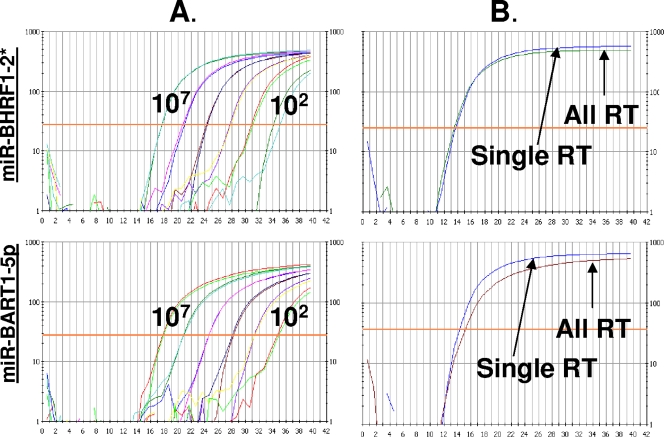
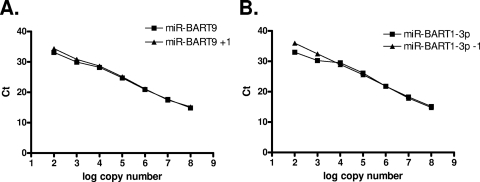
To validate the utility of our assay and discover the limits of its sensitivity, we performed a number of control experiments. Synthetic oligonucleotides representing all of the miRNAs were mixed at known copy numbers and subjected to RT. Each miRNA was analyzed using a fraction of the resulting cDNA. Figure 2 shows the sensitivity of two representative EBV miRNA PCRs. With the exception of one PCR, miR-BART14, which was excluded from further analysis, all of the PCR assays detected miRNAs down to 10 copies of synthetic miRNAs and demonstrated a linear relationship between copy number and PCR cycle number down to 100 copies (for example, see Fig. 2A). This held true whether the miRNAs were tested alone (not shown) or in mixtures containing all 39 miRNAs. In addition, the sensitivity of the assay was not altered when the RT reaction was carried out using pooled miRNA-specific RT primers (All RT) compared to using a single miRNA-specific RT primer (single RT) (Fig. 2B). Lastly, we compared the reproducibility of detection when the oligonucleotides were assayed alone or after spiking into a whole extract from EBV-negative cells. Again, we observed no significant differences (data not shown) indicating that all of the miRNAs were efficiently recovered and that the low copy numbers found for miR-BART2-3p for example, were not simply due to inefficient recovery of that particular miRNA.
FIG. 2.
Sensitivity of quantitative multiplex RT-PCR for EBV miRNAs. (A) Synthetic miRNAs were used at copy numbers ranging from 107 to 102 to determine the sensitivity of each of the 40 EBV miRNA-specific PCRs and as standard controls for the quantification of the EBV miRNAs in NPC biopsy samples. (B) PCR was performed using either a single RT primer specific for the miRNA under analysis (Single RT) or all of the EBV miRNA-specific RT primers (All RT) on pooled oligonucleotides for all of the miRNAs. The figure shows representative results for two miRNAs: mir-BHRF1-2* (upper panels) and mir-BART1-5p (lower panels).
The assay was also highly specific. All PCRs were tested for cross-reactivity by using the combined RT primers on a pool of all of the oligonucleotides, including or excluding the synthetic oligonucleotide for the miRNA to be tested. In all PCRs, detection of the specific sequence was ∼106-fold more sensitive than for nonspecific/cross hybridizing sequences (data not shown). In other words, a cross-reacting miRNA would need to be present at a copy number of ∼108 to generate a cross-reactive signal equivalent to 100 copies of the specific sequences.
Direct cloning by many groups has revealed single nucleotide end polymorphisms for many miRNAs (37). Whether these variants are real or artifacts introduced by the cloning technique has not yet been determined. We were concerned that this could affect the sensitivity of our assay, since it has been shown that the efficiency of the stem-loop real-time PCR may be decreased for variants (8, 37). We examined the efficiency of the PCR over a range of copy numbers for each of the nine EBV miRNAs for which variants have been listed in miRBase. The results for two representative miRNAs are shown in Fig. 3. In all cases the PCR efficiently detects variants down to ∼102 copies. In only two cases, where the new variant involved the deletion rather than the addition of a single nucleotide, did the assay become less quantitative and then only at copy numbers of ≤103. Not surprisingly, when we examined the EBV miRNA expression profile in C666-1 using variant sequences as the standard controls, the profile did not change significantly (data not shown). Therefore, this is only a potential concern for miRNAs present in biopsy samples at low copy numbers such as miR-BART2-3p and miR-BART10*, although at present no variants of these miRNAs have been described.
FIG. 3.
miRNA polymorphism does not affect PCR efficiency at high copy numbers. The efficiency of PCRs at detecting the sequences for which the primers and probes were originally designed and their variants was compared. Representative data are shown for the seven known variants that did not affect the PCR efficiency over the range of copy numbers tested (A) and the two that did at low copy numbers (B).
EBV miRNA profiles in NPC biopsy samples using multiplex RT-PCR.
Having established the sensitivity and specificity of the multiplex RT-PCR, we then used it to perform a comprehensive survey of EBV miRNA expression in NPC biopsy samples. We selected five samples with a confirmed diagnosis of NPC that demonstrated intact RNA (Fig. 4A) and were determined to be EBV positive by EBER in situ hybridization (data not shown) and immunohistochemical staining of LMP1 (Fig. 4B). Of the five biopsy samples, four had sufficient amounts of RNA to confirm the expected profile of EBV latent gene expression. We tested these samples for the expression of the EBV small RNA EBER1 and the latent proteins LMP1, LMP2, and EBNA1Q-K by RT-PCR analysis (Fig. 4C).
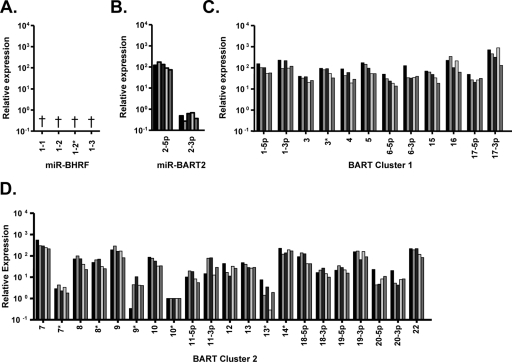
To determine the EBV miRNA copy number in NPC tumor biopsy samples the RT-PCR signal for each miRNA was compared to a titration of known quantities of the appropriate synthetic miRNA oligonucleotides. The results for all five biopsy samples were essentially the same, and the data are summarized in Fig. 5. All of the BART miRNAs were detectable in the NPC biopsy samples, including miR-BART22 cloned in our lab (Fig. 5B, C, and D). The copy numbers of the BART miRNAs in each biopsy sample ranged from ∼102 (miR-BART2-3p) to ∼106 (miR-BART17-3p), and we observed a larger degree of variability within the cluster 2 miRNAs than within the cluster 1 miRNAs. In contrast, the BHRF1 miRNAs were not detected in any of the five biopsy samples (Fig. 5A). As negative controls, we used six EBV-negative biopsy samples and the EBV-negative NPC cell line HONE-1 and consistently failed to detect the EBV miRNAs (data not shown).
To compare the EBV miRNA expression profiles between samples, we normalized the BART miRNA copy numbers in each sample to the cell-derived U6 snRNA. We then calculated the amount of each miRNA relative to an arbitrary miRNA from the profile with a low copy number, miR-BART10* (Fig. 6). Overall, the profiles of the miRNAs for all of the NPC biopsy samples were strikingly similar. We conclude therefore that there is a consistent EBV miRNA expression profile associated with NPC tumors characterized by the absence of the BHRF1 miRNAs and highly variable expression of the BART miRNAs.
FIG. 6.
EBV miRNA profile in NPC. BART miRNAs were quantified using synthetic miRNAs as standard controls and normalized to expression of the ubiquitous small nucleolar RNA RNU6b. The level of each miRNA is shown relative to the expression of miR-BART10*. (A) ebv-miR-BHRF1; (B) ebv-miR-BART2; (C) ebv-miR-BART cluster 1; (D) ebv-miR-BART cluster 2. †, ebv-miR-BHRF1 miRNAs were not detected in any of the biopsy samples. *, The dominant miRNA when two are derived from the same stem-loop precursor.
BHRF1-derived miRNAs are absent from NPC tumor cells but not cell lines.
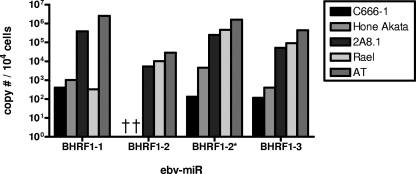
It has been proposed previously, based on studies in cell lines by Northern blotting, that the BHRF1-derived miRNAs are absent from NPC (6). Consistent with this, we found that the BHRF1-derived miRNAs were undetectable by our technique in the NPC biopsy material (Fig. 5 and 6). Our inability to detect the BHRF1 miRNAs in biopsy material was not due to a failure of our assay, since we were readily able to detect the BHRF1 miRNAs in collection of cell lines that we tested (Fig. 7). These included the EBV-positive NPC-derived epithelial cell lines studied previously (C666-1 and HONE Akata) that express latency II, a B-cell line expressing latency III (AT), and a B-cell line expressing latency I (Rael). In passing, it is noteworthy that we observed no obvious correlation between latency stage and BHRF1 miRNA expression in the cell lines.
FIG. 7.
BHRF1 miRNAs are expressed in cell lines. BHRF1 miRNAs were quantified using synthetic miRNAs as standard controls. Copy numbers of BHRF1 miRNAs per 104 cells of the NPC cell lines C666-1 and Hone Akata, the Burkitt's lymphoma-derived lines 2A8.1 and Rael, and the lymphoblastoid cell line AT are shown. †, Not detected.
The detection of BHRF1 miRNAs in the NPC cell lines might suggest that they are not representative of the tumors in terms of BHRF1 expression. However, estimates of per-cell expression in the NPC lines indicated that all four BHRF1-derived miRNAs were present in very low copy numbers (≤1 copy per cell, Fig. 7) similar to that of the least-abundant BART-derived miRNAs. It is unlikely that these miRNAs are present in sufficient abundance to affect the behavior of at least the vast bulk of the cells in the C666-1 cell line.
Since there were approximately 103 to 104 cell equivalents in the biopsy PCRs (based on EBER or β-actin levels [see below]) and our PCRs can detect at least 10 copies of the miRNAs, we can estimate that the BHRF1 miRNAs were present at <0.001 to <0.01 copies per tumor cell in the biopsy samples. This result highlights the sensitivity and validates the utility of our approach in allowing us to definitively conclude that the BHRF1 miRNAs were not present in the five NPC tumor biopsy samples we have studied. We conclude, therefore, that the prediction of Cai et al. (6) that BHRF1 miRNAs are not expressed in NPC is true for tumor cells but not for the NPC-derived cell lines.
miRNA expression in the NPC cell line C666-1.
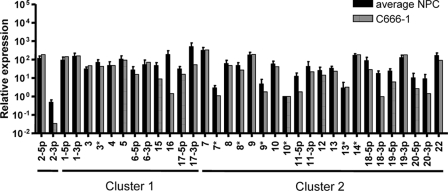
The EBV-positive NPC cell line C666-1 has been widely used in NPC studies, including analysis of miRNA expression (6, 10, 21). Therefore, it is important to verify that EBV miRNA expression in C666-1 cells faithfully represents primary NPC biopsy samples. We have already shown that, unlike the biopsy samples, the BHRF1 miRNAs were readily detectable in C666-1, albeit at low levels (Fig. 7). However, the overall BART miRNA expression profile in C666-1 was similar to the average profile for the NPC biopsy samples (Fig. 8) with some notable exceptions. For example, miR-BART2-3p and miR-BART16 were present in C666-1 at <10% of the level seen in the biopsy materials. Determining whether these differences have functional implications will have to await description of their functions and their profiling in other infected cell types.
FIG. 8.
Comparison of BART miRNA expression in NPC biopsy samples and the NPC-derived cell line C666-1. The average BART miRNA profiles of the five NPC samples from Fig. 6 are shown compared to BART miRNA expression in the NPC cell line C666-1. Analysis was performed as in Fig. 6.
In conclusion, our analysis reveals that that there is a reproducible EBV miRNA profile found in NPC tumors and that for most, but not all, miRNAs the profile in the C666-1 cell line is representative of NPC tumors.
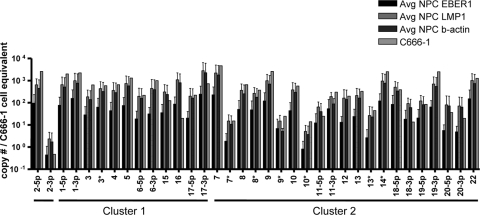
Copy numbers of BART miRNAs in NPC biopsy tumor cells.
It has been reported that BART miRNAs are present at high copy numbers in NPC cell lines compared to B-cell lines (6), but this observation remains to be confirmed in primary tumors. To calculate miRNA copy number per cell in the primary tumors, we need to know the number of input tumor cells used to make the RNA from each biopsy sample. However, it is not possible to directly determine this due to the small size and heterogeneity of NPC biopsy samples and the small amount of RNA obtained. Therefore, we developed an approach that would allow us to estimate this (see Materials and Methods for details). Briefly, we used the NPC-derived cell line C666-1 to generate calibration curves for the total cell number versus RT-PCR signal for the cellular gene β-actin and the two EBV genes EBER 1 and LMP1. We then performed RT-PCR for EBER1, LMP1, and β-actin on the biopsy samples. The resulting RT-PCR signals, combined with the C666-1 calibration curves, were then used to estimate the average number of input cells (based on beta actin) or tumor cells (based on EBER or LMP1) from each biopsy sample used in the miRNA PCRs. From this value and the data shown in Fig. 5 we calculated the copy number of each miRNA per cell (Fig. 9). The values were consistently ∼10-fold lower for the EBER than for the LMP1 or actin-based calculations, suggesting a disparity in the relative copy numbers of EBER and LMP1 RNAs between C666-1 and the tumors. Nevertheless, some general conclusions can be drawn. First, it was apparent that the BART miRNAs were present in the biopsy samples in a wide range of copy numbers with most in the range of ∼1 × 10² to ∼5 × 10⁴ copies. However, some (e.g., miR-BART2-3p, miR-BART7*, and miR-BART10*) were only present at about 1 to 10 copies per cell. Whether this represents a small copy number in every cell or high copy number in a small number of cells cannot be resolved by our technique. Second, it was apparent that the average copy numbers in the biopsy samples was very similar to that in the C666-1 line, again confirming that this cell line is generally representative of biopsy samples in terms of BART miRNA expression. However, when we compared copy numbers to those in a collection of other cell lines we were unable to discern a trend whereby some or all of the BART miRNAs were more highly expressed in NPC (data not shown). The cell lines included a second EBV-positive NPC-derived epithelial cell (HONE Akata), a B-cell line transformed in vitro with EBV and expressing latency III (AT), and a B-cell line expressing the EBNA1 only program characteristically expressed in Burkitt's lymphoma (Rael).
FIG. 9.
Estimated copies of EBV miRNAs per cell in NPC biopsy samples. The average copy number per cell for each BART miRNA was calculated and compared to the NPC cell line C666-1. RT-PCR was used to estimate EBV-positive (EBER1 or LMP1) or total cells (beta actin) in each biopsy sample based on the EBER1, LMP1, or actin RT-PCR signals from known numbers of C666-1 cells (for details see Materials and Methods). The copy numbers for each miRNA (Fig. 5) were then divided by the estimated cell number to derive the estimated copy number per C666-1 cell equivalents in each NPC biopsy sample. The values obtained for the five NPC biopsy samples were averaged, and the mean values, with the standard deviations, are plotted.
In conclusion, our analysis demonstrates that the prediction of Cai et al. (6) that BART miRNAs are expressed at high copy numbers in NPC tumors was true for most but not all of the miRNAs. However, we were unable to confirm that BART miRNAs are more highly expressed in NPC cell lines than in infected B-cell lines expressing other latency programs. Whether this will hold true for infected cells in vivo or the B-cell tumors themselves requires a comprehensive comparative analysis of miRNA expression in those tissues.
DISCUSSION
In this study we have established a quantitative multiplex PCR technique to profile 39 of the 40 mature EBV-encoded miRNAs known to date and used it to describe the profile for NPC tumor biopsy samples. This is the first time that a comprehensive, quantitative profile of EBV miRNAs has been described for any EBV-infected cell type and is the first profiling of EBV miRNAs for any EBV-associated cancer. In addition, we were able to determine the profile with as little as 250 ng of sample RNA. The sensitivity and specificity of this technique make it ideal for screening the small amounts of material available from tumor biopsy samples. One concern with analysis of biopsy material is that the integrity of the RNA extracted from them may be compromised. In addition to the five biopsy samples reported here we have tested five other NPC biopsy samples where the RNA showed varying levels of degradation and the expression profiles were essentially indistinguishable from those obtained with intact biopsy RNA (data not shown). Thus, the technique remains robust even with samples containing highly degraded RNA, a point of considerable practical importance for analysis of biopsy material that may have been collected or stored under suboptimal conditions.
Previous studies have made predictions about differential EBV miRNA expression based on studies in cell lines(6). However, it is well known that the pattern of EBV latent protein expression is strongly affected by in vitro culture. The classic example was the demonstration that BL tumors only express EBNA1 but upon tissue culture drift to express all of the nine known latent proteins (36, 40). Similarly, with in vitro infection the virus persists in proliferating blasts that express all of the latent proteins but in vivo it persists in resting cells that express no viral proteins (reviewed in reference 34). It is essential, therefore, to confirm that cell lines are representative of the primary tissue. In the present study we have confirmed the hypothesis of Cai et al. (6) that NPC does not express the BHRF1 miRNAs; however, we could not confirm their claim that all of the BART miRNAs are present at high copy numbers. It is likely that their inability to detect BHRF1 miRNAs in NPC cell lines was a function of lack of sensitivity not because the BHRF1 miRNAs are truly absent.
Profiling of miRNA expression is currently an active area of research in an attempt to correlate individual miRNAs with specific biological states or functions and with disease, especially cancer (13). Several approaches are used, including direct cloning, microarray, and PCR, and each approach has its strengths and drawbacks. Wu et al. demonstrated that while each method differed slightly, the general observations made with all three methods correlated with one another (37). The main limitation of the stem-loop RT-PCR approach used in the present study arises due to polymorphisms that may occur at the 3′ end of the miRNAs. The significance of these variations remains unclear. One possibility is that they are cloning artifacts, but it has also been suggested that they provide a mechanism for increasing the diversity of miRNA targets (37). Until we know more about the targets of the miRNAs and their variants, we will not know the significance of these end polymorphisms. One problem with variants is that they could affect the efficiency of the PCR used in our assay. For the nine EBV miRNAs for which variants have been listed in miRBase, decreased efficiency of PCR does not seem to be a concern in our assays. This provides confidence that the profile we have described is as accurate as possible given the state of the field. Furthermore, given the limited amount of material available from biopsies, our technique presents a practical approach to comprehensive profiling. Ultimately, the goal would be to confirm differences detected by multiplexed PCR either by microarray or based on functional assignations.
Several studies have used direct cloning and Northern blots to identify the known EBV miRNAs and to examine EBV miRNA expression in different cell types (6, 10, 19, 21, 28, 39). However, Northern blot analysis provides a qualitative measure of relative levels of miRNA expression, and the high amount of RNA needed makes it prohibitive for profiling multiple miRNAs, especially for samples with limited amounts of RNA such as biopsy samples. Thus, if a miRNA is not detected using Northern blotting, it is not possible to determine whether it is truly absent or if it is below the limit of detection. By comparison the multiplex PCR technique used in the present study is quantitative over a wide range of miRNA copy numbers and is highly sensitive. It can routinely measure as few as 10 copies of any given miRNA and the profile for all 39 miRNAs can be derived from quantities of RNA far lower than the amounts required for Northern blots. A simple calculation makes this immediately apparent. From an NPC needle biopsy sample (about the size of a rice grain) one can typically obtain about 106 cells or about 2 μg of RNA. Typically, a single Northern blot to detect EBV miRNAs requires from 5 to 30 μg of RNA (6, 10). Therefore, at best it might be possible to perform one blot for a single EBV miRNA with RNA from a biopsy sample. Stripping and reprobing the blot might increase this to four miRNAs but in order to profile 39 miRNAs by Northern blot it would require 50 to 300 μg of RNA, an impossibility with biopsy material. In comparison, as described in Materials and Methods, with our technique we could perform PCRs for all 39 EBV miRNAs in duplicate with 250 to 350 ng of RNA, i.e., significantly less than that available from a biopsy sample. Furthermore, for the BART miRNAs we are well in the linear range of detection for our samples, and so for these we could easily have profiled tenfold less material, i.e., <25 ng. Therefore, our technique is at least a thousandfold more sensitive than Northern blotting. This makes our approach ideal for small or rare samples. The sensitivity of this assay allowed us to detect miRNAs such as the BHRF1 miRNAs and miR-BART8 that have previously been reported to be undetectable by Northern blot in the NPC cell line C666-1 (6, 10). Because of the quantitative nature of the technique, we are able to make definitive statements about miRNA expression levels within samples. Thus, we may conclude that the BHRF1 miRNAs were not present in the five NPC tumor biopsy samples we have studied but miR-BART8 was expressed. In addition, we are able to normalize the miRNA expression using the internal control U6 and other markers, making it possible to compare miRNA profiles between samples.
The different EBV latency states, as defined by variable patterns of latent protein expression, are associated with different tumors, and it has been hypothesized that this may also hold true for miRNA expression in vivo. Using the multiplex approach it is now possible to rigorously test this idea by performing comprehensive, quantitative EBV miRNA profiling on other EBV-infected normal and malignant tissues. This may also provide insights into the possible functions of these miRNAs.
There have been limited studies linking EBV miRNAs to biological functions. It has been claimed previously that the BHRF1 miRNAs are only readily detectable in B cells infected with EBV expressing the growth program (5). In addition, it has been proposed that they are associated with viral replication, and it has been shown that BHRF1 miRNA expression increases upon induction of viral replication (39). Our results demonstrate that these miRNAs are expressed in a wide range of cell lines, including the Rael (latency I) C666-1 (latency II) and AT (latency III), but are absent from the five fresh NPC tumor biopsy samples we have studied here. Since NPC tumors are known to not express the growth program and to be tightly latent, the low expression profile of BHRF1 miRNAs in the C666-1 cell line is likely due either to spontaneous reactivation of the virus in a small subset of cells or the drifting of a few cells toward the growth program in culture (25, 39). Either way, our data show that NPC tumors are indeed very tightly latent as judged by BHRF1 miRNA expression.
In summary, this work provides a quantitative analysis of the EBV miRNA expression profile in five biopsy samples of the EBV-associated cancer NPC. It will be interesting to see the evolution of the profile as additional data emerge for EBV miRNA expression using alternative methods, such as microarray analysis. This study is the first step in defining EBV miRNA profiles in cancer and, as more targets are identified may aid in the discovery of the role that EBV plays in oncogenesis.
Supplementary Material
Acknowledgments
This study was supported by Public Health Service grants R01 CA65883, R01 AI18757, and RO1 AI062989 to D.A.T.-L.
Footnotes
Published ahead of print on 17 December 2008.
Supplemental material for this article may be found at http://jvi.asm.org/.
REFERENCES
- 1.Ambros, V., and R. C. Lee. 2004. Identification of microRNAs and other tiny noncoding RNAs by cDNA cloning. Methods Mol. Biol. 265131-158. [DOI] [PubMed] [Google Scholar]
- 2.Arrand, J. R., L. S. Young, and J. D. Tugwood. 1989. Two families of sequences in the small RNA-encoding region of Epstein-Barr virus (EBV) correlate with EBV types A and B. J. Virol. 63983-986. [DOI] [PMC free article] [PubMed] [Google Scholar]
- 3.Barth, S., T. Pfuhl, A. Mamiani, C. Ehses, K. Roemer, E. Kremmer, C. Jaker, J. Hock, G. Meister, and F. A. Grasser. 2008. Epstein-Barr virus-encoded microRNA miR-BART2 down-regulates the viral DNA polymerase BALF5. Nucleic Acids Res. 36666-675. [DOI] [PMC free article] [PubMed] [Google Scholar]
- 4.Brooks, L. A., A. L. Lear, L. S. Young, and A. B. Rickinson. 1993. Transcripts from the Epstein-Barr virus BamHI A fragment are detectable in all three forms of virus latency. J. Virol. 673182-3190. [DOI] [PMC free article] [PubMed] [Google Scholar]
- 5.Cai, X., C. H. Hagedorn, and B. R. Cullen. 2004. Human microRNAs are processed from capped, polyadenylated transcripts that can also function as mRNAs. RNA 101957-1966. [DOI] [PMC free article] [PubMed] [Google Scholar]
- 6.Cai, X., A. Schafer, S. Lu, J. P. Bilello, R. C. Desrosiers, R. Edwards, N. Raab-Traub, and B. R. Cullen. 2006. Epstein-Barr virus microRNAs are evolutionarily conserved and differentially expressed. PLoS Pathog. 2e23. [DOI] [PMC free article] [PubMed] [Google Scholar]
- 7.Cameron, J. E., Q. Yin, C. Fewell, M. Lacey, J. McBride, X. Wang, Z. Lin, B. C. Schaefer, and E. K. Flemington. 2008. Epstein-Barr virus latent membrane protein 1 induces cellular MicroRNA miR-146a, a modulator of lymphocyte signaling pathways. J. Virol. 821946-1958. [DOI] [PMC free article] [PubMed] [Google Scholar]
- 8.Chen, C., D. A. Ridzon, A. J. Broomer, Z. Zhou, D. H. Lee, J. T. Nguyen, M. Barbisin, N. L. Xu, V. R. Mahuvakar, M. R. Andersen, K. Q. Lao, K. J. Livak, and K. J. Guegler. 2005. Real-time quantification of microRNAs by stem-loop RT-PCR. Nucleic Acids Res. 33e179. [DOI] [PMC free article] [PubMed] [Google Scholar]
- 9.Chen, H. L., M. M. Lung, J. S. Sham, D. T. Choy, B. E. Griffin, and M. H. Ng. 1992. Transcription of BamHI-A region of the EBV genome in NPC tissues and B cells. Virology 191193-201. [DOI] [PubMed] [Google Scholar]
- 10.Edwards, R. H., A. R. Marquitz, and N. Raab-Traub. 2008. Epstein-Barr virus BART microRNAs are produced from a large intron prior to splicing. J. Virol. 829094-9106. [DOI] [PMC free article] [PubMed] [Google Scholar]
- 11.Fields, B. N., D. M. Knipe, and P. M. Howley. 2007. Fields' virology, 5th ed. Wolters Kluwer Health/Lippincott/The Williams & Wilkins Co., Philadelphia, PA.
- 12.Filipowicz, W., S. N. Bhattacharyya, and N. Sonenberg. 2008. Mechanisms of posttranscriptional regulation by microRNAs: are the answers in sight? Nat. Rev. Genet. 9102-114. [DOI] [PubMed] [Google Scholar]
- 13.Garofalo, M., G. Condorelli, and C. M. Croce. 2008. MicroRNAs in diseases and drug response. Curr. Opin. Pharmacol. 8661-667. [DOI] [PubMed] [Google Scholar]
- 14.Gilligan, K. J., P. Rajadurai, J. C. Lin, P. Busson, M. Abdel-Hamid, U. Prasad, T. Tursz, and N. Raab-Traub. 1991. Expression of the Epstein-Barr virus BamHI A fragment in nasopharyngeal carcinoma: evidence for a viral protein expressed in vivo. J. Virol. 656252-6259. [DOI] [PMC free article] [PubMed] [Google Scholar]
- 15.Glickman, J. N., J. G. Howe, and J. A. Steitz. 1988. Structural analyses of EBER1 and EBER2 ribonucleoprotein particles present in Epstein-Barr virus-infected cells. J. Virol. 62902-911. [DOI] [PMC free article] [PubMed] [Google Scholar]
- 16.Grundhoff, A., C. S. Sullivan, and D. Ganem. 2006. A combined computational and microarray-based approach identifies novel microRNAs encoded by human gamma-herpesviruses. RNA 12733-750. [DOI] [PMC free article] [PubMed] [Google Scholar]
- 17.He, L., and G. J. Hannon. 2004. MicroRNAs: small RNAs with a big role in gene regulation. Nat. Rev. Genet. 5522-531. [DOI] [PubMed] [Google Scholar]
- 18.Joncas, J., J. Boucher, M. Granger-Julien, and C. Filion. 1974. Epstein-Barr virus infection in the neonatal period and in childhood. Can. Med. Assoc. J. 11033-37. [PMC free article] [PubMed] [Google Scholar]
- 19.Kim do, N., H. S. Chae, S. T. Oh, J. H. Kang, C. H. Park, W. S. Park, K. Takada, J. M. Lee, W. K. Lee, and S. K. Lee. 2007. Expression of viral microRNAs in Epstein-Barr virus-associated gastric carcinoma. J. Virol. 811033-1036. [DOI] [PMC free article] [PubMed] [Google Scholar]
- 20.Kong, W., J. J. Zhao, L. He, and J. Q. Cheng. 2009. Strategies for profiling microRNA expression. J. Cell Physiol. 21822-25. [DOI] [PubMed] [Google Scholar]
- 21.Lo, A. K., K. F. To, K. W. Lo, R. W. Lung, J. W. Hui, G. Liao, and S. D. Hayward. 2007. Modulation of LMP1 protein expression by EBV-encoded microRNAs. Proc. Natl. Acad. Sci. USA 10416164-16169. [DOI] [PMC free article] [PubMed] [Google Scholar]
- 22.Masucci, M. G., and I. Ernberg. 1994. Epstein-Barr virus: adaptation to a life within the immune system. Trends Microbiol. 2125-130. [DOI] [PubMed] [Google Scholar]
- 23.Nanbo, A., K. Inoue, K. Adachi-Takasawa, and K. Takada. 2002. Epstein-Barr virus RNA confers resistance to interferon-alpha-induced apoptosis in Burkitt's lymphoma. EMBO J. 21954-965. [DOI] [PMC free article] [PubMed] [Google Scholar]
- 24.Niederman, J. C., R. W. McCollum, G. Henle, and W. Henle. 1968. Infectious mononucleosis: clinical manifestations in relation to EB virus antibodies. JAMA 203205-209. [DOI] [PubMed] [Google Scholar]
- 25.Niedobitek, G., A. Agathanggelou, and J. M. Nicholls. 1996. Epstein-Barr virus infection and the pathogenesis of nasopharyngeal carcinoma: viral gene expression, tumour cell phenotype, and the role of the lymphoid stroma. Semin. Cancer Biol. 7165-174. [DOI] [PubMed] [Google Scholar]
- 26.Nilsson, K., G. Klein, W. Henle, and G. Henle. 1971. The establishment of lymphoblastoid lines from adult and fetal human lymphoid tissue and its dependence on EBV. Int. J. Cancer 8443-450. [DOI] [PubMed] [Google Scholar]
- 27.Pfeffer, S., A. Sewer, M. Lagos-Quintana, R. Sheridan, C. Sander, F. A. Grasser, L. F. van Dyk, C. K. Ho, S. Shuman, M. Chien, J. J. Russo, J. Ju, G. Randall, B. D. Lindenbach, C. M. Rice, V. Simon, D. D. Ho, M. Zavolan, and T. Tuschl. 2005. Identification of microRNAs of the herpesvirus family. Nat. Methods 2269-276. [DOI] [PubMed] [Google Scholar]
- 28.Pfeffer, S., M. Zavolan, F. A. Grasser, M. Chien, J. J. Russo, J. Ju, B. John, A. J. Enright, D. Marks, C. Sander, and T. Tuschl. 2004. Identification of virus-encoded microRNAs. Science 304734-736. [DOI] [PubMed] [Google Scholar]
- 29.Rosa, M. D., E. Gottlieb, M. R. Lerner, and J. A. Steitz. 1981. Striking similarities are exhibited by two small Epstein-Barr virus-encoded ribonucleic acids and the adenovirus-associated ribonucleic acids VAI and VAII. Mol. Cell. Biol. 1785-796. [DOI] [PMC free article] [PubMed] [Google Scholar]
- 30.Sassen, S., E. A. Miska, and C. Caldas. 2008. MicroRNA: implications for cancer. Virchows Arch. 4521-10. [DOI] [PMC free article] [PubMed] [Google Scholar]
- 31.Smith, P. R., O. de Jesus, D. Turner, M. Hollyoake, C. E. Karstegl, B. E. Griffin, L. Karran, Y. Wang, S. D. Hayward, and P. J. Farrell. 2000. Structure and coding content of CST (BART) family RNAs of Epstein-Barr virus. J. Virol. 743082-3092. [DOI] [PMC free article] [PubMed] [Google Scholar]
- 32.Stevens, S. J., S. A. Verkuijlen, B. Hariwiyanto, D. K. Harijadi, Paramita, J. Fachiroh, M. Adham, I. B. Tan, S. M. Haryana, and J. M. Middeldorp. 2006. Noninvasive diagnosis of nasopharyngeal carcinoma: nasopharyngeal brushings reveal high Epstein-Barr virus DNA load and carcinoma-specific viral BARF1 mRNA. Int. J. Cancer 119608-614. [DOI] [PubMed] [Google Scholar]
- 33.Thorley-Lawson, D. A. 2005. EBV the prototypical human tumor virus—just how bad is it? J. Allergy Clin. Immunol. 116251-262. [DOI] [PubMed] [Google Scholar]
- 34.Thorley-Lawson, D. A. 2001. Epstein-Barr virus: exploiting the immune system. Nat. Rev. Immunol. 175-82. [DOI] [PubMed] [Google Scholar]
- 35.van Beek, J., A. A. Brink, M. B. Vervoort, M. J. van Zijp, C. J. Meijer, A. J. van den Brule, and J. M. Middeldorp. 2003. In vivo transcription of the Epstein-Barr virus (EBV) BamHI-A region without associated in vivo BARF0 protein expression in multiple EBV-associated disorders. J. Gen. Virol. 842647-2659. [DOI] [PubMed] [Google Scholar]
- 36.Wang, F., C. Gregory, C. Sample, M. Rowe, D. Liebowitz, R. Murray, A. Rickinson, and E. Kieff. 1990. Epstein-Barr virus latent membrane protein (LMP1) and nuclear proteins 2 and 3C are effectors of phenotypic changes in B lymphocytes: EBNA-2 and LMP1 cooperatively induce CD23. J. Virol. 642309-2318. [DOI] [PMC free article] [PubMed] [Google Scholar]
- 37.Wu, H., J. R. Neilson, P. Kumar, M. Manocha, P. Shankar, P. A. Sharp, and N. Manjunath. 2007. miRNA profiling of naive, effector and memory CD8 T cells. PLoS ONE. 2e1020. [DOI] [PMC free article] [PubMed] [Google Scholar]
- 38.Xia, T., A. O'Hara, I. Araujo, J. Barreto, E. Carvalho, J. B. Sapucaia, J. C. Ramos, E. Luz, C. Pedroso, M. Manrique, N. L. Toomey, C. Brites, D. P. Dittmer, and W. J. Harrington, Jr. 2008. EBV microRNAs in primary lymphomas and targeting of CXCL-11 by ebv-mir-BHRF1-3. Cancer Res. 681436-1442. [DOI] [PMC free article] [PubMed] [Google Scholar]
- 39.Xing, L., and E. Kieff. 2007. Epstein-Barr virus BHRF1 micro- and stable RNAs during latency III and after induction of replication. J. Virol. 819967-9975. [DOI] [PMC free article] [PubMed] [Google Scholar]
- 40.Zhang, L., K. Hong, J. Zhang, and J. S. Pagano. 2004. Multiple signal transducers and activators of transcription are induced by EBV LMP-1. Virology 323141-152. [DOI] [PubMed] [Google Scholar]
Associated Data
This section collects any data citations, data availability statements, or supplementary materials included in this article.


