Abstract
Mitoferrin 1 and mitoferrin 2 are homologous members of the mitochondrial solute carrier family. Mitoferrin 1 is required for mitochondrial iron delivery in developing erythrocytes. Here we show that mitoferrin 1 and mitoferrin 2 contribute to mitochondrial iron delivery in a variety of cells. Reductions in mitoferrin 1 and/or mitoferrin 2 levels by RNA interference result in decreased mitochondrial iron accumulation, heme synthesis, and iron-sulfur cluster synthesis. The ectopic expression of mitoferrin 1 in nonerythroid cells silenced for mitoferrin 2 or the expression of mitoferrin 2 in cells silenced for mitoferrin 1 restored heme synthesis to “baseline” levels. The ectopic expression of mitoferrin 2, however, did not support hemoglobinization in erythroid cells deficient in mitoferrin 1. Mitoferrin 2 could not restore heme synthesis in developing erythroid cells because of an inability of the protein to accumulate in mitochondria. The half-life of mitoferrin 1 was increased in developing erythroid cells, while the half-life of mitoferrin 2 did not change. These results suggest that mitochondrial iron accumulation is tightly regulated and that controlling mitoferrin levels within the mitochondrial membrane provides a mechanism to regulate mitochondrial iron levels.
Iron is a required element for all eukaryotes, but iron can be toxic at high concentrations. Consequently, the cellular acquisition of iron is highly regulated, as is the concentration of free iron in biological fluids. The regulation of iron concentration is extended to cellular organelles that either store or utilize iron. Mitochondria utilize iron for the synthesis of heme and iron-sulfur (Fe-S) clusters. These prosthetic groups are used within the mitochondria and are exported for use by cytosolic and nuclear proteins. The mechanisms that regulate mitochondrial iron levels are not known, although it is clear that mitochondrial iron levels must be regulated. For example, the loss of function mutations in genes that encode enzymes required for Fe-S cluster synthesis or the Atm1 transporter that exports Fe-S clusters, results in excessive mitochondrial iron accumulation in yeast and humans (for a review, see reference 11).
The mechanisms that regulate mitochondrial iron pools are not well defined. Mitochondrial iron pools might be regulated at the level of import. Mitoferrin 1 (Mfrn1) has been shown to be required for mitochondrial iron import in developing erythroid cells. A mutation in zebrafish Mfrn1 (frascati) or the deletion of mouse Mfrn1 leads to defects in hemoglobinization due to a deficit in mitochondrial iron uptake (17). The phenotype of frascati zebrafish is restricted to developing red blood cells; other cell types showed no evidence of a mitochondrial iron phenotype. Mfrn1 has a paralogue, Mfrn2, and both genes have homologues MRS3 and MRS4 in Saccharomyces cerevisiae. Yeast with deletions of MRS3 and MRS4 grows poorly under low iron conditions due to impaired mitochondrial iron acquisition (5, 10, 13, 23). In yeast, the expression of Mfrn1 or Mfrn2 in Δmrs3 Δmrs4 cells can correct the poor growth under low iron conditions. The expression of either mouse or zebrafish Mfrn1 as a transgene in frascati zebrafish corrected the hemoglobin deficiency in cells, but the expression of Mfrn2 did not (17). These observations raise three questions. (i) What is the role of Mfrn2 in mitochondrial iron metabolism? (ii) Is iron transport into mitochondria regulated? (iii) If Mfrn2 transports iron into the mitochondria of vertebrate cells, why doesn't Mfrn2 rescue the mitochondrial defect in Mfrn1-deficient zebrafish?
Here, we show that Mfrn1 and Mfrn2 can transport iron into the mammalian mitochondria of nonerythroid cells. The ectopic expression of either Mfrn1 or Mfrn2 can restore mitochondrial iron transport in cells silenced for Mfrn2 and -1, respectively, but ectopic expression has little effect on increasing mitochondrial iron levels above the baseline values. Mitochondrial iron levels do not increase over the baseline because the levels of Mfrns are regulated posttranslationally. Mfrn1 accumulates in the mitochondria of developing red blood cells as a result of an increased protein half-life. In contrast, Mfrn2 does not accumulate in developing red blood cells or other cells, as the half-life of Mfrn2 protein remains constant.
MATERIALS AND METHODS
Tissue culture.
CHO (TRVb and CHO-TfR) cells were maintained in Ham's F12 medium with 10% fetal bovine serum (FBS). Mouse embryonic stem (ES) cells (Mfrn1+/− and Mfrn1−/−) were maintained in Dulbecco's minimal essential medium (Invitrogen, Carlsbad, CA), containing heat-inactivated 15% FBS with G418 (250 mg/ml), 0.6% β-mercaptoethanol, and 10 ng/ml ESGRO as described previously (17). NIH 3T3 mouse fibroblasts and murine erythroleukemia (MEL) cells (DS19 clone) were maintained in Dulbecco's minimal essential medium, containing 10% FBS. MEL cells were differentiated by incubating the cells in 10% dimethyl sulfoxide (DMSO) for 4 days.
Transfection and microscopy.
Cells were transfected with the pEGFP, pEGFP-Mfrn1, pEGFP-Mfrn2, pFerroportin-GFP, or pCMV-H-Ferritin construct using AMAXA nucleofector (Gaithersburg, MD). A 5′ iron responsive element (IRE)-green fluorescent protein (GFP) reporter construct (8), obtained from Jonathan Barasch (Columbia University), was transfected into undifferentiated and differentiated MEL cells using the AMAXA Nucleofector. For the mitochondrial colocalization, NIH 3T3 cells transfected with pEGFP-Mfrn2 were incubated with 25 nM Mitotracker-Red for 15 min. The cells were visualized using an epifluorescence microscope (Olympus, Inc., Melville, NY) with a 60× oil immersion objective. Images were acquired using Pictureframe software (Optronics, Goleta, CA).
Mitochondrial extraction.
Mitochondria were extracted from NIH 3T3 cells and mouse liver by homogenizing in mitochondrial buffer (0.2 mM EDTA, 0.25 M sucrose, 10 mM Tris-HCl [pH 7.8]), followed by centrifugation at 1,000 × g for 10 min at 4°C. The supernatant was further centrifuged at 12,000 × g for 10 min at 4°C to pellet mitochondria. The crude mitochondrial fraction was centrifuged over a sucrose step gradient at 80,000 × g for 2 h at 4°C, and the mitochondrial fraction was collected as a layer between 1.0 and 1.3 M sucrose.
Silencing using siRNA.
Cells were silenced for 48 h using SiGenome small interfering RNA (siRNA) pools for Mfrn1 and/or Mfrn2 or nonspecific siRNA pools from Dharmacon (Lafayette, CO). The oligonucleotides were introduced into cells using Oligofectamine (Invitrogen, Carlsbad, CA). For differentiating MEL cells, the cells were differentiated for 2 days and then were silenced for Mfrn1 and/or Mfrn2 for two more days during differentiation.
Heme and protoporphyrin assay.
Cells were silenced for Mfrn1 and/or Mfrn2 overnight, followed by overnight incubation in bathophenanthroline disulfonate (200 mM). Heme measurements were performed as described previously (21). The cells were given 59Fe-Tf(Fe)2 (100 nM) for 8 h along with δ-aminolevulinic acid (ALA, 1.2 mM; Porphyrin Products, Logan, UT). The cells were washed twice with phosphate-buffered saline and were lysed using lysis buffer (1% Triton X-100, 150 mM NaCl, 10 mM Tris-HCl [pH 7.2], 0.5 mM EDTA) containing protease inhibitor cocktail (Roche, Burlington, NC). After 30 min on ice, the samples were centrifuged at 13,000 × g for 10 min at 4°C. The lysate was denatured by 0.1 N HCl, and an equal volume of 3:1 ethyl acetate-acetic acid was added to extract the organic fraction. 59Fe incorporation was measured by counting radioactivity in a gamma counter. Protoporphyrin IX was measured as fluorescence on a Perkin-Elmer fluorescence spectrophotometer using an excitation wavelength of 405 nm and an emission wavelength of 600 nm.
Western blotting.
Cellular proteins were extracted with lysis buffer, and total protein concentrations were determined using bicinchoninic acid reagent (Pierce, Rockford, IL). The protein samples were separated on 4 to 20% acrylamide gels (Bio-Rad, Hercules, CA) and transferred onto Hybond-ECL (Amersham Biosciences, NJ). The membranes were probed using anti-Mfrn1 (1:1,000), anti-Mfrn2 (1:1,000), anti-ANT1 (1:1,000), anti-cytochrome b2 (1:500), anti-globin (1:500), anti-xanthine oxidase (1:500, a generous gift from John Hoidal), or anti-GFP (1:10,000; Abcam) antibodies with peroxidase-conjugated goat anti-rabbit immunoglobulin G or goat anti-mouse immunoglobulin G as the secondary antibody (1:10,000; Jackson ImmunoResearch, West Grove, PA). As a loading control, the membranes were probed using antitubulin antibody (1:5,000; GeneTex, San Antonio, TX). The chemiluminescent method was used for detection (Western Lightning; PerkinElmer, Boston, MA).
Metabolic 35S labeling.
Differentiated MEL cells were transfected with pEGFP-Mfrn1 or pEGFP-Mfrn2. The cells were incubated in methionine-free medium for 2 h and were given 35S-labeled methionine containing medium for 1 h. The cell lysates were collected at 0, 4, 8, 12, and 24 h after the removal of the 35S-labeled medium. Mfrn1 and Mfrn2 were immunoprecipitated using anti-GFP antibody. The immunoprecipitates were separated on 4 to 20% sodium dodecyl sulfate-polyacrylamide gel electrophoresis (SDS-PAGE) gels, transferred to nitrocellulose membranes, and exposed overnight on X-ray film to determine the expression of the proteins. The bands were scanned and quantified using Quantity One software (Bio-Rad, Hercules, CA).
Other procedures.
A ferritin analysis was performed as previously described (4). An H-ferritin immunoprecipitation was done using rabbit anti-H ferritin from Paulo Arosio (University of Brescia, Italy). A flow cytometric analysis was performed on undifferentiated or differentiated MEL cells to measure changes in 5′-IRE-GFP intensity (GFP fluorescence levels) using a Becton Dickinson FACScan operating with CellQuest software (Becton Dickinson, Franklin Lakes, NJ). Total RNA was extracted from cells using Trizol reagent, and a one-step reverse transcriptase PCR (RT-PCR) kit (Invitrogen, Palo Alto, CA) was used with 500 ng RNA using the following conditions: RT at 50°C for 50 min; PCR at 94°C for 30 s, 60°C for 40 s, and 72°C for 30 s; and 30 cycles using primers for GFP, glyceraldehyde-3-phosphate dehydrogenase (GAPDH), and actin as controls using a Peltier thermal cycler (Bio-Rad, Hercules, CA). Alternatively, quantitative PCR was performed under similar conditions using a Roche LightCycler Carousel (Roche, Burlington, NC). Xanthine oxidase activity was measured using the Amplex red xanthine/xanthine oxidase assay kit (Invitrogen, Palo Alto, CA) as per the manufacturer's instructions. Cellular proteins were extracted with lysis buffer, and the total protein concentrations were determined using bicinchoninic acid reagent (Pierce, Rockford, IL).
RESULTS
Mfrns are required for efficient mitochondrial iron delivery.
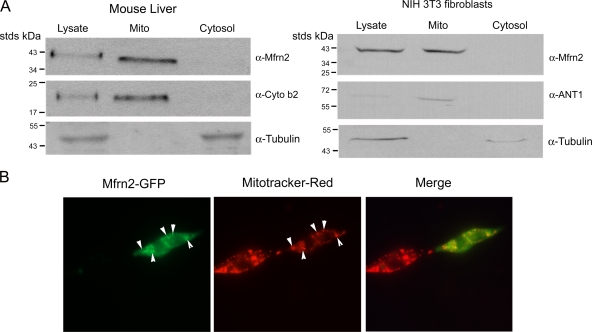
We have shown that Mfrn2 is ubiquitously expressed (17). We examined the subcellular localization of Mfrn2 in mouse liver and in NIH 3T3 mouse fibroblasts. Endogenous Mfrn2 is enriched in the mitochondrial fraction as shown by subcellular fractionation (Fig. 1A). To confirm the localization of Mfrn2, we expressed Mfrn2-GFP in 3T3 fibroblasts by transient transfection. Mfrn2 with a carboxyl-terminal epitope (GFP or FLAG) is functional (see below). Mfrn2-GFP colocalized with Mitotracker-Red dye, a mitochondrial marker (Fig. 1B). These data show that both endogenous and ectopically expressed Mfrn2 proteins are restricted to mitochondria.
FIG. 1.
Mfrn2 localizes to mitochondria. (A) Mitochondrial fractions from homogenized mouse livers and NIH 3T3 fibroblasts were separated as described in Materials and Methods. The lysate, mitochondrial fraction (Mito), and the post-mitochondrial supernatant (cytosol) were run on SDS-PAGE gels, and Western blotting was performed using anti-Mfrn2, anti-ANT1 (a mitochondrial marker), or anti-cytochrome b2 (Cyto b2; a mitochondrial marker) antibodies and antitubulin (cytosol marker). (Cytochrome b2 was undetectable in 3T3 fibroblasts). (B) NIH 3T3 fibroblasts transfected with Mfrn2-GFP were incubated with Mitotracker-Red for 15 min. Arrowheads indicate colocalization.
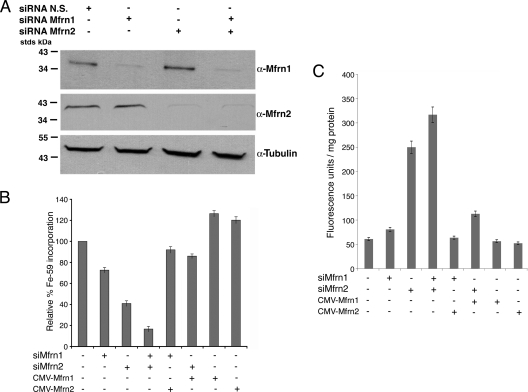
We used RNA interference to define the roles of Mfrn1 and Mfrn2 in mitochondrial iron metabolism. Mouse 3T3 fibroblasts were incubated with oligonucleotide pools specific for Mfrn1 or Mfrn2 and the levels of either protein assessed by Western blotting. The Mfrn1 and Mfrn2 protein levels were significantly reduced using siRNA (Fig. 2A). The reductions in Mfrn1 did not affect the level of Mfrn2; similarly, reductions in Mfrn2 did not affect Mfrn1, confirming the specificity of the siRNA oligonucleotides in ablating the expression of their respective target genes. To examine the effect of reduced levels of Mfrn1 and Mfrn2 on mitochondrial iron metabolism, we assayed iron incorporation into heme. To ensure that heme synthesis was not limited by the availability of protoporphyrin IX, we incubated cells with ALA to bypass the rate-limiting ALA synthase step in porphyrin synthesis in mammalian cells (for a review, see reference 1). Decreased levels of Mfrn1 reduced heme synthesis by 27%, while decreased levels of Mfrn2 reduced heme synthesis by 58% (Fig. 2B). When cells were treated with oligonucleotide pools specific for both Mfrn1 and Mfrn2, heme synthesis was reduced by 84%. Heme synthesis, in Mfrn1-silenced cells, could be restored by transfecting cells with a plasmid containing Mfrn2 under the control of the cytomegalovirus (CMV) promoter. Similarly, heme synthesis in Mfrn2-silenced cells could be restored by transfection with a CMV-regulated Mfrn1 plasmid with or without carboxyl-terminal GFP or FLAG epitopes. The expression of either Mfrn1- or Mfrn2-containing plasmids in nonsilenced cells led to, at best, a 20 to 25% increase in heme synthesis.
FIG. 2.
Reduced levels of Mfrn1 or Mfrn2 affect iron incorporation into heme. (A) NIH 3T3 fibroblasts were treated for 48 h with nonspecific (N.S.) oligonucleotides or oligonucleotides specific for Mfrn1 (siRNA Mfrn1) and/or Mfrn2 (siRNA Mfrn2). The cells were lysed, and Western blotting was performed using anti-Mfrn1, anti-Mfrn2, or antitubulin. (B) NIH 3T3 fibroblasts grown in 1.2 mM ALA were treated as described for panel A with cells simultaneously transfected with pEGFP-Mfrn1 (CMV-Mfrn1) or pEGFP-Mfrn2 (CMV-Mfrn2). Iron (59Fe) incorporation into heme was measured as described in Materials and Methods and expressed as the relative percentage of 59Fe incorporation, where 100% represents cells treated with nonspecific oligonucleotides. All data were normalized for protein. (C) Protoporphyrin IX accumulation was measured in the 3T3 fibroblasts treated as described for panel B. The data are expressed as the fluorescence units/mg of protein. Error bars represent the standard deviations of the results from three independent experiments.
The final reaction in heme biosynthesis involves the insertion of iron into protoporphyrin IX by ferrochelatase. If reduced levels of Mfrns affect mitochondrial iron uptake, then protoporphyrin IX is expected to accumulate. Indeed, the silencing of Mfrns in 3T3 fibroblasts led to an increase in cellular levels of protoporphyrin IX (Fig. 2C). Silencing Mfrn2 led to a greater increase in protoporphyrin IX than did silencing Mfrn1, and silencing both resulted in the largest increase in protoporphyrin IX, consistent with their effect on heme synthesis. The expression of Mfrn2 from a CMV-based plasmid reduced protoporphyrin IX accumulation in Mfrn1-silenced cells, as did the CMV-based expression of Mfrn1 in Mfrn2-silenced cells. These data confirm that the decrease in heme synthesis is the result of the decreased availability of iron for the reaction catalyzed by ferrochelatase.
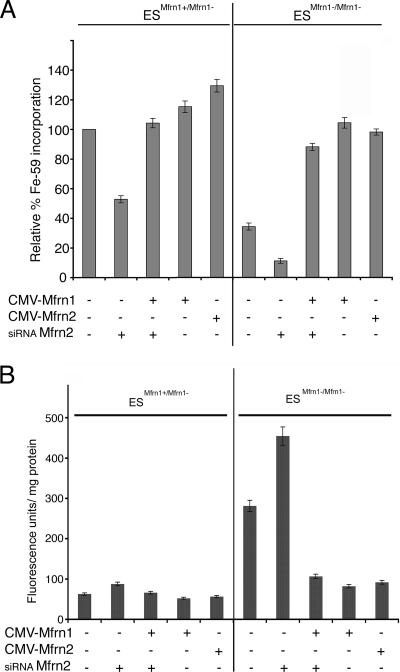
These results indicate that both Mfrn1 and Mfrn2 contribute to mitochondrial iron metabolism in nonerythroid cells. We confirmed these results using mouse ES cells that contained a targeted deletion of Mfrn1. Heme synthesis in heterozygous Mfrn1+/Mfrn1− ES cells incubated with ALA was reduced by 48% in cells treated with oligonucleotide pools specific to Mfrn2 (Fig. 3A). Heme synthesis could be restored in Mfrn2-silenced cells by transfection with a plasmid expressing Mfrn1. Heme synthesis in Mfrn1−/Mfrn1− ES cells was lower than in Mfrn1+/Mfrn1− ES cells. Heme synthesis could be restored to wild-type levels by the transfection of plasmids containing either Mfrn1 or Mfrn2. When Mfrn1+/Mfrn1− ES cells were treated with oligonucleotide pools directed against Mfrn2, heme synthesis declined to 15% of that of the Mfrn1+/Mfrn1− ES cells. The overexpression of Mfrn1 or Mfrn2 in Mfrn1+/Mfrn1− ES cells only increased heme synthesis by approximately 20%. In contrast, the overexpression of Mfrn1 or Mfrn2 in Mfrn1+/Mfrn1− ES cells increased heme synthesis to levels similar to those of Mfrn1-heterozygous ES cells. As expected, protoporphyrin accumulation increased in Mfrn1+/Mfrn1− ES cells silenced for Mfrn2, confirming that the effect of silencing was due to the inhibition of ferrochelatase by iron limitation rather than an effect on protoporphyrin synthesis (Fig. 3B). These results show that both Mfrn1 and Mfrn2 contribute to mitochondrial iron transport, that heme synthesis is severely reduced when both Mfrns are absent, and that heme synthesis can be restored in cells silenced for Mfrn1 or Mfrn2 or genetically null Mfrn1+/Mfrn1− ES cells. These data also show that when expressed by heterologous promoters, Mfrn1 and Mfrn2 are functionally redundant in nonerythroid cells.
FIG. 3.
Mfrn1 and Mfrn2 contribute to mitochondrial iron metabolism in ES cells. (A) Mouse ES cells heterozygous for the loss of Mfrn1 (ESMfrn1+/Mfrn1−) or homozygous for the loss of Mfrn1 (ESMfrn1−/Mfrn1−) were treated for 48 h with oligonucleotides specific to Mfrn2 (siRNA Mfrn2) and/or were transfected with Mfrn1-GFP (CMV-Mfrn1) or Mfrn2-GFP (CMV-Mfrn2). Iron (59Fe) incorporation into heme was measured as cpm/mg protein. The data are expressed as the relative percentages of incorporation compared to that of the nonsilenced cells. (B) Protoporphyrin IX accumulation was measured in ES cells treated as described for panel A. The data are expressed as fluorescence units/mg protein. Error bars represent the standard deviations of the results from three independent experiments.
Reduced levels of Mfrns affect cytosolic iron metabolism.
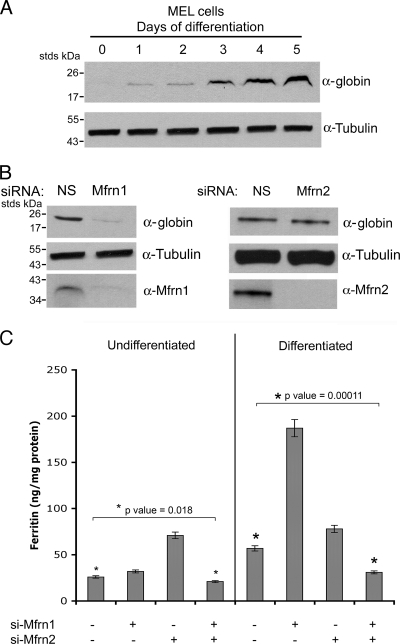
A characteristic feature of erythroid development is low levels of cytosolic ferritin in spite of high cellular iron acquisition (19). One hypothesis for the low levels of cytosolic ferritin is that iron released from transferrin in endosomes is delivered directly to the mitochondria, bypassing the cytosolic signal that would induce ferritin synthesis. An alternate hypothesis is that increased Mfrn1 levels during erythroid development increases iron transport into mitochondria, thereby limiting cytosolic iron and reducing the amount available for ferritin synthesis. To test the latter hypothesis, we treated differentiated MEL cells with Mfrn-specific oligonucleotides. MEL cells have been shown to be a useful in vitro model for erythroid differentiation (6). MEL erythroid cell differentiation represents a developmental program with a highly coordinated set of transcriptional and translational changes that lead to the formation of high concentrations of hemoglobin and other markers of erythroid cells. DMSO induction of erythroid differentiation led to hemoglobin formation as shown by globin chain accumulation (Fig. 4A). The silencing of Mfrn1 in induced MEL cells severely reduced globin accumulation (Fig. 4B), confirming previous studies demonstrating that the loss of Mfrn1 leads to defects in hemoglobinization in developing erythroid cells (18). The silencing of Mfrn2 did not affect globin accumulation, confirming that Mfrn2 does not function in the hemoglobinization of developing erythroid cells. Undifferentiated MEL cells incubated with diferric transferrin [Tf(Fe)2] contain 25 ng/mg ferritin, and the silencing of Mfrn1 had a small effect on ferritin levels. In contrast, the silencing of Mfrn2 led to a higher level of ferritin (Fig. 4C). This result is consistent with the observation that silencing Mfrn2 in nonerythroid cells has a greater effect on mitochondrial iron delivery than silencing Mfrn1 (Fig. 2). Differentiated MEL cells incubated with Tf(Fe)2 had higher levels of ferritin than undifferentiated MEL cells, which may reflect the increased expression of Tf receptors. The silencing of Mfrn1 resulted in an increase in ferritin, which was more than in cells silenced for Mfrn2. These results suggest that in differentiated MEL cells, Mfrn1 transports more iron out of the cytosol into the mitochondria than Mfrn2. Additionally, the level of endogenous Mfrn1 increases during erythroid differentiation (17). This result further confirms the importance of Mfrn1 in mitochondrial iron delivery in developing erythroid cells. The increase in ferritin synthesis when Mfrns are silenced suggests that iron acquired by cells remains in the cytosol, leading to ferritin accumulation.
FIG. 4.
Reduced levels of Mfrns affect cytosolic iron. (A) MEL cells were differentiated using DMSO. At days 1 through 5 of differentiation, cells grown in the presence of 10 μM iron (ferric ammonium citrate) were lysed, and Western blotting was performed using anti-Mfrn1, antiglobin, and antitubulin antibodies. (B) At day 2 of differentiation, MEL cells as described for panel A were treated with oligonucleotides specific to Mfrn1 or Mfrn2. Forty-eight to 72 h post-RNA interference (day 4 to 5 of differentiation), cell lysates from differentiated cells were harvested. The level of globin in Mfrn1- or Mfrn2-silenced differentiated cells was assessed by Western blotting. NS, nonspecific oligonucleotides. (C) Undifferentiated and differentiated MEL cells grown in the presence of 10 μM iron were silenced for Mfrn1, Mfrn2, or both and lysates measured for ferritin content by enzyme-linked immunosorbent assay. The data were normalized for protein levels, and error bars represent the standard deviations of the results from three independent experiments.
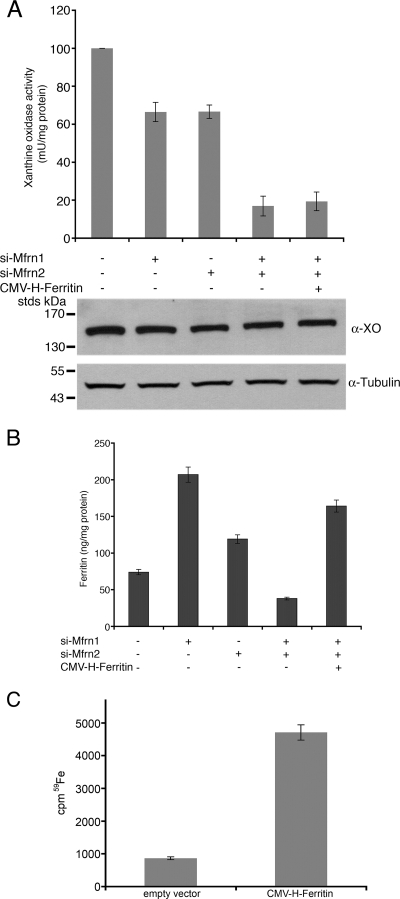
Ferritin levels were affected differently when both the Mfrn1 and Mfrn2 levels were reduced. In undifferentiated and differentiating MEL cells, the silencing of both Mfrn1 and Mfrn2 led to a decrease in ferritin below baseline levels (Fig. 4C). The decrease in cytosolic ferritin was not due to a decrease in iron uptake, as the silencing of Mfrns did not affect cellular iron acquisition (data not shown). This result suggests that decreased Mfrn-mediated iron delivery to mitochondria affects the function of the iron regulatory proteins (IRPs), which are controlling factors in ferritin translation (15). In particular, the ability of IRP1 to respond to iron and permit ferritin translation relies on Fe-S cluster synthesis. In the absence of Fe-S cluster synthesis, IRP1 is bound to the 5′ untranslated region of ferritin mRNA, preventing translation. If the loss of both Mfrn1 and Mfrn2 maintains IRP1 in the RNA binding form due to the lack of Fe-S cluster synthesis, then other cytosolic Fe-S enzymes should also be affected. We measured the level and activity of the cytosolic Fe-S-containing enzyme xanthine oxidase. The silencing of Mfrn1 or Mfrn2 alone had little effect on xanthine oxidase activity, whereas the silencing of both Mfrn1 and Mfrn2 reduced activity by 80 to 90% (Fig. 5A). The change in xanthine oxidase activity was not due to changes in protein levels, as xanthine oxidase levels were unaltered when cells were silenced for Mfrn1 and Mfrn2. The activity of xanthine oxidase requires a molybdenum cofactor that is synthesized in the mitochondria by an Fe-S cluster containing enzyme. We took a genetic approach to determine if the lack of ferritin synthesis was due to the inability of IRP1 to gain Fe-S clusters. We measured the ferritin levels in Mfrn1/2-silenced cells that had been transfected with a CMV construct of H-ferritin lacking the regulatory IRE. The expression of H-chain ferritin restored ferritin levels to that seen in cells silenced only for Mfrn1 (Fig. 5B). To determine if the transfected ferritin accumulated iron, cells silenced for Mfrn1 and Mfrn2 and transfected with CMV-H-ferritin were incubated with Tf(59Fe)2, ferritin was immunoprecipitated, and the amount of radioactivity in the immunoprecipitate was determined. The expression of H-ferritin in Mfrn1- and Mfrn2-silenced cells resulted in an increase in ferritin iron (Fig. 5C). This result demonstrates that the lack of ferritin synthesis is the result of the translational inhibition of ferritin expression by IRP1 and not an inherent deficit in the ability of Mfrn-silenced cells to accumulate cytosolic iron.
FIG. 5.
Reductions in Mfrns decrease cytosolic Fe-S clusters. (A) Xanthine oxidase activity was measured in cell lysates, and Western blot analysis of protein levels was performed using anti-xanthine oxidase (α-XO) and antitubulin antibodies. (B) Differentiated MEL cells treated as described in the legend to Fig. 4B were transfected with pCMV-H-ferritin lacking the 5′ IRE. Ferritin levels were measured in lysates as described in the legend to Fig. 4. Error bars represent the standard deviations of the results from three independent experiments. (C) Differentiated MEL cells were silenced for Mfrn1 and Mfrn2 as described above. The cells were incubated with 1 × 10⁻⁷ M Tf(59Fe)2 overnight and then washed, and the cell lysates were immunoprecipitated with anti-H-ferritin antibody. Immunoprecipitated ferritin was analyzed for 59Fe incorporation into ferritin. si-Mfrn1, oligonucleotides specific for Mfrn1; si-Mfrn2, oligonucleotides specific for Mfrn2.
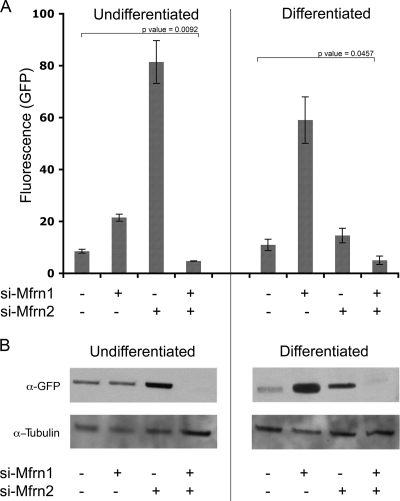
To confirm that cytosolic Fe-S levels change in Mfrn-silenced cells, we transfected cells with a plasmid containing the 5′ IRE fused to GFP into undifferentiated or differentiated MEL cells, and the effect of silencing on reporter expression was determined by flow cytometry and Western blot analysis. This reporter construct has been used previously to measure changes in cytosolic iron (8). In undifferentiated cells, the expression of the 5′ IRE-GFP reporter in Mfrn1-silenced cells was increased over the control levels as determined by flow cytometric analysis (Fig. 6A). The silencing of Mfrn2 resulted in a large increase in reporter expression. This result is consistent with the effects of silencing Mfrn2 on mitochondrial heme synthesis. In nondifferentiated cells, Mfrn2 transports more iron into mitochondria than does Mfrn1. Consequently, the loss of Mfrn2 diverts more iron to the cytosol. The silencing of both Mfrn1 and Mfrn2 resulted in a significant decrease in the expression of the reporter construct below the level in nonsilenced cells. In differentiated MEL cells, the silencing of Mfrn1 had a greater effect on reporter expression than silencing Mfrn2. This is consistent with the more-significant role of Mfrn1 in mitochondrial iron delivery in erythroid precursors. Silencing Mfrn1 and Mfrn2 in the differentiated MEL cells also led to a significant decrease in the levels of the reporter construct. Western analysis confirmed that the loss of Mfrn2 in undifferentiated cells resulted in the increased expression of the reporter construct, and the loss of both Mfrn1 and Mfrn2 resulted in the decreased expression of the reporter construct (Fig. 6B). Western analysis of differentiated MEL cells silenced for Mfrn1 or Mfrn2 also confirmed the flow cytometric analysis. Decreased mitochondrial iron levels result in decreased mitochondrial Fe-S cluster synthesis, which affects the activity of cytosolic Fe-S cluster-containing proteins. These results support the view that Fe-S clusters are synthesized in mitochondria and exported to the cytosol.
FIG. 6.
Reductions in Mfrns affect the expression of a 5′ IRE-GFP reporter construct. (A) MEL cells were differentiated or not as described in the legend to Fig. 4B. On day 2 of differentiation, MEL cells were treated with oligonucleotides specific to Mfrn1 (si-Mfrn1) or Mfrn2 (si-Mfrn2). Forty-eight hours later (day 4 of differentiation), the cells were transfected with a 5′ IRE-GFP construct. The cells were harvested 24 h later, and the GFP fluorescence intensity was determined by flow cytometry. The data are expressed as arbitrary units of fluorescence. Error bars represent the standard deviations of the results from two independent experiments. (B) Cells treated as described for panel A were lysed, and Western blot analysis was performed using anti-GFP and antitubulin antibodies.
Ectopically expressed Mfrns do not accumulate in mitochondria.
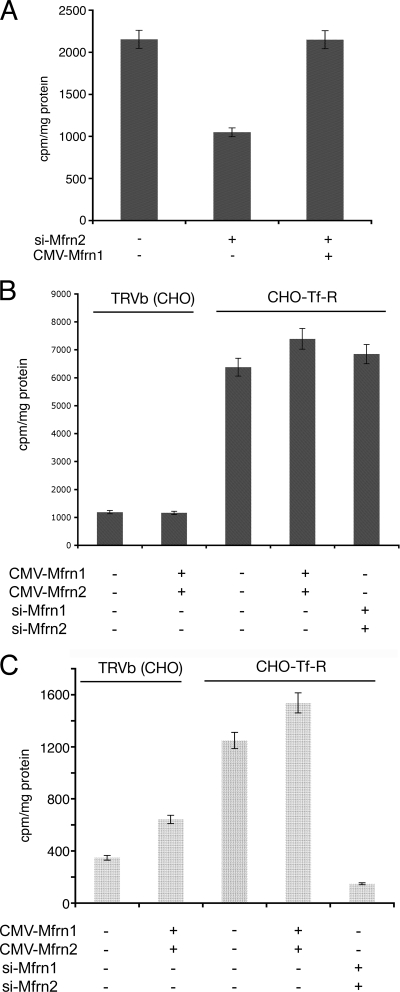
The expression of Mfrn1 or Mfrn2 using a CMV-based plasmid can restore heme synthesis in cells silenced for Mfrn2 or Mfrn1, respectively. The level of heme synthesis, however, was only fractionally (20%) increased over control levels (Fig. 2B). We considered that cellular heme levels might be limited by porphyrin synthesis or by heme export and that the measurement of heme synthesis might underestimate mitochondrial iron delivery. To determine the effect of Mfrn expression on mitochondrial iron levels, we assayed mitochondrial 59Fe accumulation. The incubation of 3T3 fibroblasts with Mfrn2-specific oligonucleotides lowered heme synthesis (Fig. 2B) and lowered mitochondrial 59Fe (Fig. 7A). The overexpression of Mfrn1 in Mfrn2-silenced cells restored the level of mitochondrial 59Fe to that of the control cells, but there was no increase over the control values. To ensure that mitochondrial iron delivery was not limited by cellular iron acquisition, we took advantage of a CHO cell line expressing high levels of transferrin receptors (CHO-Tf-R) (12). CHO-Tf-R cells accumulated four to five times more cellular iron than CHO cells that do not express Tf-R (TRVb) (Fig. 7B). The overexpression of Mfrns did not affect cellular iron acquisition. CHO-Tf-R cells accumulated three times more mitochondrial iron than did TRVb cells (Fig. 7C). The expression of CMV-based Mfrn1 and Mfrn2 led to a 70% increase in mitochondrial iron in Tf-R-negative cells, whereas CMV-expressed Mfrn1 and Mfrn2 led to only a 20% increase in iron accumulation above baseline levels in Tf-R-expressing cells. The treatment of CHO-Tf-R cells with Mfrn1 and Mfrn2 oligonucleotide-specific siRNAs resulted in a large decrease (85%) in mitochondrial iron. The expression of Mfrn1 and Mfrn2 led to the same absolute increase in mitochondrial 59Fe, even though the baseline levels of mitochondrial 59Fe in TRVb and CHO-Tf-R cells were different.
FIG. 7.
The ectopic expression of Mfrns does not increase mitochondrial iron levels. (A) NIH 3T3 fibroblasts were incubated with oligonucleotides specific to Mfrn2 (si-Mfrn2) and simultaneously transfected with pEGFP-Mfrn1. Cells were incubated with Tf(59Fe)2 for 8 h, mitochondria isolated as described in Materials and Methods, and mitochondrial iron (Fe59) measured as cpm/mg protein. (B) CHO cells (TRVb) and CHO cells overexpressing transferrin receptors (CHO-Tf-R) were silenced for Mfrn1 and Mfrn2, transfected with pEGFP-Mfrn2 or Mfrn1, respectively, and treated as described in panel A, and the total cellular iron was measured. (C) Mitochondrial iron was measured from cells treated as described in panel B. Error bars represent the standard deviations of the results from three independent experiments.
The level of Mfrns in mitochondria is regulated posttranslationally.
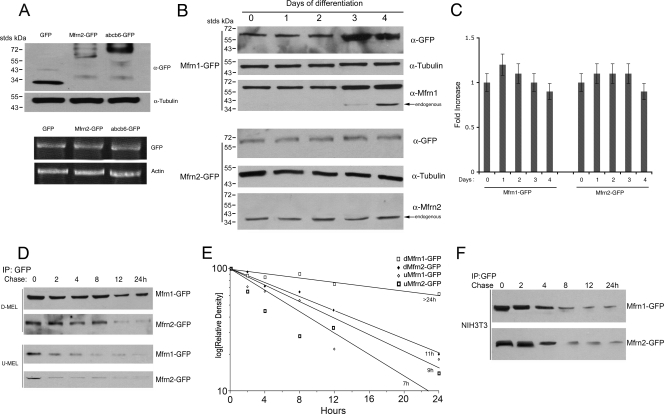
Our results suggest that the ectopic expression of Mfrns does not dramatically increase mitochondrial iron levels. The regulation of mitochondrial iron may occur at the level of transport into the mitochondria or out of the mitochondria or by the regulation of Mfrn levels. Ectopically expressed Mfrn1 and Mfrn2 are localized to the mitochondria (Fig. 1B and data not shown), but it is possible that the levels of the Mfrns are not overexpressed. We examined Mfrn2 levels in 3T3 fibroblasts transfected with pEGFP, pEGFP-Mfrn2, or Abcb6-GFP, all expressed under the same CMV promoter. Western blots showed that Mfrn2-GFP protein was expressed at lower levels than GFP, or the mitochondrial protein Abcb6-GFP (Fig. 8A). Similar results were obtained when Mfrn1 or Mfrn2 were expressed without carboxyl-terminal epitopes (data not shown). The measurement of mRNA levels by quantitative RT-PCR showed similar amounts of mRNA for CMV-expressed GFP, Mfrn2-GFP, or Abcb6-GFP (Fig. 8A). These results suggest that Mfrn2-GFP steady-state mRNA levels are equivalent to other CMV-expressed mRNA, but the accumulation of mitochondrial Mfrn2 is limited.
FIG. 8.
Mfrn1 and Mfrn2 protein levels are differentially regulated. (A) NIH 3T3 fibroblasts were transfected with empty vector (GFP), Mfrn2-GFP, or Abcb6-GFP. The cells were grown for 24 h, and the cell lysates were run on 4 to 20% acrylamide gel and probed using anti-GFP and antitubulin antibody. The cells were lysed, and RT-PCR was performed using primers for GFP and actin. (B) MEL cells were transfected with Mfrn1-GFP or Mfrn2-GFP and differentiated for 4 days. The cell lysates during differentiation were probed using anti-GFP, anti-Mfrn1, anti-Mfrn2, or anti-α-tubulin antibody. (C) MEL cells treated as described for panel B were lysed, and quantitative RT-PCR was performed using GFP and actin primers. The data were normalized to actin and expressed as the increase compared to the level at time zero during MEL cell differentiation. (D) MEL cells were transfected with Mfrn1-GFP or Mfrn2-GFP and differentiated for 4 days. After 4 days of differentiation, the cells were pulse-chased using 35S-labeled methionine. The cells were lysed at different time points and were immunoprecipitated (IP) using GFP antibody. A representative gel is shown in panel D, and the quantification of the bands plotted as the relative density compared to that at time zero for three independent experiments is shown in panel E. The estimated half-lives are included in the figure. (F) NIH 3T3 cells were transfected with Mfrn1-GFP or Mfrn2-GFP, limited for methionine, and pulse-chased using 35S-labeled methionine. The cells were lysed at different time points and were immunoprecipitated using GFP antibody. The samples were applied to SDS-PAGE gels and analyzed by autoradiography. Panel A shows a representative gel from one of two experiments.
Previous studies have shown that there is an increase in Mfrn1 accumulation in developing red blood cells of zebrafish and mice due, in part, to increased transcription. Mutations in zebrafish Mfrn1 lead to a defect in heme formation in developing erythroid cells. This defect can be suppressed by the ectopic expression of Mfrn1 but not Mfrn2 (17). We examined the levels of ectopically expressed Mfrn1-GFP and Mfrn2-GFP in differentiating MEL cells. The levels of endogenous Mfrn1 and Mfrn1-GFP increased during the 5 days of differentiation, whereas the levels of Mfrn2 and Mfrn2-GFP remained constant (Fig. 8B). (Mfrn2-GFP could not be detected with antibodies specific to Mfrn2, whereas Mfrn1-GFP could be detected with Mfrn1-specific antibodies. We hypothesize that the GFP epitope on Mfrn2 obscures the Mfrn2 antibody recognition site.) The levels of accumulated Mfrn1-GFP and Mfrn2-GFP were unchanged in the first 2 days of differentiation. At day three, however, the level of Mfrn1-GFP increased, whereas the level of Mfrn2-GFP did not. The levels of mRNA for both constructs were similar and unchanged during the differentiation period (Fig. 8C). These results show that the accumulation of Mfrn proteins in mitochondria is highly regulated. We measured the half-life of CMV-expressed Mfrns during erythroid differentiation by pulse-chase metabolic labeling. Transfected undifferentiated or differentiated MEL cells were incubated with 35S-methionine for 1 h and then chased in nonradioactive medium. Mfrn1-GFP or Mfrn2-GFP was immunoprecipitated, and the levels of Mfrns were determined by autoradiography. In undifferentiated cells, Mfrn1-GFP and Mfrn2-GFP were degraded with a half-life of approximately 7 and 9 h, respectively (Fig. 8D and E). The half-life of Mfrn2-GFP in differentiated MEL cells was 11 h, while the half-life of Mfrn1-GFP was greater than 24 h. This change in the half-life of Mfrn1 is unique to differentiated MEL cells, as the half-lives of Mfrn1 and Mfrn2 were unchanged in 3T3 cells, a nonerythroid cell line (Fig. 8F). These results indicate that one mechanism that might limit mitochondrial iron transport is the regulated degradation of Mfrns, and changes in that regulation for Mfrn1 would permit an enhanced demand for erythropoiesis.
DISCUSSION
Studies in yeast, zebrafish, and mice have established that the Mrs3/4-Mfrn1/2 family of mitochondrial solute carrier transporters are iron transporters. Zebrafish with a mutation in Mfrn1 have defects in hemoglobinization in developing erythroid cells due to an inability to import iron into mitochondria (17). The ectopic expression of Mfrn2 cannot rescue the mutant phenotype in zebrafish, calling into question the role of Mfrn2. We show here that Mfrn1 and Mfrn2 contribute to mitochondrial iron acquisition in mammalian cells as decreases in Mfrns severely reduce mitochondrial iron-consuming processes, such as heme synthesis or Fe-S cluster synthesis. In yeast, the deletion of both MRS3 and MRS4 only affect mitochondrial iron levels under conditions in which cytosolic iron is limited (5, 10, 13, 23). This result suggests that other (low-affinity) mitochondrial iron transporters may function under conditions of high cytosolic iron. In mammalian cells silenced for both Mfrn1 and Mfrn2, mitochondrial iron transport is reduced by greater than 90%, suggesting that the Mfrns are the major contributors to mitochondrial iron. In nonerythroid cells, either Mfrn1 or Mfrn2 is sufficient to acquire iron for heme synthesis. The posttranslational regulation of Mfrns might also explain why the ectopic expression of Mfrn1 and/or Mfrn2 had little effect on the mitochondrial iron pool size in nonerythroid cells. There are a number of possible modes of regulation of pool size, including the regulation of transport activity or increased mitochondrial iron export.
The ectopic expression of Mfrn2 cannot restore heme synthesis in developing erythroid cells from Mfrn1 knockout mice or in Mfrn1 mutant zebrafish (17). The CMV-based expression of Mfrns does not lead to high levels of mitochondrial protein, even though the same promoter can generate high concentrations of either cytosolic, plasma membrane, or mitochondrial proteins. Vectors with the same promoter lead to increased Mfrn1 but not Mfrn2 levels in developing erythroid cells. The change in the Mfrn1 protein level was ascribed to a change in the stability of the protein, with the half-life increasing from 9 h to greater than 24 h. The reason for the increased stability of Mfrn1 is unknown, but it is likely that Mfrn1 is stabilized by an erythroid-specific molecule.
The level of cytosolic iron in developing erythroid cells is extremely low, even in the face of mitochondrial iron acquisition for heme synthesis (16, 19). It has been suggested that endosomes deliver iron derived from Tf directly to mitochondria and that iron never enters the cytosol (19). Increased cytosolic ferritin can be seen when heme synthesis is inhibited, either by inhibiting porphyrin synthesis pharmacologically using succinyl acetone (16) or, as shown here, by reducing mitochondrial iron transport by silencing Mfrns. Our results indicate that iron transport into Mfrn-silenced cells continues even in the absence of sufficient iron delivery to mitochondria to permit heme synthesis. The high level of Mfrn1 expression in differentiating erythroid cells maintains low cytosolic iron by transporting iron out of the cytosol into the mitochondria and thus prevents ferritin expression. A similar phenomenon is seen in Saccharomyces cerevisiae where the increased expression of the yeast vacuolar iron importer Ccc1 lowers cytosol iron due to increased vacuolar iron delivery (9). Thus, the increased transport of iron into organelles can lower cytosolic iron. The observation that ferritin does accumulate when heme synthesis is inhibited by succinyl acetone (16) suggests that iron transported into mitochondria may leave the mitochondria when it is not used for heme synthesis. This is consistent with the idea that the size of the free mitochondrial iron pool might be capped.
The reduction in both Mfrn1 and Mfrn2 results in an inhibition of ferritin accumulation. The decrease in ferritin synthesis is not the result of a decrease in cellular iron accumulation, as cells continue to take up Tf(Fe)2. Ferritin levels, however, were increased by the expression of ferritin mRNA lacking the 5′ IRE. The silencing of Mfrn1 and Mfrn2 also led to the decreased activity of the cytosolic Fe-S-containing enzyme xanthine oxidase and to the expression of GFP from a 5′ IRE reporter construct. The simplest explanation for the reduced expression of endogenous ferritin and the reduced activity of xanthine oxidase is that there is a decreased synthesis of mitochondrial Fe-S clusters. The lack of Fe-S clusters maintains IRP1 in the RNA binding form even in the presence of cytosolic iron. Similar results were observed in zebrafish with a mutation in mitochondrial Grx5 (22), an enzyme required for mitochondrial Fe-S synthesis, or in the livers from mice with a targeted deletion in Abcb7, the exporter for mitochondrial Fe-S clusters (14). Both studies indicate that IRP1 obtains its Fe-S clusters from mitochondria. A caveat to such studies is that deletions of yeast Grx5 (3) or Atm1 (7), or mutations in mammalian Abcb7, which results in ataxia with sideroblastic anemia (2, 20), lead to mitochondrial iron accumulation. It is possible that mitochondrial Fe-S clusters are made in the cytosol but that mutations or deletions in mitochondrial Fe-S cluster enzymes lead to cytosolic iron deprivation due to the mitochondrial iron need overriding the cytosolic iron need. Our data exclude that possibility, as Mfrn-silenced mitochondria show reduced iron levels and consequently reduced Fe-S cluster synthesis. These results support the view that mitochondria are the site of cellular de novo Fe-S cluster synthesis.
Acknowledgments
We declare no conflict of interest.
We express our appreciation to Ivana De Domenico for helping with the ferritin analyses. The MEL DS19 cells were kindly provided by Arthur Skoultchi and Mitchell Weiss. We acknowledge James P. Kushner for his critical reading of the manuscript.
This work was supported by the March of Dimes Foundation (BHP) and NIH grants DK052380 to J.K. and HL032262 and DK070838 to B.H.P. K.B.Z. was supported by NIH hematology training grant T32DK00715.
Footnotes
Published ahead of print on 15 December 2008.
REFERENCES
- 1.Ajioka, R. S., J. D. Phillips, and J. P. Kushner. 2006. Biosynthesis of heme in mammals. Biochim. Biophys. Acta 1763723-736. [DOI] [PubMed] [Google Scholar]
- 2.Allikmets, R., W. H. Raskind, A. Hutchinson, N. D. Schueck, M. Dean, and D. M. Koeller. 1999. Mutation of a putative mitochondrial iron transporter gene (ABC7) in X-linked sideroblastic anemia and ataxia (XLSA/A). Hum. Mol. Genet. 8743-749. [DOI] [PubMed] [Google Scholar]
- 3.Belli, G., M. M. Molina, J. Garcia-Martinez, J. E. Perez-Ortin, and E. Herrero. 2004. Saccharomyces cerevisiae glutaredoxin 5-deficient cells subjected to continuous oxidizing conditions are affected in the expression of specific sets of genes. J. Biol. Chem. 27912386-12395. [DOI] [PubMed] [Google Scholar]
- 4.De Domenico, I., D. M. Ward, E. Nemeth, M. B. Vaughn, G. Musci, T. Ganz, and J. Kaplan. 2005. The molecular basis of ferroportin-linked hemochromatosis. Proc. Natl. Acad. Sci. USA 1028955-8960. [DOI] [PMC free article] [PubMed] [Google Scholar]
- 5.Foury, F., and T. Roganti. 2002. Deletion of the mitochondrial carrier genes MRS3 and MRS4 suppresses mitochondrial iron accumulation in a yeast frataxin-deficient strain. J. Biol. Chem. 27724475-24483. [DOI] [PubMed] [Google Scholar]
- 6.Harrison, P. R. 1976. Analysis of erythropoiesis at the molecular level. Nature 262353-356. [DOI] [PubMed] [Google Scholar]
- 7.Kispal, G., P. Csere, B. Guiard, and R. Lill. 1997. The ABC transporter Atm1p is required for mitochondrial iron homeostasis. FEBS Lett. 418346-350. [DOI] [PubMed] [Google Scholar]
- 8.Li, J. Y., G. Ram, K. Gast, X. Chen, K. Barasch, K. Mori, K. Schmidt-Ott, J. Wang, H. C. Kuo, C. Savage-Dunn, M. D. Garrick, and J. Barasch. 2004. Detection of intracellular iron by its regulatory effect. Am. J. Physiol. Cell Physiol. 287C1547-C1559. [DOI] [PubMed] [Google Scholar]
- 9.Li, L., O. S. Chen, D. McVey Ward, and J. Kaplan. 2001. CCC1 is a transporter that mediates vacuolar iron storage in yeast. J. Biol. Chem. 27629515-29519. [DOI] [PubMed] [Google Scholar]
- 10.Li, L., and J. Kaplan. 2004. A mitochondrial-vacuolar signaling pathway in yeast that affects iron and copper metabolism. J. Biol. Chem. 27933653-33661. [DOI] [PubMed] [Google Scholar]
- 11.Lill, R., and U. Muhlenhoff. 2008. Maturation of iron-sulfur proteins in eukaryotes: mechanisms, connected processes, and diseases. Annu. Rev. Biochem. 77669-700. [DOI] [PubMed] [Google Scholar]
- 12.Luttropp, C. A., J. A. Jackson, B. J. Jones, M. H. Sohn, R. E. Lynch, and K. A. Morton. 1998. Uptake of gallium-67 in transfected cells and tumors absent or enriched in the transferrin receptor. J. Nucl. Med. 391405-1411. [PubMed] [Google Scholar]
- 13.Muhlenhoff, U., J. A. Stadler, N. Richhardt, A. Seubert, T. Eickhorst, R. J. Schweyen, R. Lill, and G. Wiesenberger. 2003. A specific role of the yeast mitochondrial carriers MRS3/4p in mitochondrial iron acquisition under iron-limiting conditions. J. Biol. Chem. 27840612-40620. [DOI] [PubMed] [Google Scholar]
- 14.Pondarre, C., B. B. Antiochos, D. R. Campagna, S. L. Clarke, E. L. Greer, K. M. Deck, A. McDonald, A. P. Han, A. Medlock, J. L. Kutok, S. A. Anderson, R. S. Eisenstein, and M. D. Fleming. 2006. The mitochondrial ATP-binding cassette transporter Abcb7 is essential in mice and participates in cytosolic iron-sulfur cluster biogenesis. Hum. Mol. Genet. 15953-964. [DOI] [PubMed] [Google Scholar]
- 15.Rouault, T. A. 2006. The role of iron regulatory proteins in mammalian iron homeostasis and disease. Nat. Chem. Biol. 2406-414. [DOI] [PubMed] [Google Scholar]
- 16.Schranzhofer, M., M. Schifrer, J. A. Cabrera, S. Kopp, P. Chiba, H. Beug, and E. W. Mullner. 2006. Remodeling the regulation of iron metabolism during erythroid differentiation to ensure efficient heme biosynthesis. Blood 1074159-4167. [DOI] [PubMed] [Google Scholar]
- 17.Shaw, G. C., J. J. Cope, L. Li, K. Corson, C. Hersey, G. E. Ackermann, B. Gwynn, A. J. Lambert, R. A. Wingert, D. Traver, N. S. Trede, B. A. Barut, Y. Zhou, E. Minet, A. Donovan, A. Brownlie, R. Balzan, M. J. Weiss, L. L. Peters, J. Kaplan, L. I. Zon, and B. H. Paw. 2006. Mitoferrin is essential for erythroid iron assimilation. Nature 44096-100. [DOI] [PubMed] [Google Scholar]
- 18.Shaw, J. D., H. Hama, F. Sohrabi, D. B. DeWald, and B. Wendland. 2003. PtdIns(3,5)P2 is required for delivery of endocytic cargo into the multivesicular body. Traffic 4479-490. [DOI] [PubMed] [Google Scholar]
- 19.Sheftel, A. D., A. S. Zhang, C. Brown, O. S. Shirihai, and P. Ponka. 2007. Direct interorganellar transfer of iron from endosome to mitochondrion. Blood 110125-132. [DOI] [PubMed] [Google Scholar]
- 20.Shimada, Y., S. Okuno, A. Kawai, H. Shinomiya, A. Saito, M. Suzuki, Y. Omori, N. Nishino, N. Kanemoto, T. Fujiwara, M. Horie, and E. Takahashi. 1998. Cloning and chromosomal mapping of a novel ABC transporter gene (hABC7), a candidate for X-linked sideroblastic anemia with spinocerebellar ataxia. J. Hum. Genet. 43115-122. [DOI] [PubMed] [Google Scholar]
- 21.Sturrock, A., J. Alexander, J. Lamb, C. M. Craven, and J. Kaplan. 1990. Characterization of a transferrin-independent uptake system for iron in HeLa cells. J. Biol. Chem. 2653139-3145. [PubMed] [Google Scholar]
- 22.Wingert, R. A., J. L. Galloway, B. Barut, H. Foott, P. Fraenkel, J. L. Axe, G. J. Weber, K. Dooley, A. J. Davidson, B. Schmid, B. H. Paw, G. C. Shaw, P. Kingsley, J. Palis, H. Schubert, O. Chen, J. Kaplan, and L. I. Zon. 2005. Deficiency of glutaredoxin 5 reveals Fe-S clusters are required for vertebrate haem synthesis. Nature 4361035-1039. [DOI] [PubMed] [Google Scholar]
- 23.Zhang, Y., E. R. Lyver, S. A. Knight, D. Pain, E. Lesuisse, and A. Dancis. 2006. Mrs3p, Mrs4p, and frataxin provide iron for Fe-S cluster synthesis in mitochondria. J. Biol. Chem. 28122493-22502. [DOI] [PubMed] [Google Scholar]


