Abstract
SIRT1 is a prominent member of a family of NAD+-dependent enzymes and affects a variety of cellular functions ranging from gene silencing, regulation of the cell cycle and apoptosis, to energy homeostasis. In mature adipocytes, SIRT1 triggers lipolysis and loss of fat content. However, the potential effects of SIRT1 on insulin signaling pathways are poorly understood. To assess this, we used RNA interference to knock down SIRT1 in 3T3-L1 adipocytes. SIRT1 depletion inhibited insulin-stimulated glucose uptake and GLUT4 translocation. This was accompanied by increased phosphorylation of JNK and serine phosphorylation of insulin receptor substrate 1 (IRS-1), along with inhibition of insulin signaling steps, such as tyrosine phosphorylation of IRS-1, and phosphorylation of Akt and ERK. In contrast, treatment of cells with specific small molecule SIRT1 activators led to an increase in glucose uptake and insulin signaling as well as a decrease in serine phosphorylation of IRS-1. Moreover, gene expression profiles showed that SIRT1 expression was inversely related to inflammatory gene expression. Finally, we show that treatment of 3T3-L1 adipocytes with a SIRT1 activator attenuated tumor necrosis factor alpha-induced insulin resistance. Taken together, these data indicate that SIRT1 is a positive regulator of insulin signaling at least partially through the anti-inflammatory actions in 3T3-L1 adipocytes.
Sirtuins, or silent information regulator 2 (Sir2)-related enzymes, were originally defined as a family of NAD+-dependent enzymes that deacetylate lysine residues on various proteins. Certain sirtuins also have ADP-ribosyltransferase activity. The mammalian sirtuins, SIRT1-7, are implicated in a variety of cellular functions, ranging from gene silencing, control of the cell cycle and apoptosis, to energy homeostasis (11). SIRT1 is the closest homolog to Sir2 and the best understood in terms of cellular activity and function. Among the nonhistone cellular substrates of SIRT1 are the tumor suppressor p53 (16, 27), the transcription factor nuclear factor κB (NF-κB) (33), peroxisome proliferator-activated receptor γ (PPARγ) coactivator 1α (PGC1-α) (21), liver X receptor (15), and the forkhead box O family of transcription factors (32). These genes can be involved in transcriptional control of inflammatory responses, metabolic pathways, cell proliferation, and cell survival.
SIRT1 is widely expressed in mammalian tissues and is upregulated by calorie restriction or fasting in the brain, fat, kidney, muscle and liver (6). The broad distribution of SIRT1 in different tissues suggests that its effects on glucose homeostasis are likely to be mediated by tissue-specific factors. In liver, SIRT1 interacts with and deacetylates PGC1-α, leading to increased gluconeogenic gene expression, at least in vitro (21). More recently, in muscle, it has been shown that SIRT1 deacetylation of PGC-1α may be required for activation of mitochondrial fatty acid oxidation (10), which has implications for nutrient adaptation and metabolic diseases. In adipose tissue, SIRT1 represses adipocyte differentiation and genes controlled by the adipogenic regulator PPARγ (20). Overexpression of SIRT1 in 3T3-L1 preadipocytes attenuates adipogenesis, while siRNA-mediated silencing of SIRT1 enhances it. In mature 3T3-L1 adipocytes SIRT1 overexpression triggers lipolysis and loss of fat content. Except for these functions, SIRT1 could have effects on the metabolic syndrome, atherosclerosis, and obesity-related disorders such as type 2 diabetes. For example, treatment of obese insulin-resistant Zucker rats with a SIRT1 activator improves systemic insulin sensitivity without affecting adiposity (19). However, the effect of SIRT1 on insulin signaling has not been elucidated.
Several recent studies have implicated SIRT1 in the regulation of inflammatory responses. SIRT1 can deacetylate the tumor suppressor p53, inhibiting its transcriptional activity, resulting in reduced apoptosis in response to various stress stimuli (16, 27). SIRT1 can also inhibit NF-κB, leading to enhanced cell death in response to the inflammatory cytokine tumor necrosis factor alpha (TNF-α) (33). Since increasing evidence indicates that chronic, low-grade inflammation can cause insulin resistance (23), we considered whether SIRT1 could play a role in protection against proinflammatory responses in adipose tissue.
In the present study, we show that knockdown of SIRT1 in 3T3-L1 adipocytes leads to enhanced proinflammatory gene expression and increased phosphorylation of JNK, as well as serine phosphorylation of insulin receptor substrate 1 (IRS-1), with subsequent inhibition of insulin signaling events, such as tyrosine phosphorylation of IRS-1, phosphorylation of Akt, ERK, and glucose transport. In contrast, treatment with a SIRT1 activator inhibited 3T3-L1 adipocyte inflammatory pathways and improved insulin signaling. Taken together, these studies indicate that SIRT1 can function as an anti-inflammatory molecule with beneficial effects on insulin action and sensitivity.
MATERIALS AND METHODS
Materials.
The hemagglutinin (HA) (in the first exofacial loop)-GLUT4-e green fluorescent protein (GFP) (at the carboxyl terminus) constructs was a generous gift from T. E. McGraw (Weill Cornell Medical College, New York, NY). Adenovirus (Ad) with SIRT1 constructs was kindly gifted by Pere Puigserver (Harvard Medical School, Boston, MA). Anti-insulin receptor antibody, anti-Akt1/2 antibody, anti-NF-κB antibody (for chromatin immunoprecipitation [ChIP]), anti-SIRT1 antibody, anti-iNOS antibody, anti-TRAF2 antibody, horseradish peroxidase-linked anti-goat antibody, and small interfering RNA (siRNA) against NF-κB were from Santa Cruz Biotechnology, Inc. (Santa Cruz, CA). Anti-phospho-IRS-1 (Ser307) antibody, anti-IRS1 antibody, and anti-PTP1B antibody were from Upstate Biotechnology, Inc. (Lake Placid, NY). Anti-phospho-insulin receptor (Tyr1146) antibody, anti-phospho-Akt (Ser 473) antibody, anti-phospho-ERK (Thr202/Tyr204) antibody, anti-ERK antibody, anti-NF-κB antibody, anti-phospho-JNK (Thr183/Tyr185) antibody, and anti-JNK antibody were from Cell Signaling (Beverly, MA). Horseradish peroxidase-linked anti-rabbit and anti-mouse antibodies, sheep immunoglobulin G, rhodamine-conjugated anti-rabbit antibody, and Cy3-conjugated secondary antibody were obtained from Jackson Immunoresearch Laboratories, Inc. (West Grove, PA). Anti-phosphotyrosine antibody was from Transduction Laboratory (Lexington, KY). Anti-HA-11 antibody was from Covance (Princeton, NJ). Anti-acetyl-NF-κB (Lysine 310) antibody was from Abcam (Cambridge, MA). Recombinant mouse TNF-α was from R&D systems (Minneapolis, MN). Dulbecco modified Eagle medium and fetal calf serum were obtained from Life Technologies, Inc. (Grand Island, NY). 2-[3H]deoxyglucose or l-[3H]glucose were from ICN (Costa Mesa, CA). All other reagents and chemicals were purchased from Sigma Chemical Co. (St. Louis, MO).
Cell treatment and transient transfection.
3T3-L1 cells were cultured and differentiated as described previously (35). For preparation of whole-cell lysates for immunoblotting experiments, 3T3-L1 adipocytes were stimulated with or without 0.5 or 17 nM insulin at 37°C for various periods as indicated in the figures. Differentiated 3T3-L1 adipocytes were transiently transfected by electroporation, as previously described (34). For Ad infection, 3T3-L1 adipocytes were transduced at a multiplicity of infection (PFU/cell) as indicated in the figures for 16 h with the recombinant Ad encoding GFP or the wild-type (WT) SIRT1 as described previously (21, 34).
Western blotting.
Western blotting experiments were performed as described previously (34). Cells were lysed in a cold solubilizing buffer containing 40 mM Tris, 1 mM EGTA, 100 mM NaCl, 1 mM MgCl2, 1% Nonidet P-40, 10% glycerol, 1 mM Na3VO4, 1 mM phenymethylsulfonyl fluoride, and 20 mM NaF (pH 7.5). The soluble fractions were boiled with Laemmli sample buffer containing 100 mM dithiothreitol and analyzed by sodium dodecyl sulfate-polyacrylamide gel electrophoresis (SDS-PAGE) and immunoblotting with the indicated antibodies.
On phosphorylation and total protein blots, the phosphorylation blotted membrane was stripped in Restore Western blot stripping buffer (Pierce, Rockford, IL) and reprobed with an anti-target protein antibody. If the stripped and reblotted gels did not work adequately, due to different nonspecific bands or uneven protein blots (mirror image due to insufficient strip), then the same samples were loaded at the same amount of protein per lane on separate gels, and one gel was blotted for the phospho-protein and the other for total protein. This latter approach was used in the Western blots of Akt, ERK, and JNK.
Isolation of adipose tissues from mice.
Mice were on the C57BL/6 background. We fed male mice (aged 5 to 6 months) on a high-fat diet (HFD), containing 40% fat by weight (Harlan Teklad Custom Diets), for 16 weeks. The epididymal fat was collected from mice as described previously (14), and Western blotting was performed with the indicated antibodies. For SRT1720 treatment, 16-week-old male mice were placed on a 60% HFD or a 60% HFD that was supplemented with SRT1720 (HFD+SRT1720, 100 mg/kg; Dyets, Inc.). We have previously demonstrated that this dose of SRT1720 improves insulin sensitivity in obese mice and rats (19). After 7 weeks, the mice were anesthetized in the fed state, and the epididymal fat pad was excised, rinsed in saline, and frozen in liquid nitrogen. The body weight at the end of the study was not different between the two groups (43.5 ± 3.2 versus 40.6 ± 2.4 g, HFD versus HFD+SRT1720, P > 0.05). Mouse procedures conformed to Guide for Care and Use of Laboratory Animals of the U.S. National Institutes of Health and were approved by the Animal Subjects Committee of the University of California, San Diego.
SVF isolation.
Epididymal fat pads were excised from mice fed normal chow (NC) or HFD, weighed, rinsed three times in phosphate-buffered saline, and then minced. Tissue suspensions were centrifuged at 500 × g for 5 min, and then treated with collagenase (1 mg/ml) for 30 min at 37°C with shaking. The cell suspensions were filtered through a 100-μm-pore-size filter and centrifuged at 500 × g for 5 min. Stromal vascular fraction (SVF) pellets were then analyzed for RNA.
RNA interference.
The duplexes of siRNA, targeting SIRT1 mRNA (target sequences: 469, 5′-TTAGTGAGGAGTCCATCGG-3′; 1167, 5′-AAATGTCTCCACGAACAGC-3′) and a negative control (scrambled sequence) were purchased from Dharmacon Research, Inc. (Lafayette, CO). The target sequences against SIRT1 were chosen by an online search program (Thermo Scientific), and the absence of homology to any other gene was confirmed by a BLAST search (National Center for Biotechnology Information, National Institutes of Health). On day 7 postdifferentiation, 3T3-L1 adipocytes were electroporated with a siRNA by using the GenePulser XCell (Bio-Rad). Electroporated cells were incubated for 48 h at 37°C prior to assays.
RNA isolation and reverse transcription-PCR (RT-PCR).
Total RNA was isolated and purified from treated cells using TRIzol according to the manufacturer's instructions (Invitrogen, Carlsbad, CA). First-strand cDNA synthesis and quantitative real-time PCR was performed as previous described (12). The ArrayPlate assay was performed by High Throughput Genomics, Inc. (Tucson, AZ) (17). We performed separate control experiments to ensure that the efficiencies of target and reference amplification were equal. The specificity of the PCR amplification was verified by melting-curve analysis of the final products using Opticon 3 software (Bio-Rad). The oligonucleotide primers or target sequence used are available upon request.
2-Deoxyglucose (2-DOG) uptake.
The procedure for evaluating glucose transport was performed as previously described (35). Glucose uptake was determined after the addition of 5 μl of substrate. 2-[3H]deoxyglucose or l-[3H]glucose (0.1 μCi; final concentration, 0.01 mM) was added to provide a concentration at which cell membrane transport is rate limiting.
Membrane targeting kinetics of HA-GLUT4-eGFP.
An assay of the membrane targeting kinetics of HA-GLUT4-eGFP was performed as previously described (34). In transfected cells, the intensities of the GFP (reflecting the total cellular HA-GLUT4-GFP level) and Cy3 (reflecting the cell surface HA-GLUT4-GFP) signals were quantified, and background GFP and Cy3 fluorescent emissions were subtracted. The Cy3 fluorescence intensity for each HA-GLUT4-GFP-expressing cell was divided by the GFP fluorescence intensity to determine the fraction of tagged GLUT4 transporter at the membrane (arbitrary units). Fluorescence quantification was previously described (34).
NF-κB acetylation assays.
3T3-L1 adipocytes from different experiment conditions were stimulated with 10 ng of TNF-α/ml for 24 h. Cells were lysed in a cold solubilizing buffer described in Western blotting section with 5 mM nicotinamide. The soluble fractions were boiled with Laemmli sample buffer and analyzed by SDS-PAGE and immunoblotting with anti-acetyl-NF-κB antibody or anti-NF-κB antibody.
ChIP assay.
The ChIP assay was performed by using a ChIP assay kit form Upstate Biotechnology, Inc., with some modifications. Briefly, ∼106 differentiated 3T3-L1 adipocytes, electroporated with control or SIRT1 siRNA, were cross-linked for 10 min by adding formaldehyde directly to the tissue culture medium to a final concentration of 1%. Cross-linked cells were scraped, pelleted by centrifugation, and resuspended in SDS lysis buffer. After centrifugation of sonicated chromatin solution, the supernatant was divided into aliquots for 10-fold dilution in ChIP dilution buffer and precleared with protein A-agarose containing salmon sperm DNA for 30 min. Anti-NF-κB antibody was added, followed by incubation for 18 h at 4°C, followed in turn by incubation with protein A-agarose for 1 h. The precipitates were washed, and chromatin complexes were eluted. After reversal of the cross-linking, the DNA was purified by using a QIAquick PCR purification kit from Qiagen (Germantown, MD), and input control or ChIP samples were used as a template for PCR using the primer sets for regions containing NF-κB binding sites. The oligonucleotide primers used are available upon request.
Preparation of SRT1720 and SRT2530.
The compounds SRT1720 (19) and SRT2530 were synthesized at Sirtris, a GSK company.
SIRT1 protein expression, purification, and mass spectrometry assay.
Human SIRT1 was expressed from the pSIRT1FL vector which places expression under the control of the T7 promoter. The protein was expressed in Escherichia coli BL21Start (DE3) (Invitrogen) as an N-terminal fusion to a His6 affinity tag. The expressed protein was purified by Ni2+-chelate chromatography, followed by size exclusion chromatography and ion exchange. The resulting protein was typically >95%, pure as assessed by SDS-PAGE analysis in 25 mM Tris-HCl (pH 8.0) and 2 mM TCEP [tris(2-carboxyethyl) phosphine]. The mass spectrometry assay was performed as previously described (19), using a peptide [Ac-Glu-Glu-Lys(biotin)-Gly-Gln-Ser-Thr-Ser-Ser-His-Lys(Ac)-Nle-Ser-Thr-Glu-Gly-Lys(MR121 or TAMRA)-Glu-Glu-NH2] derived from the sequence of p53. The mass spectrometry assay was conducted using the following: 0.5 μM peptide substrate, 120 μM βNAD+, 10 nM SIRT1, and reaction buffer (50 mM Tris-acetate [pH 8], 137 mM NaCl2,7 mM KCl, 1 mM MgCl2, 5 mM dithiothreitol, 0.05% bovine serum albumin). Reactions were incubated for 25 min at 25°C. Test compounds were added to the reaction or the vehicle control, dimethyl sulfoxide (DMSO). After the incubation with SIRT1, 10% formic acid with 50 mM nicotinamide was added to stop the reaction. The mass spectrometry analysis was performed by BioTrove, Inc. (Woburn, MA). Determination of the mass of the substrate peptide allows for precise determination of the degree of acetylation (i.e., substrate) compared to deacetylated peptide (product).
Statistics.
The values are expressed as mean ± the standard error (SE). Scheffe's multiple comparison test was used to determine the significance of any differences among more than three groups. A P value of <0.05 was considered significant.
RESULTS
SIRT1 is downregulated by HFD in adipose tissue.
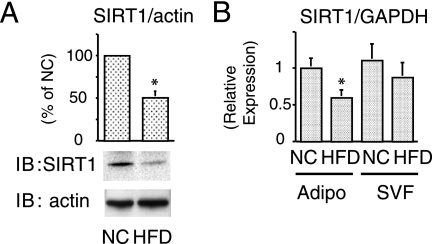
SIRT1 is upregulated by caloric restriction and likely to be a nutrient sensor. Accordingly, we measured in vivo SIRT1 protein expression in adipose tissue from 16-week HFD-fed mice compared to NC-fed mice. HFD mice are obese and insulin resistant (18, 25), and Fig. 1A shows a dramatic reduction of adipose tissue SIRT1 protein content. We also performed quantitative PCR to measure SIRT1 mRNA expression in the adipocyte and SVF of adipose tissue. Consistent with the protein content, SIRT1 mRNA was decreased in the adipocyte fraction, with a smaller decrease in the SVF component from HFD mice (Fig. 1B).
FIG. 1.
SIRT1 is downregulated by HFD in adipose tissue. (A and B) Reduced expression of SIRT1 in mice on HFD. The epididymal fat (Adipo) or SVF collected from NC- or HFD-fed mice, and then immunoblotting (IB) (A) or quantitative real-time-PCR (B) was performed as described in Materials and Methods. (A) The graph shows the means ± the standard error(s) of the mean (SEM) from three independent experiments, and the values are expressed as percentage of control in SIRT1 expression compared to those observed in adipose tissue form NC-fed mice. (B) After the mRNA expression differences were normalized to a standard housekeeping gene (GAPDH) mRNA level; data are presented as the relative expression. *, P < 0.05 (NC versus HFD).
Knockdown of SIRT1 by RNAi inhibits insulin-stimulated glucose transport in 3T3-L1 adipocytes.
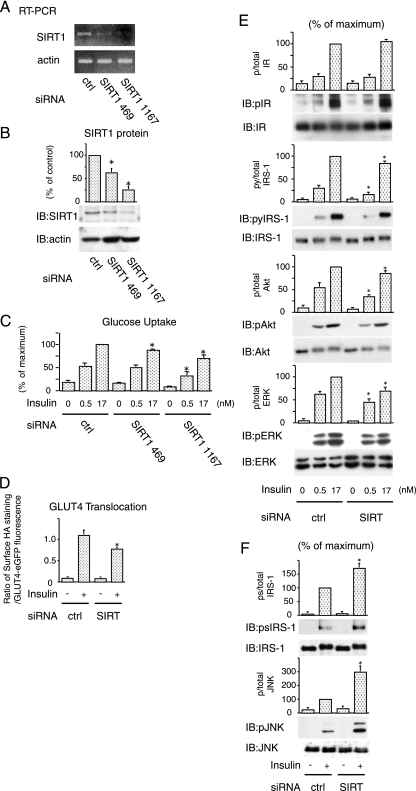
The findings presented in Fig. 1 raises the question as to the potential role of SIRT1 in insulin action. To assess this, we utilized siRNA against SIRT1 in 3T3-L1 adipocytes. Two siRNAs against SIRT1 sequences were tested, and Fig. 2A and B show the results. At 48 h after electroporation of siRNAs, we observed a marked decrease in SIRT1 mRNA in cells electroporated with siSIRT1 (469 and 1167) compared to cells treated with a scrambled siRNA (lane ctrl) (Fig. 2A). We also assessed protein expression and, similar to the mRNA results, electroporation of siSIRT1 led to a comparable decrease in SIRT1 protein (Fig. 2B), with siSIRT (SIRT1 1167) being most effective. In contrast, the expression levels of actin were unaffected (Fig. 2A and B).
FIG. 2.
Knockdown of SIRT1 by RNAi inhibits insulin action in 3T3-L1 adipocytes. (A and B) SiRNA against SIRT1 decreased in expression of SIRT1. The 3T3-L1 adipocytes were electroporated with control (ctrl) or indicated SIRT1 siRNA. (A) At 48 h after electroporation, RT-PCR was performed, and the levels of endogenous SIRT1 or β-actin were determined by RT-PCR. (B) The cells were lysed, and immunoblotting (IB) was performed with indicated antibody. The graph shows the means ± the SEM from four independent experiments, and the values are expressed as the percentage of control in SIRT1 expression compared to those observed in control (ctrl) siRNA electroporated cells. (C) Knockdown of SIRT1 reduced insulin-stimulated glucose uptake. Electroporated cells were stimulated with 0.5 or 17 nM insulin for 25 min, and then 2-DOG uptake was measured. The graph shows the means ± the SEM from six independent experiments, and the values are expressed as the percentage of maximal in glucose uptake compared to those observed in insulin-stimulated control (ctrl) cells. (D) Knockdown of SIRT1 reduced insulin-stimulated GLUT4 translocation. 3T3-L1 adipocytes were electroporated with a dually tagged HA-GLUT4-eGFP construct with control or SIRT1 (SIRT) siRNA. GLUT4 translocation kinetics were assayed and analyzed as described in Materials and Methods. The data are the averages ± the SEM from four independent experiments (a total of 98 to 126 cells/point). (E) Knockdown of SIRT1 decreased insulin signaling. Electroporated cells were stimulated with 0.5 or 17 nM insulin for 10 min, and then Western blotting was performed with the indicated antibodies. (F) Knockdown of SIRT1 increased inflammatory pathway. Electroporated cells were stimulated with 17 nM insulin, and then Western blotting was performed with the indicated antibodies. The graph shows the means ± the SEM from four independent experiments, and the values are expressed as the percentage of maximal compared to those observed in insulin-stimulated ctrl siRNA electroporated cells. *, P < 0.05 (control versus SIRT1 siRNA). p, phosphorylation; py, tyrosine phosphorylation; ps, serine phosphorylation.
To test whether SIRT1 affects glucose metabolism, we measured 2-DOG uptake in 3T3-L1 adipocytes with or without SIRT1 depletion. SIRT1 knockdown, led to a 25 to 40% decrease in insulin-stimulated glucose transport compared to control, scrambled siRNA electroporated cells (Fig. 2C). Treatment with siSIRT1 469, which had approximately half the effect to knock down SIRT1 compared to siSIRT1 1167 (Fig. 2A and B), led to a 10 to 15% decrease in insulin-stimulated glucose uptake (Fig. 2C). Thus, the efficiency of SIRT1 knockdown correlated with the inhibition of glucose uptake, suggesting that the effect is coupled to SIRT1 expression level.
We also measured GLUT4 translocation. 3T3-L1 adipocytes were electroporated with siSIRT1, followed by the detection of insulin-stimulated GLUT4 translocation by measuring movement of HA-GLUT4-eGFP to the cell surface, as previously described (34). As seen in Fig. 2D, these results demonstrate inhibition of GLUT4 translocation by siSIRT1.
SIRT1 knockdown leads to increased IRS-1 serine phosphorylation and decreased insulin signaling.
To assess the mechanisms for the decreased insulin-stimulated glucose uptake and GLUT4 translocation, we measured the effect of SIRT1 knockdown on the early steps of insulin signaling. Compared to control 3T3-L1 adipocytes, knockdown of SIRT1 had no effect on tyrosine phosphorylation of the insulin receptor (Fig. 2E). In contrast, SIRT1 knockdown led to a decrease in IRS-1 tyrosine phosphorylation, which was most evident at the submaximal dose of insulin (0.5 nM). Consistent with this, downstream signaling was also impaired in the knockdown cells, as seen by decreased phosphorylation of Akt and ERK (Fig. 2E).
IRS-1 serine (Ser)/threonine phosphorylation has been increasingly recognized as a negative regulator of IRS signaling (38), and Ser307 has been the most intensively studied and is a well-known target of JNK and inhibitor of κB kinase (IKKβ) (1, 8). Since SIRT1 knockdown can activate proinflammatory pathways in macrophages (T. Yoshizaki et al., unpublished data), we hypothesized that SIRT1 knockdown in adipocytes could enhance inflammatory pathway activity, leading to increased Ser phosphorylation of IRS-1. Consistent with this idea, Fig. 2F shows that SIRT1 knockdown led to an increase in JNK phosphorylation, which was accompanied by increased IRS-1 Ser 307 phosphorylation. This suggests that SIRT1 knockdown increases the JNK/IRS1 Ser 307 pathway and decreases tyrosine phosphorylation of IRS-1, which then inhibits downstream insulin signaling to glucose transport.
SIRT1 represses of proinflammatory gene expression.
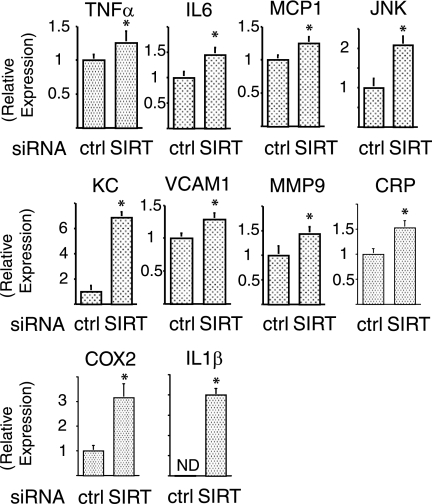
Recent reports suggest a close link between insulin resistance and chronic inflammation (2, 4, 13, 25, 36), and the data in Fig. 2 indicate that SIRT1 may play a role in adipocyte inflammatory responses. To further assess this, we quantified the transcript levels of several inflammatory pathway components. As seen in Fig. 3, SIRT1 knockdown led to a significant increase in mRNA expression for TNF-α (P < 0.05), interleukin-6 (P < 0.05), MCP-1 (P < 0.05), JNK (P < 0.01), KC (P < 0.01), VCAM-I (P < 0.05), MMP9 (P < 0.05), CRP (P < 0.05), COX2 (P < 0.01), and interleukin-1β (P < 0.01), indicating that SIRT1 can broadly suppress inflammatory gene expression.
FIG. 3.
SIRT1 is required for repression of proinflammatory gene expression. Knockdown of SIRT1 increased inflammatory gene expression was examined. At 24 h after electroporation with control (ctrl) or SIRT1 (SIRT) siRNA, cells were stimulated with 10 ng of TNF-α/ml for 24 h. Total RNA was purified, and then quantitative real-time-PCR was performed as described in Materials and Methods. After the mRNA expression differences were normalized to the GAPDH mRNA level, data are presented as the relative expression. Error bars represent the means ± the SEM from four independent experiments. *, P < 0.05 (control versus SIRT1 siRNA). ND, not detected.
SIRT1 deacetylates NF-κB and inhibits NF-κB binding to NF-κB target gene promoters.
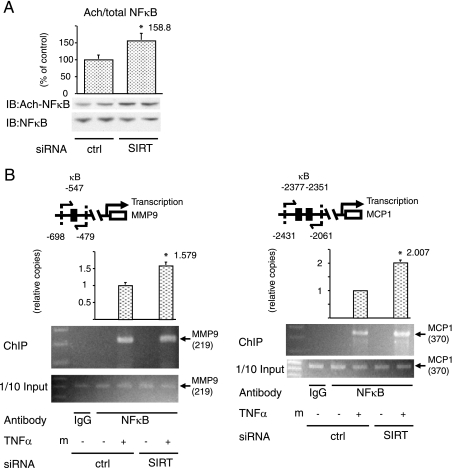
To test the molecular mechanisms of these SIRT1 effects, we assessed the acetylation state of NF-κB, a known SIRT1 target (33). We utilized anti-acetyl-NF-κB antibody, which recognizes NF-κB acetylated at lysine 310. Western blots with this antibody showed that SIRT1 knockdown led to increased NF-κB acetylation (Fig. 4A). To evaluate whether this NF-κB acetylation affected transcriptional responses, ChIP assays were conducted (Fig. 4B). Chromatin extracts from cells electroporated with control or SIRT1 siRNA were immunoprecipitated with NF-κB antibody, and the DNA sequences encompassing the regions containing the NF-κB binding sites in the MMP9 and MCP1 promoters (Fig. 4B) were amplified by real-time quantitative PCR. Treatment of the cells with TNF-α strongly induced the association of NF-κB with the MMP9 and MCP1 promoters (Fig. 4B), and SIRT1 knockdown significantly increased this effect. These data indicate that the increased inflammatory responses in SIRT1 knockdown cells is due, at least in part, to hyperacetylated NF-κB-induced proinflammatory gene expression.
FIG. 4.
SIRT1 deacetylates NF-κB and inhibits NF-κB binding to NF-κB target gene promoters. (A) SIRT1 deacetylated NF-κB. At 24 h after electroporation with control (ctrl) or SIRT1 (SIRT) siRNA, cells were stimulated with 10 ng of TNF-α/ml for 24 h, lysed, and then immunoblotted (IB) with indicated antibodies. The graph shows the means ± the SEM from four independent experiments, and the values are expressed as the percentage of control (cntl) in NF-κB acetylation (Ach-NFκB) compared to those observed in ctrl siRNA electroporated cells. (B) SIRT1 knockdown inhibited NF-κB binding to NF-κB target gene promoters. A schematic diagram of the mouse MMP9 and MCP1 promoter region is presented. The positions of the κB sites are indicated, and pairs of arrows indicate the PCR-amplified regions. At 48 h after electroporation with siRNA, soluble chromatin was prepared from cells treated with (+) or without (−) 10 ng of TNF-α/ml for 24 h, followed by immunoprecipitation with anti-NF-κB antibody (NF-κB) or control immunoglobulin G (IgG). Enrichment of κB-containing DNA sequences in the immunoprecipitated DNA pool, indicating association of NF-κB with the MMP9 or MCP1 promoter within intact chromatin, was visualized by PCR. The lower panels show the PCR-amplified MMP9 or MCP1 promoter bands from input control. The graph shows the means ± the SEM from four independent experiments, and the values are expressed as the percent fold increase in the amount of immunoprecipitated promoter DNA copy numbers relative to their corresponding input controls compared to those observed in control (ctrl) siRNA electroporated cells. *, P < 0.05 (control versus SIRT1 siRNA). m, marker.
NF-κB knockdown improves insulin signaling.
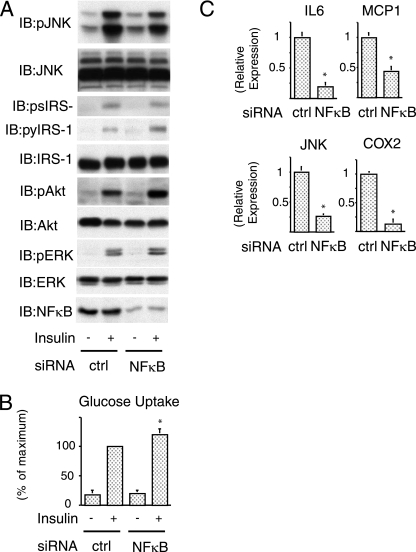
Electroporation of siRNA against NF-κB led to a 80 to 90% decrease in NF-κB protein (Fig. 5A bottom). In contrast to SIRT1 depletion, NF-κB knockdown caused a decrease in JNK phosphorylation, with less IRS-1 serine 307 phosphorylation, accompanied by an increase in IRS-1 tyrosine phosphorylation, Akt and ERK phosphorylation (Fig. 5A), and glucose uptake (Fig. 5B). Concomitantly with this, as seen in Fig. 5C, NF-κB depletion inhibited mRNA expression of several inflammatory genes.
FIG. 5.
NF-κB knockdown improves insulin signaling. (A) Knockdown of NF-κB decreased inflammatory pathway and increased insulin signaling. Cells were electroporated with control (ctrl) or NF-κB (NF-κB) siRNA. At 48 h after electroporation, cells were stimulated with insulin, and then Western blotting was performed with the indicated antibodies. (B) Knockdown of NF-κB increased insulin-stimulated glucose uptake. Electroporated cells were stimulated with insulin, and then 2-DOG uptake was measured. The graph shows the means ± the SEM, and the values are expressed as the percent maximal glucose uptake compared to that observed in insulin-stimulated control (ctrl) cells. (C) Electroporated cells were stimulated with 10 ng of TNF-α/ml for 24 h. Total RNA was purified, and then quantitative real-time-PCR was performed. After the mRNA expression differences were normalized to the GAPDH mRNA level, the data are presented as the relative expression. *, P < 0.05 control versus NF-κB siRNA. IB, immunoblotting; p, phosphorylation; py, tyrosine phosphorylation; ps, serine phosphorylation.
SIRT1 activation is required for anti-inflammatory effects.
We next examined the effect of SIRT1 overexpression in 3T3-L1 adipocytes. The infection of Ad WT SIRT1 increased SIRT1 expression (see Fig. S1A in the supplemental material). However, as seen in Fig. S1B in the supplemental material, overexpression of WT SIRT1 had no effect on insulin-stimulated glucose uptake. Consistent with this, phosphorylation of the insulin receptor, IRS-1, Akt and ERK were equal in both control Ad GFP and Ad WT SIRT1-infected cells (see Fig. S1C in the supplemental material). Furthermore, overexpression of WT SIRT1 did not affect serine phosphorylation of IRS-1, JNK phosphorylation (see Fig. S1D in the supplemental material), or NF-κB acetylation (see Fig. S1E in the supplemental material), suggesting that expression of SIRT1 beyond the normal endogenous level is without effect, unless SIRT1 is activated. This point is clearly demonstrated in Fig. S1F to L in the supplemental material, which shows that treatment of the Ad WT SIRT1-infected cells with a highly potent, selective SIRT1 activator, SRT2530 (see Fig. S1F in the supplemental material) or SRT1720 (19), led to a marked decrease in JNK phosphorylation, with a corresponding decrease in IRS-1 serine 307 phosphorylation (see Fig. S1G and J in the supplemental material), accompanied by an increase in the early steps of insulin signaling (IRS-1 tyrosine phosphorylation, Akt and ERK phosphorylation) (see Fig. S1H and K in the supplemental material) with enhanced glucose transport (see Fig. S1I and L in the supplemental material). These compounds are highly selective for activation of SIRT1, and the glucose-lowering and in vivo insulin-sensitizing effects of SRT1720 have been recently published (19).
Anti-inflammatory effects of SIRT1 activator in adipose tissue from HFD-fed mice.
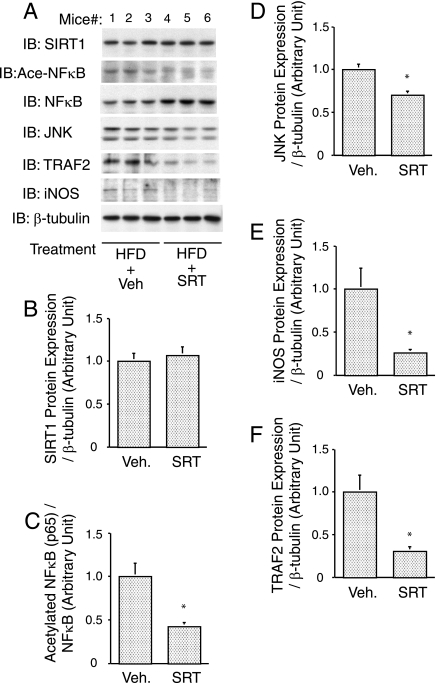
We have assessed SIRT1 protein levels in adipose tissue from mice placed on a HFD with or without SRT1720 treatment (Fig. 6A and B). The ratio of acetylated NF-κB (p65) to total p65 was significantly decreased by SIRT1720 treatment (Fig. 6C, P < 0.001). Furthermore, the protein expression levels of NF-κB target genes, JNK (Fig. 6D, P = 0.004), iNOS (NOS2) (Fig. 6E, P = 0.031), and TNF-α receptor-associated factor 2 (Fig. 6F, P = 0.019) were decreased by SRT1720 treatment. No change in SIRT1 protein expression was observed in adipose tissue after SIRT1 activator treatment. These in vivo findings are consistent with the results in 3T3-L1 adipocytes, showing that SIRT1 activation inhibits proinflammatory gene expression via deacetylation of NF-κB.
FIG. 6.
Anti-inflammatory effects of SIRT1 activator in adipose tissue from HFD-fed mice. SRT1720 inhibited inflammatory responses in adipose tissue. Sixteen-week-old male mice were placed on a 60% HFD or a 60% HFD supplemented with SRT1720 (SRT). (A) After 7 weeks, the epididymal fat pad was excised, and Western blotting was performed with the indicated antibodies. (B, C, D, E, and F) Data are expressed as means ± the SEM. *, P < 0.05 (vehicle versus SRT). IB, immunoblotting; Veh., vehicle.
SIRT1 activator increases insulin action in nontransduced cells.
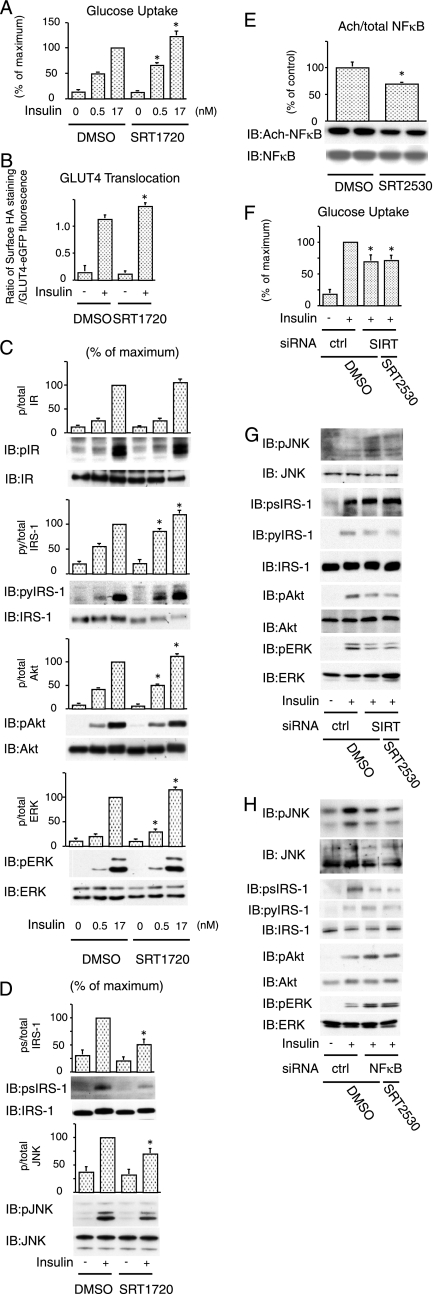
On the basis of the ability of SIRT1 to repress inflammatory components in 3T3-L1 adipocytes, we next sought to determine whether a SIRT1 activator could produce similar effects in nontransfected cells expressing endogenous levels of SIRT1. In these studies, we used the selective SIRT1 activators, SRT2530 and SRT1720 (19). Both compounds clearly increased SIRT1 enzymatic activity for SRT2530: effective concentration required to increase enzyme activity by 50% = 60 nM (see Fig. S1F in the supplemental material) (19). Treatment with these activators significantly increased insulin-stimulated glucose uptake (Fig. 7A and see Fig. S2A in the supplemental material), as well as GLUT4 translocation to the plasma membrane (Fig. 7B and see Fig. S2B in the supplemental material). In addition, pretreatment with the activators led to an increase in insulin-stimulated tyrosine phosphorylation of IRS-1, Akt, and ERK (Fig. 7C and see Fig. S2C in the supplemental material), as well as decreased JNK phosphorylation and serine 307 phosphorylation of IRS-1 (Fig. 7D and see Fig. S2D in the supplemental material). In contrast to SIRT1 knockdown, treatment with these agents significantly decreased TNF-α-stimulated NF-κB acetylation (Fig. 7E). These data further show that SIRT1 activation inhibits inflammatory responses and increases cellular insulin sensitivity. In SIRT1 knockdown cells, pretreatment with SRT2530 had no effect on insulin-stimulated glucose uptake (Fig. 7F) and JNK, IRS1 (tyrosine and serine), Akt, and ERK phosphorylation (Fig. 7G), indicating that the SIRT1 activator modulates insulin actions via effects on SIRT1. Furthermore, in NF-κB knockdown cells, the SIRT1 activator was without effects on insulin signaling (Fig. 7H). This suggests that activation of SIRT1 inhibits inflammatory responses and improves insulin action, at least in part, by inhibition of NF-κB activity.
FIG. 7.
SIRT1 activator increases insulin action in nontransduced cells. (A) Pretreatment of SRT1720 increased insulin-stimulated glucose uptake. Pretreated with control (DMSO) or 1 μM SRT1720 for 1 h, 3T3-L1 adipocytes were stimulated with 0.5 or 17 nM insulin, and then 2-DOG uptake was measured. The graph shows the means ± the SEM, and the values are expressed as the percentage of maximal in glucose uptake compared to those observed in insulin-stimulated DMSO-treated cells. (B) Pretreatment of SRT1720 increased insulin-stimulated GLUT4 translocation. 3T3-L1 adipocytes electroporated with a dually tagged HA-GLUT4-eGFP construct were pretreated with control (DMSO) or 1 μM SRT1720 for 1 h and then stimulated with insulin, and GLUT4 translocation was analyzed as described in Materials and Methods. The data are the averages ± the SEM from four independent experiments (a total of 80 to 100 cells/point). (C and D) Pretreatment of SRT1720 increased insulin signaling. 3T3-L1 adipocytes were pretreated with or without 1 μM SRT1720 for 1 h. The cells were stimulated with insulin, and then Western blotting was performed with the indicated antibodies. The graph shows the means ± SEM, and the values are expressed as the percentage of maximal compared to those observed in insulin-stimulated DMSO treated cells. (E) Pretreatment of SRT2530 deacetylated NF-κB. 3T3-L1 adipocytes were pretreated with or without 0.5 μM SRT2530 for 1 h. The cells were stimulated with 10 ng of TNF-α/ml for 24 h, cells were lysed, and immunoblotting (IB) was performed with the indicated antibody. The graph shows the means ± the SEM, and the values are expressed as the percentage of control in NF-κB acetylation compared to those observed in DMSO treated cells. (F, G, and H) SRT2530 had no effect in SIRT1 and NF-κB knockdown cells. The 3T3-L1 adipocytes were electroporated with control (ctrl), SIRT1 (SIRT), or NF-κB siRNA. At 47 h after electroporation, the cells were pretreated with or without 0.5 μM SRT2530 for 1 h. The cells were stimulated with (+) or without (−) insulin, and then 2-DOG uptake was measured. (F) The graph shows the means ± the SEM, and the values are expressed as the percentage of maximal in glucose uptake compared to those observed in insulin-stimulated DMSO- treated control (ctrl) siRNA electroporated cells. (G and H) Electroporated cells were pretreated with or without 0.5 μM SRT2530 for 1 h. The cells were stimulated with (+) or without (−) insulin, and then Western blotting was performed with the indicated antibodies. *, P < 0.05 (DMSO versus SRT1720 or SRT2530). p, phosphorylation; py, tyrosine phosphorylation; ps, serine phosphorylation.
SIRT1 activation rescues TNF-α-induced insulin resistance.
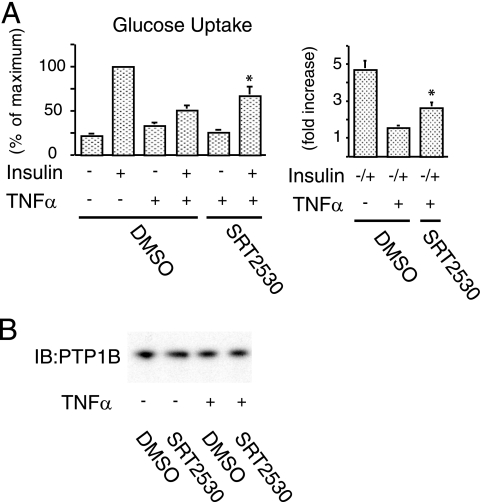
Since TNF-α is a major proinflammatory cytokine that can cause decreased systemic insulin sensitivity, we determined whether TNF-α-induced insulin resistance could be rescued by SIRT1 activation. To accomplish this, we measured the effect of TNF-α on glucose transport in adipocytes that were pretreated with or without SRT2530. Figure 8A shows that exposure to TNF-α for 48 h significantly decreased insulin responsiveness by 29%, whereas pretreatment with the activator partially restored insulin-stimulated glucose uptake by 56% (P < 0.01) in TNF-α-treated cells. Protein tyrosine phosphatase 1B (PTP1B) has been recognized as a negative regulator of insulin sensitivity (7), and recent reports suggest that TNF-α can increase PTP1B expression (37) and that SIRT1 can decrease it (26). To test whether the effects of SRT2530 on TNF-α-induced insulin resistance depend on PTP1B, we measured PTP1B expression. Treatment with TNF-α for 48 h did not affect PTP1B protein content, and there was also no effect of pretreatment of SRT2530 (Fig. 8B).
FIG. 8.
SIRT1 activation rescues TNF-α-induced insulin resistance. (A) SRT2530 rescued TNF-α-induced impaired glucose uptake. Pretreated with control (DMSO) or 0.5 μM SRT2530 for 1 h, 3T3-L1 adipocytes were incubated with (+) or without (−) 10 ng of TNF-α/ml for 48 h and stimulated with (+) or without (−) 17 nM insulin, and then the 2-DOG uptake was measured. The graph shows the means ± the SEM, and the values are expressed as the percentage of maximum control or fold increase over basal (unstimulated) glucose uptake. (B) TNF-α and SRT2530 did not affect PTP1B level. Western blotting was performed with anti-PTP1B antibody. *, P < 0.05 (DMSO versus SRT2530). IB, immunoblotting.
SIRT1 activation has no effect in salicylate-treated adipocytes.
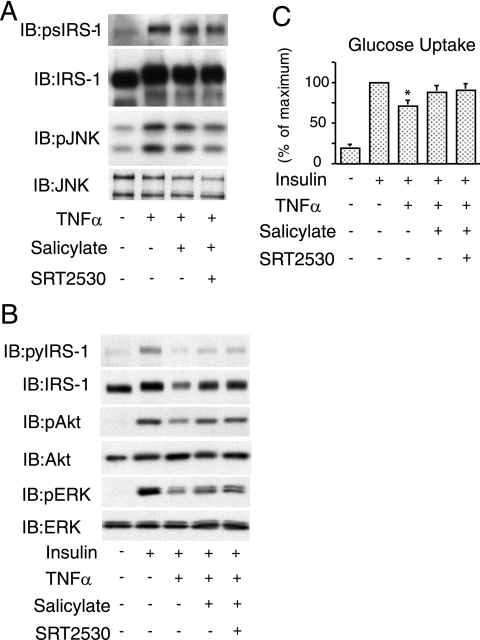
Salicylate is a well-known anti-inflammatory molecule, and it has been shown that pretreatment of 3T3-L1 adipocytes with salicylate prevented TNF-α-induced JNK and IRS-1 (serine) phosphorylation, and restored insulin-stimulated glucose uptake (9). To determine whether salicylate and SIRT1 activation could have additive effects, we cotreated cells with both agents. Consistent with previous reports, pretreatment with salicylate reduced TNF-α-induced IRS-1 Ser 307 phosphorylation, along with decreased JNK phosphorylation (Fig. 9A). Salicylate treatment also improved insulin-stimulated IRS-1 tyrosine phosphorylation, Akt, and ERK phosphorylation, as well as glucose uptake in TNF-α-treated cells. In all of these experiments, SRT2530 had no further effect (Fig. 9).
FIG. 9.
SIRT1 activation has no effect in salicylate treated adipocytes. (A) Pretreated with 5 mM salicylate, 0.5 μM SRT2530, or both for 2 h, 3T3-L1 adipocytes were incubated with (+) or without (−) 10 ng of TNF-α/ml for 5 min, and then Western blotting was performed with the indicated antibodies. (B) Pretreated cells were incubated with (+) or without (−) 10 ng of TNF-α/ml for 4 h to inhibit insulin signaling. After insulin stimulation for 10 min, the cells were lysed, and then Western blotting was performed with the indicated antibodies. (C) Pretreated with 5 mM salicylate, 0.5 μM SRT2530, or both for 2 h, 3T3-L1 adipocytes were incubated with (+) or without (−) 10 ng of TNF-α/ml for 4 h to inhibit insulin signaling. After insulin stimulation for 25 min, the 2-DOG uptake was measured. The graph shows the means ± the SEM, and the values are expressed as the percent maximal glucose uptake compared to that observed in insulin-stimulated control cells. IB, immunoblotting; p, phosphorylation; py, tyrosine phosphorylation; ps, serine phosphorylation.
DISCUSSION
Obesity is a rapidly advancing “epidemic” leading to an explosion of insulin resistance-related health problems associated with increased morbidity and mortality. Caloric restriction improves insulin sensitivity and metabolic dysfunction and is a robust and reproducible way to extend life span in a variety of organisms, including mammals (24). Caloric restriction induces increased expression of the histone deacetylase SIRT1, and SIRT1 is one of the major mediators of caloric restriction-induced longevity (5, 6, 11). This raised the question of whether SIRT1 could also mediate beneficial effects on insulin sensitivity. Indeed, treatment of mice with the SIRT1 activator resveratrol leads to an increase in longevity and also improves glucose tolerance and insulin sensitivity (3). More recently, it has been shown that a specific, small molecule SIRT1 activator (SRT1720) can enhance insulin sensitivity in insulin-resistant mice and rats (19).
Increasing evidence shows that chronic inflammation, particularly in adipose tissue and liver, is an important pathophysiologic cause of decreased systemic insulin sensitivity (23, 29, 30). One of the targets for SIRT1 deacetylation is NF-κB, which is a key component of the intracellular inflammatory response (23, 29, 30). Therefore, we hypothesized that, within adipocytes, SIRT1 exerts anti-inflammatory effects and that these effects could enhance insulin signaling. Consistent with this idea, the present studies use two different approaches to reveal a novel role for SIRT1 in regulating intracellular adipocyte proinflammatory responses and in improving cellular insulin sensitivity. We report that depletion of SIRT1 in 3T3-L1 adipocytes leads to a broad increase in inflammatory responses, resulting in cellular insulin resistance, whereas treatment of cells with SIRT1 activators suppresses inflammatory pathway activation and enhances insulin sensitivity. Furthermore, SIRT1 activator treatment protected 3T3-L1 adipocytes from TNF-α-induced insulin resistance, raising the possibility that SIRT1 activators may eventually prove useful in the treatment insulin resistance.
Although recent studies have shown that in vivo resveratrol treatment of insulin resistant HFD mice can cause systemic insulin sensitivity, the mechanisms are unknown. Furthermore, resveratrol is a relatively nonspecific SIRT1 activator and can interact with other cellular targets. Possibly related to this, resveratrol treated mice showed decreased adiposity and increased thermogenesis, which could be confounding effects influencing insulin sensitivity. Currently, there are no studies that demonstrate direct effects of SIRT1 activation on cellular insulin sensitivity, so whether SIRT1 activators work by direct or indirect means on insulin action are unknown. In this regard, we have found that SIRT1 knockdown in adipocytes led to activation of inflammatory pathway signals, including JNK phosphorylation and increased expression of proinflammatory genes, demonstrating the involvement of SIRT1 as a negative regulator of inflammatory components within adipocytes. This enhanced inflammatory pathway activation was accompanied by increased IRS-1 serine 307 phosphorylation, which led to a decrease in downstream insulin signaling. In addition, we used selective small molecule activators of SIRT1 and found that these compounds inhibited inflammatory pathway activation and improved cellular insulin signaling in 3T3-L1 adipocytes.
The mechanisms of SIRT1 repressive effects on adipocyte inflammatory pathway activation are of interest. In this regard, it has been shown that SIRT1 physically interacts with the RelA/p65 subunit of NF-κB and inhibits transcription by deacetylating RelA/p65 at lysine 310, suggesting that acetylation of lysine 310 might form a platform required for transcriptional activity (31, 33). These data are consistent with our results showing that SIRT1 knockdown in 3T3-L1 adipocytes increased NF-κB-mediated inflammatory gene expression. We also show that SIRT1 depletion increased NF-κB acetylation and enhanced NF-κB binding to target gene promoters and that SIRT1 activation and NF-κB knockdown produce similar cellular phenotypes. These data suggest that the increased inflammatory responses and decreased insulin action induced by SIRT1 depletion are due, at least in part, to proinflammatory gene expression mediated by hyperacetylated NF-κB.
The IKKβ/NF-κΒ and JNK/AP2 proinflammatory pathways are broadly expressed across many different cell types and can be activated by a variety of inflammatory stimuli. Many of these stimuli, such as TNF-α, free fatty acids, and lipopolysaccharide, can cause insulin resistance, and therefore it seems reasonable to propose that the activation of intracellular inflammatory pathways that results from SIRT1 depletion is a cause of decreased insulin sensitivity in SIRT1 knockdown cells. Similarly, the anti-inflammatory effect of the SIRT1 activators is the most likely mechanism for the cell autonomous insulin sensitizing effects of these agents. PTP1B is a well-known negative regulator of insulin action through dephosphorylation of insulin receptor, and recent reports showed that TNF-α treatment can increase PTP1B expression (37) and SIRT1 can repress skeletal muscle PTP1B (26). However, our data showed that in our model system TNF-α or SRT2530 treatment had no effect on either PTP1B expression (Fig. 8B) or tyrosine phosphorylation of the insulin receptor (Fig. S2C). Taken together, with previous studies showing that PTP1B did not affect glucose uptake in 3T3-L1 adipocytes (22, 28), our results indicate that the SIRT1-mediated insulin sensitivity is not due to changes in PTP1B. However, our results do not exclude the possibility that SIRT1 can also modulate insulin action through additional mechanisms, independent of inflammatory pathways.
It is of interest that previous reports have shown that SIRT1 can inhibit PPARγ activity (20). In our studies, SIRT1 was activated or deleted acutely, but only in differentiated cells, so that the differentiation status of the cells was unchanged. Since PPARγ itself mediates insulin sensitizing effects, it is likely that SIRT1 activation leads to insulin sensitization through a PPARγ-independent effect. Nevertheless, further studies of the interrelationship between SIRT1 and PPARγ would be of interest.
High-fat feeding is a well-described maneuver that leads to diet-induced obesity in rodents. This obese condition is associated with multiple signs of chronic, low-grade tissue inflammation and the development of insulin resistance. Since HFD also leads to a dramatic reduction in adipose tissue SIRT1 expression (Fig. 1), it is tempting to speculate that this downregulation of SIRT1 contributes to the heightened inflammatory state of adipose tissue in obesity.
In summary, the studies described here demonstrate that SIRT1 knockdown leads to inflammatory pathway activation with increased inflammatory gene expression, accompanied by decreased insulin signaling, impaired insulin-stimulated glucose uptake, and a state of cellular insulin resistance. In contrast, treatment of cells with a SIRT1 activator, produces anti-inflammatory effects, enhanced insulin sensitivity, and protects cells from TNF-α-induced insulin resistance. Taken together, these results suggest that SIRT1 serves as a negative regulator of inflammatory pathway activation and a positive regulator of insulin signaling in adipocytes. It has already been demonstrated that stimulation of SIRT1 in insulin resistant mice and rats leads to improved insulin sensitivity. Based on these studies, it is possible to suggest that pharmacologic activation of SIRT1 may provide a useful pathway for the development of new insulin sensitizers.
Supplementary Material
Acknowledgments
We are grateful to T. E. McGraw for HA-GLUT4-eGFP constructs; Pere Puigserver (Harvard Medical School, Boston, MA) for Ad with SIRT1 constructs; and High Throughput Genomics, Inc., for the ArrayPlate assay. We thank Elizabeth J. Hansen for editorial assistance.
This research was supported by the Eunice Kennedy Shriver NICHD/NNIH through cooperative agreement (U54 HD012303) as part of the Specialized Cooperative Centers Program in Reproduction and Infertility Research. This study was funded in part by the National Institutes of Health grants DK 033651 and DK 074868 (JMO); by Sirtris, a GSK company; and by the University of California Discovery Program Project bio03-10383 (BioStar) with matching funds from Pfizer, Inc.
J.M.O. is a consultant for Pfizer, Inc.
Footnotes
Published ahead of print on 22 December 2008.
Supplemental material for this article may be found at http://mcb.asm.org/.
REFERENCES
- 1.Aguirre, V., E. D. Werner, J. Giraud, Y. H. Lee, S. E. Shoelson, and M. F. White. 2002. Phosphorylation of Ser307 in insulin receptor substrate-1 blocks interactions with the insulin receptor and inhibits insulin action. J. Biol. Chem. 2771531-1537. [DOI] [PubMed] [Google Scholar]
- 2.Arkan, M. C., A. L. Hevener, F. R. Greten, S. Maeda, Z. W. Li, J. M. Long, A. Wynshaw-Boris, G. Poli, J. Olefsky, and M. Karin. 2005. IKK-beta links inflammation to obesity-induced insulin resistance. Nat. Med. 11191-198. [DOI] [PubMed] [Google Scholar]
- 3.Baur, J. A., K. J. Pearson, N. L. Price, H. A. Jamieson, C. Lerin, A. Kalra, V. V. Prabhu, J. S. Allard, G. Lopez-Lluch, K. Lewis, P. J. Pistell, S. Poosala, K. G. Becker, O. Boss, D. Gwinn, M. Wang, S. Ramaswamy, K. W. Fishbein, R. G. Spencer, E. G. Lakatta, D. Le-Couteur, R. J. Shaw, P. Navas, P. Puigserver, D. K. Ingram, R. de-Cabo, and D. A. Sinclair. 2006. Resveratrol improves health and survival of mice on a high-calorie diet. Nature 444337-342. [DOI] [PMC free article] [PubMed] [Google Scholar]
- 4.Cai, D., M. Yuan, D. F. Frantz, P. A. Melendez, L. Hansen, J. Lee, and S. E. Shoelson. 2005. Local and systemic insulin resistance resulting from hepatic activation of IKK-β and NF-κB. Nat. Med. 11183-190. [DOI] [PMC free article] [PubMed] [Google Scholar]
- 5.Chen, D., A. D. Steele, S. Lindquist, and L. Guarente. 2005. Increase in activity during calorie restriction requires Sirt1. Science 3101641. [DOI] [PubMed] [Google Scholar]
- 6.Cohen, H. Y., C. Miller, K. J. Bitterman, N. R. Wall, B. Hekking, B. Kessler, K. T. Howitz, M. Gorospe, R. de-Cabo, and D. A. Sinclair. 2004. Calorie restriction promotes mammalian cell survival by inducing the SIRT1 deacetylase. Science 305390-392. [DOI] [PubMed] [Google Scholar]
- 7.Elchebly, M., P. Payette, E. Michaliszyn, W. Cromlish, S. Collins, A. L. Loy, D. Normandin, A. Cheng, J. Himms-Hagen, C. C. Chan, C. Ramachandran, M. J. Gresser, M. L. Tremblay, and B. P. Kennedy. 1999. Increased insulin sensitivity and obesity resistance in mice lacking the protein tyrosine phosphatase-1B gene. Science 2831544-1548. [DOI] [PubMed] [Google Scholar]
- 8.Gao, Z., D. Hwang, F. Bataille, M. Lefevre, D. York, M. J. Quon, and J. Ye. 2002. Serine phosphorylation of insulin receptor substrate 1 by inhibitor κB kinase complex. J. Biol. Chem. 27748115-48121. [DOI] [PubMed] [Google Scholar]
- 9.Gao, Z., A. Zuberi, M. J. Quon, Z. Dong, and J. Ye. 2003. Aspirin inhibits serine phosphorylation of insulin receptor substrate 1 in tumor necrosis factor-treated cells through targeting multiple serine kinases. J. Biol. Chem. 27824944-24950. [DOI] [PubMed] [Google Scholar]
- 10.Gerhart-Hines, Z., J. T. Rodgers, O. Bare, C. Lerin, S. H. Kim, R. Mostoslavsky, F. W. Alt, Z. Wu, and P. Puigserver. 2007. Metabolic control of muscle mitochondrial function and fatty acid oxidation through SIRT1/PGC-1alpha. EMBO J. 261913-1923. [DOI] [PMC free article] [PubMed] [Google Scholar]
- 11.Haigis, M. C., and L. P. Guarente. 2006. Mammalian sirtuins: emerging roles in physiology, aging, and calorie restriction. Genes Dev. 202913-2921. [DOI] [PubMed] [Google Scholar]
- 12.Hevener, A. L., J. M. Olefsky, D. Reichart, M. T. Nguyen, G. Bandyopadyhay, H. Y. Leung, M. J. Watt, C. Benner, M. A. Febbraio, A. K. Nguyen, B. Folian, S. Subramaniam, F. J. Gonzalez, C. K. Glass, and M. Ricote. 2007. Macrophage PPARγ is required for normal skeletal muscle and hepatic insulin sensitivity and full antidiabetic effects of thiazolidinediones. J. Clin. Investig. 1171658-1669. [DOI] [PMC free article] [PubMed] [Google Scholar]
- 13.Hirosumi, J., G. Tuncman, L. Chang, C. Z. Gorgun, K. T. Uysal, K. Maeda, M. Karin, and G. S. Hotamisligil. 2002. A central role for JNK in obesity and insulin resistance. Nature 420333-336. [DOI] [PubMed] [Google Scholar]
- 14.Lesniewski, L. A., S. E. Hosch, J. G. Neels, C. de-Luca, M. Pashmforoush, C. N. Lumeng, S. H. Chiang, M. Scadeng, A. R. Saltiel, and J. M. Olefsky. 2007. Bone marrow-specific Cap gene deletion protects against high-fat diet-induced insulin resistance. Nat. Med. 13455-462. [DOI] [PubMed] [Google Scholar]
- 15.Li, X., S. Zhang, G. Blander, J. G. Tse, M. Krieger, and L. Guarente. 2007. SIRT1 deacetylates and positively regulates the nuclear receptor LXR. Mol. Cell 2891-106. [DOI] [PubMed] [Google Scholar]
- 16.Luo, J., A. Y. Nikolaev, S. Imai, D. Chen, F. Su, A. Shiloh, L. Guarente, and W. Gu. 2001. Negative control of p53 by Sir2alpha promotes cell survival under stress. Cell 107137-148. [DOI] [PubMed] [Google Scholar]
- 17.Martel, R. R., I. W. Botros, M. P. Rounseville, J. P. Hinton, R. R. Staples, D. A. Morales, J. B. Farmer, and B. E. Seligmann. 2002. Multiplexed screening assay for mRNA combining nuclease protection with luminescent array detection. Assay Drug Dev. Technol. 161-71. [DOI] [PubMed] [Google Scholar]
- 18.Miles, P. D., Y. Barak, R. M. Evans, and J. M. Olefsky. 2003. Effect of heterozygous PPARγ deficiency and TZD treatment on insulin resistance associated with age and high-fat feeding. Am. J. Physiol. Endocrinol. Metab. 284E618-E626. [DOI] [PubMed] [Google Scholar]
- 19.Milne, J. C., P. D. Lambert, S. Schenk, D. P. Carney, J. J. Smith, D. J. Gagne, L. Jin, O. Boss, R. B. Perni, C. B. Vu, J. E. Bemis, R. Xie, J. S. Disch, P. Y. Ng, J. J. Nunes, A. V. Lynch, H. Yang, H. Galonek, K. Israelian, W. Choy, A. Iffland, S. Lavu, D. A. Sinclair, J. M. Olefsky, M. R. Jirousek, P. J. Elliott, and C. Westphal. 2007. Novel small molecule activators of SIRT1 as therapeutics for treatment of type 2 diabetes. Nature 450712-716. [DOI] [PMC free article] [PubMed] [Google Scholar]
- 20.Picard, F., M. Kurtev, N. Chung, A. Topark-Ngarm, T. Senawong, R. Machado-De-Oliveira, M. Leid, M. W. McBurney, and L. Guarente. 2004. Sirt1 promotes fat mobilization in white adipocytes by repressing PPARγ. Nature 429771-776. [DOI] [PMC free article] [PubMed] [Google Scholar]
- 21.Rodgers, J. T., C. Lerin, W. Haas, S. P. Gygi, B. M. Spiegelman, and P. Puigserver. 2005. Nutrient control of glucose homeostasis through a complex of PGC-1α and SIRT1. Nature 434113-118. [DOI] [PubMed] [Google Scholar]
- 22.Shimizu, S., H. Maegawa, K. Egawa, K. Shi, M. Bryer-Ash, and A. Kashiwagi. 2002. Mechanism for differential effect of protein-tyrosine phosphatase 1B on Akt versus mitogen-activated protein kinase in 3T3-L1 adipocytes. Endocrinology 1434563-4569. [DOI] [PubMed] [Google Scholar]
- 23.Shoelson, S. E., J. Lee, and A. B. Goldfine. 2006. Inflammation and insulin resistance. J. Clin. Investig. 1161793-1801. [DOI] [PMC free article] [PubMed] [Google Scholar]
- 24.Sinclair, D. A. 2005. Toward a unified theory of caloric restriction and longevity regulation. Mech. Ageing Dev. 126987-1002. [DOI] [PubMed] [Google Scholar]
- 25.Solinas, G., C. Vilcu, J. G. Neels, G. K. Bandyopadhyay, J. L. Luo, W. Naugler, S. Grivennikov, A. Wynshaw-Boris, M. Scadeng, J. M. Olefsky, and M. Karin. 2007. JNK1 in hematopoietically derived cells contributes to diet-induced inflammation and insulin resistance without affecting obesity. Cell Metab. 6386-397. [DOI] [PubMed] [Google Scholar]
- 26.Sun, C., F. Zhang, X. Ge, T. Yan, X. Chen, X. Shi, and Q. Zhai. 2007. SIRT1 improves insulin sensitivity under insulin-resistant conditions by repressing PTP1B. Cell Metab. 4307-319. [DOI] [PubMed] [Google Scholar]
- 27.Vaziri, H., S. K. Dessain, E. Ng-Eaton, S. I. Imai, R. A. Frye, T. K. Pandita, L. Guarente, and R. A. Weinberg. 2001. hSIR2(SIRT1) functions as an NAD-dependent p53 deacetylase. Cell 107149-159. [DOI] [PubMed] [Google Scholar]
- 28.Venable, C. L., E. U. Frevert, Y. B. Kim, B. M. Fischer, S. Kamatkar, B. G. Neel, and B. B. Kahn. 2000. Overexpression of protein-tyrosine phosphatase-1B in adipocytes inhibits insulin-stimulated phosphoinositide 3-kinase activity without altering glucose transport or Akt/protein kinase B activation. J. Biol. Chem. 27518318-18326. [DOI] [PubMed] [Google Scholar]
- 29.Weisberg, S. P., D. McCann, M. Desai, M. Rosenbaum, R. L. Leibel, and A. W. Ferrante. 2003. Obesity is associated with macrophage accumulation in adipose tissue. J. Clin. Investig. 1121796-1808. [DOI] [PMC free article] [PubMed] [Google Scholar]
- 30.Xu, H., G. T. Barnes, Q. Yang, G. Tan, D. Yang, C. J. Chou, J. Sole, A. Nichols, J. S. Ross, L. A. Tartaglia, and H. Chen. 2003. Chronic inflammation in fat plays a crucial role in the development of obesity-related insulin resistance. J. Clin. Investig. 1121821-1830. [DOI] [PMC free article] [PubMed] [Google Scholar]
- 31.Yang, S. R., J. Wright, M. Bauter, K. Seweryniak, A. Kode, and I. Rahman. 2007. Sirtuin regulates cigarette smoke-induced proinflammatory mediator release via RelA/p65 NF-κB in macrophages in vitro and in rat lungs in vivo: implications for chronic inflammation and aging. Am. J. Physiol. Lung Cell Mol. Physiol. 292L567-L576. [DOI] [PubMed] [Google Scholar]
- 32.Yang, T., M. Fu, R. Pestell, and A. A. Sauve. 2006. SIRT1 and endocrine signaling. Trends Endocrinol. Metab. 17186-191. [DOI] [PubMed] [Google Scholar]
- 33.Yeung, F., J. E. Hoberg, C. S. Ramsey, M. D. Keller, D. R. Jones, R. A. Frye, and M. W. Mayo. 2004. Modulation of NF-κB-dependent transcription and cell survival by the SIRT1 deacetylase. EMBO J. 232369-2380. [DOI] [PMC free article] [PubMed] [Google Scholar]
- 34.Yoshizaki, T., T. Imamura, J. L. Babendure, J. C. Lu, N. Sonoda, and J. M. Olefsky. 2007. Myosin 5a is an insulin-stimulated Akt2 (protein kinase Bbeta) substrate modulating GLUT4 vesicle translocation. Mol. Cell. Biol. 275172-5183. [DOI] [PMC free article] [PubMed] [Google Scholar]
- 35.Yoshizaki, T., H. Maegawa, K. Egawa, S. Ugi, Y. Nishio, T. Imamura, T. Kobayashi, S. Tamura, J. M. Olefsky, and A. Kashiwagi. 2004. Protein phosphatase-2Cα as a positive regulator of insulin sensitivity through direct activation of phosphatidylinositol 3-kinase in 3T3-L1 adipocytes. J. Biol. Chem. 27922715-22726. [DOI] [PubMed] [Google Scholar]
- 36.Yuan, M., N. Konstantopoulos, J. Lee, L. Hansen, Z. W. Li, M. Karin, and S. E. Shoelson. 2001. Reversal of obesity- and diet-induced insulin resistance with salicylates or targeted disruption of IKKβ. Science 2931673-1677. [DOI] [PubMed] [Google Scholar]
- 37.Zabolotny, J. M., Y. B. Kim, L. A. Welsh, E. E. Kershaw, B. G. Neel, and B. B. Kahn. 2008. Protein tyrosine phosphatase 1B (PTP1B) expression is induced by inflammation in vivo. J. Biol. Chem. 28314230-14241. [DOI] [PMC free article] [PubMed] [Google Scholar]
- 38.Zick, Y. 2001. Insulin resistance: a phosphorylation-based uncoupling of insulin signaling. Trends Cell Biol. 11437-441. [DOI] [PubMed] [Google Scholar]
Associated Data
This section collects any data citations, data availability statements, or supplementary materials included in this article.


