Abstract
An optimization problem, formulated using a nonlinear least-squares approach, was used to estimate parameters for kinetic models of the three isoforms of the kidney-specific Na-K-2Cl (NKCC2) cotransporter. Specifically, the optimization problem estimates the magnitude of model parameters (i.e., off-binding and translocation rate constants) by minimizing the distance between model unidirectional fluxes and published unidirectional 86Rb+ uptake curves for the A, B, and F isoforms of the NKCC2 cotransporter obtained in transfected Xenopus oocytes. By using different symmetry assumptions, NKCC2 models with five, six, seven, or eight parameters were evaluated. The optimization method identified parameter sets that yielded computed unidirectional fluxes consistent with the uptake data. However, the parameter values were not unique, in that systematic exploration of the parameter space revealed alternative parameter sets that fit the data with similar accuracy. Finally, we demonstrate that the optimization method can identify parameter sets for the three transporter isoforms that differ only in ion binding affinities, a result that is consistent with a published mutagenesis analysis of the molecular and structural bases for the differences in 86Rb+ uptake among the A, B, and F isoforms. These NKCC2 cotransporter models will facilitate the development of larger scale models of ion transport by thick ascending limb cells.
Keywords: epithelial transport, thick ascending limb, kidney
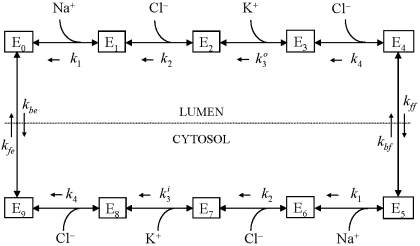
modeling thick ascending limb (TAL) cell ion transport requires derivation of suitable models of the Na-K-2Cl (NKCC2) cotransporter, which is the primary mechanism of ion uptake across the apical membrane. Because of the wide variation in luminal ion concentration in the TAL, the NKCC2 model must be thermodynamically consistent (e.g., display net flux reversal when the chemical potential difference of the ligands changes sign). For a given parameter set (binding and translocation rate constants) and intra- and extracellular ligand concentrations, the solution of a model of the NKCC2 cotransporter yields the distribution of the transporter among the possible states in an assumed kinetic scheme (see Fig. 1). From this distribution, unidirectional and net ion fluxes can be computed. For recent reviews of the NKCC2 cotransporter, see Refs. 9 and 15.
Fig. 1.
Kinetic model of the kidney-specific Na-K-2Cl (NKCC2) cotransporter. kj, off-binding rate constants; kon (not shown), on-binding rate constant; kff, kbf, kfe, and kbe, translocation constant rates; Ej, cotransporter density of state j.
The goal of this study was to determine whether estimates of the necessary model parameters (i.e., off-binding and translocation rate constants) could be obtained from binding kinetic curves for the A, B, and F isoforms of the NKCC2 cotransporter as measured by Plata et al. (13) in transfected Xenopus oocytes, an expression technique that has been used to characterize the kinetic properties of the NKCC2 isoforms. However, kinetic data from oocyte experiments present some potential difficulties in parameter estimation. First, the plateau regions of the binding-uptake curves are often not well defined, especially for Cl−. The reason for this is that these cells express an endogenous NKCC1 cotransporter that is activated by cell shrinkage. Hence, during the experiments, the exterior solution must remain isotonic, and this limits the range over which exterior ion concentrations can be varied to a value less than the range of tubular ion concentrations in the TAL in vivo. A second complication is that the interior ion concentrations are not measured and may differ substantially between laboratories; some investigators preincubate the oocytes in a K+- and Cl−-free solution before performing the uptake measurements (13), while others do not (see, for example, Refs. 6, 8).
Furthermore, parameter estimation in a model of the NKCC2 cotransporter is difficult because of the complexity of the model. Benjamin and Johnson (2) formulated a model for the NKCC2 cotransporter and used an optimization method to estimate model parameters by fitting a variety of experimental data. However, they were compelled to use an ad hoc approach where they first optimized a subset of parameters exhibiting the largest sensitivities and then found values for the other parameters by manually adjusting the value of the total amount of transporter. Nevertheless, the resulting parameter values provided an excellent fit to the data.
Chang and Fujita (3) applied an optimization technique to compute rate constants for a thiazide-sensitive Na-Cl cotransporter model that produced the closest simulation to the experimental results. The authors used only one set of initial values of the parameters to start the iterations, and to avoid convergence to unrealistic solutions, they constrained some parameters such that every one assumed one of five prescribed values. The authors also introduced symmetry in the model to reduce the number of parameters. Once the method found a solution, they relaxed the model symmetry manually to determine whether the solution could produce a simulation that was closer to the experimental data. Recently, Weinstein (16) estimated parameters for a Na-Cl cotransporter model that assumed equilibrium binding and symmetry of the binding rates across the membrane. This alternative formulation provided a better fit to recent experimental data, although the method used and the selection of the initial iterate were not described. A limitation of the approaches used in the above-mentioned studies (2, 3, 16) is that they provide no information about the possible existence of multiple solutions of the optimization problem, even on a local basis.
In this investigation, we formulated a nonlinear least-squares problem to compute the set of parameters for each isoform that minimizes the distance between the calculated unidirectional ion fluxes and measured 86Rb+ uptake curves. We also performed an extensive search of the parameter space to test for multiple minima. This was done by employing a wide range of starting guesses of the parameters (initial iterates). Using different symmetry assumptions, we also evaluated NKCC2 models with five, six, seven, and eight parameters to identify the simplest NKCC2 model that predicts results in agreement with published binding kinetic data. To compare our results with those of Benjamin and Johnson (2), we obtained parameter sets for the three NKCC2 isoforms that include translocation parameters identified in their study.
Finally, we used the model to examine the following question: Are differences in Cl− and Na+ binding affinities sufficient to explain the differences in measured half-maximum concentration Km values between the three NKCC2 isoforms? The motivation for this effort is a recent study by Giménez and Forbush (7) that characterized the relative importance of the residues within the alternative splice variants in determining the apparent Km values for Cl− and Na+. On the basis of extensive mutagenesis and kinetic analyses, as well as structural considerations, these investigators concluded that the sequence differences between splice variants primarily affect ion binding affinities locally near the binding sites, rather than indirectly through differences in protein conformation or translocation parameters. Because both Km and the maximum reaction rate Vmax, the experimental end points in the Giménez and Forbush study (7), depend on experimental conditions as well as all of the kinetic parameters of the cotransporter, we used the NKCC2 model to see whether alterations in the binding affinities of Cl− and Na+ alone could be sufficient to account for the known differences in ion uptake kinetics between the three isoforms.
MATHEMATICAL MODEL
The NKCC2 cotransporter model, illustrated in Fig. 1, is based on the model of Benjamin and Johnson (2), which in turn was based on the kinetic model proposed by Lytle and McManus (10) and Lytle et al. (11). Figure 1, top, shows the different cotransporter density states (Ej, j = 0, 1,…, 4) on the luminal side of the membrane; Fig. 1, bottom, shows the states on the cytosolic side of the membrane (Ej, j = 5, 6,…, 9). The model assumes sequential binding of the ions following the order: Na+, Cl−, K+, Cl−. The transporter undergoes a transformational change, and the ions are assumed to be released into the cytosol in the same order as they bound in the lumen, so-called glide symmetry (10, 11). The unloaded transporter is then transformed into a state where it is available for luminal ion binding. All reactions are assumed to be reversible.
First-order kinetics are used throughout. The model assumes ligand binding equilibrium (e.g., that binding reactions are much more rapid than carrier transformational changes or translocation). Moreover, we assume that the reaction cycle is in a steady state at all times. The ion binding rate constant kon (not shown in Fig. 1) is assumed to be the same for all ions and equal to 108 l·mol−1·s−1 as Benjamin and Johnson (2) and Chang and Fujita (3) assumed previously. The release rate constants kj (j = 1, 2, 3, 4), as well as the rate constants kff, kbf, kfe, and kbe describing transformation or translocation of the transporter across the membrane, are shown in Fig. 1, with arrows denoting their direction. Ion binding and release rate constants are the same on either side of the membrane, except for some simulations where the K+ release rate constants differed between the luminal and cytosolic sides (k and k
and k , respectively).
The model equations consist of the system of Eqs. 6–14 and 17 shown in the Appendix. In the steady state, dEj/dt = 0, for all j, and the model reduces to a system of linear equations. The steady-state equations can be written as
 |
(1) |
where e is the vector containing the nine states (Ej, j = 0, 1, 2,…, 8) of the cotransporter, A is a nine-by-nine matrix, and b is a vector of length nine. Both A and b depend on the binding, release, and translocation rate constants. The tenth state, E9, is computed using Eq. 17 in the Appendix.
Thermodynamic considerations place some restrictions on parameter values. The principle of detailed balance (1) states that in the absence of an energetically driven process, the product of the rate constants encountered when traversing a cyclic reaction scheme in one direction must equal the corresponding product when traversing the scheme in the opposite direction. Failure to adhere to this will result in non-zero net flux through the system when the solute concentrations are the same on both sides of the membrane. Thus the rate constants are not completely independent of each other. Applying the principle to the diagram in Fig. 1, one gets
 |
(2) |
Solving arbitrarily for kbe yields
 |
(3) |
The Optimization Problem
A nonlinear least-squares method was used to estimate the unknown parameters, within prescribed ranges, by minimizing the differences between the model unidirectional fluxes, computed by means of the direct method (vide infra), and the reported fluxes for the A, B, and F isoforms of the NKCC2 cotransporter from published flux data (13). The optimization problem can be written as follows
 |
(4) |
where JE is the vector containing the N experimental values of the fluxes, JM(p) is the vector containing the model unidirectional fluxes (see Appendix) computed using the direct method (vide infra) for the set of parameters p, where p is the vector containing the variable parameters, and pl and pu are the parameter lower and upper bounds, respectively. The inequality in Eq. 4 holds element by element. The data in Ref. 13 consist of three ion flux curves (Na+, K+ Cl−) for each isoform; the three curves were evaluated simultaneously.
Numerical Methods
The direct method.
In experiments (6, 8, 11, 13), kinetic curves were generated for the unidirectional fluxes as functions of external ion concentrations. Thus, for given parameter values, the direct method computes unidirectional fluxes for Na+, Cl−, and K+ for various external concentrations of the corresponding ion over the range used in the experiments; the external concentration values of the other two ions are kept fixed. For each concentration value of the varied ion, the unidirectional flux corresponding to 86Rb+ uptake is then calculated from the cotransporter density values, which are obtained by solving Eq. 1. The expressions, which are based on those derived by Benjamin and Johnson (2), are given in the Appendix.
Experimental data.
The NKCC2 flux data used in the optimization procedure are from studies by Plata et al. (13). For use in the optimization procedure, it was necessary to rescale and normalize the data, because the fluxes are expressed in nonstandard units of picomoles per oocyte per hour. Furthermore, because of variation in cotransporter expression between batches of oocytes, the apparent plateau regions of the flux curves for the same isoform often differed substantially, and not all of the uptake curves had well-defined plateau regions. Thus it was necessary to 1) obtain estimates of the apparent Vmax for each measured curve and 2) normalize the flux curves to ensure that the Vmax values for the Na+, K+, and Cl− curves for each isoform were consistent.
Estimates of Vmax were obtained by fitting the Hill equation with specified Hill coefficients (1 for Na+ and K+, 2 for Cl−) to the data in each uptake curve using a nonlinear least-squares method. This fitting procedure provides an estimate of the apparent Km; the values are listed (see Table 3) for comparison with the values obtained with our cotransporter model using the parameter values obtained with the optimization procedure wherein all three flux curves were fit simultaneously (vide infra).
The optimization procedure works best when the computed cotransporter fluxes and the maximal ligand concentrations are of similar orders of magnitude. Hence, the uptake data values were then rescaled such that each curve approached a Vmax of 500. This rescaling procedure is similar to that employed by Benjamin and Johnson (2).
The results of our computations are presented as normalized fluxes with unity Vmax. For comparison, the flux data were also normalized.
Parameter optimization algorithm.
With an initial value for the parameter vector p, we computed an approximate solution for Eq. 4 by using a trust-region method for nonlinear minimization with parameter bounds (4, 12); this is the parameter optimization algorithm (POA). To implement this method, we used the MATLAB function for large-scale optimization of nonlinear least-squares. This method is locally convergent, and thus it calculates a local minimum. Hence, a parameter space exploration must be conducted to check for the possible occurrence of multiple optima or a global optimum, as described below.
Parameter exploration algorithm.
The steps for the parameter exploration algorithm (PEA) were as follows. First, we generated a uniformly distributed population of M initial iterates for the optimization problem (Eq. 4) that were within the parameter ranges. Second, starting with each initial iterate, we executed independently the POA until convergence. Third, we selected the optimum or optima showing the smallest optimization function value. In case of more than one global optimum, we determined whether the parameter values were significantly different.
The value of M was set equal to 100. The parameter bounds pl and pu were set as follows: off-binding rates ranged from 105 to 109, and translocation rates ranged from 5 × 10² to 105. The parameter bounds were selected to ensure that chemical reactions are faster than translocations and thus that the binding equilibrium assumption holds. Moreover, these parameter bounds enclose the results reported by Benjamin and Johnson (2), Chang and Fujita (3), and Weinstein (16). The algorithms were implemented in MATLAB (The MathWorks, Natick, MA) and executed in a computer with four Intel Xeon 2.8-GHz processors. The MATLAB program for the NKCC2 model is available as an online supplement.
RESULTS
Table 1 contains the parameter values that were held fixed during the calculations. These are the on-binding rate constant, the total amount of transporter protein, and the intracellular concentrations of Na+, Cl−, and K+. The parameters allowed to vary were the off-binding rate constants (k1, k2, k , k
, k , and k4) and the translocation rate constants (kff, kbf, and kfe). By using different symmetry assumptions on those parameters, models with five, six, seven, and eight parameters were optimized for reported fluxes from published binding kinetic data for mouse NKCC2 isoforms expressed in Xenopus oocytes (13). The five-parameter model assumed that k4 = k2, k
 = k
= k , and kbf = kff. Note that by the thermodynamic constraint (Eq. 3), kbe = kfe. The five-parameter model allowed k1, k2, k
 , kff, and kfe to vary. The six-parameter model assumed that k4 = k2 and k
 = k
= k , and it allowed k1, k2, k
 , and the translocation parameters to vary. The seven-parameter model assumed that k4 = k2 and allowed the other parameters to vary. The eight-parameter model allowed the eight parameters to vary.
Table 1.
Fixed parameter values
| Parameter | Description | Value |
|---|---|---|
| kon, l·mol−1·s−1 | On-binding rate constant | 1.0 × 10⁸ |
| ET | Total amount of transporter | 1 |
| CNai, mM | Intracellular [Na+] | 7 |
| CCli, mM | Intracellular [Cl−] | 9 |
| CKi, mM | Intracellular [K+] | 124 |
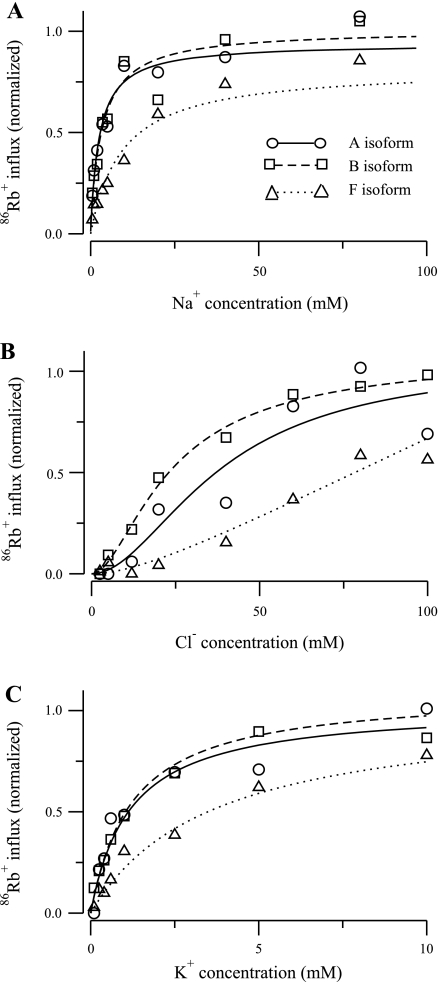
Results for the eight-parameter model for the three isoforms of the NKCC2 cotransporter obtained with the normalized data reported by Plata et al. (13) are shown in Fig. 2. Na+ concentration is shown in Fig. 2A, Cl− concentration in Fig. 2B, and K+ concentration in Fig. 2C. Each plot shows 86Rb+ influx as a function of ion concentration. When Na+ concentration was varied from 0 to 97 mM, Cl− and K+ concentrations were kept fixed to 110 and 10 mM, respectively. When Cl− concentration was varied from 0 to 110, Na+ and K+ concentrations were kept fixed to 97 and 10 mM, respectively. When K+ concentration was varied from 0 to 10 mM, Na+ and Cl− concentrations were kept fixed to 97 and 110 mM, respectively. All of these ranges and concentrations conform to those used in the experiments of Plata et al. (13). The values of the model parameters obtained using the parameter optimization method are shown in Table 2.
Fig. 2.
86Rb+ influx as a function of ion concentration for 3 isoforms of the NKCC2 cotransporter reported in Plata et al. (13). A: Na+ concentration was varied from 0 to 97 mM and Cl− and K+ concentrations were kept fixed to 110 and 10 mM, respectively. B: Cl− concentration was varied from 0 to 110 mM and Na+ and K+ concentrations were kept fixed to 97 and 10 mM, respectively. C: K+ concentration was varied from 0 to 10 mM and Na+ and Cl− concentrations were kept fixed to 97 and 110 mM, respectively. For the A isoform, the continuous line and circles represent model and experimental data, respectively; for the B isoform, the dashed line and squares represent model and experimental data, respectively; and for the F isoform, the dotted line and triangles represent model and experimental data, respectively.
Table 2.
Optimization results for the four models for the three isoforms reported in Plata et al. (13)
| Parameter |
A Isoform Number of Parameters |
B Isoform Number of Parameters
|
F Isoform Number of Parameters
|
|||||||||
|---|---|---|---|---|---|---|---|---|---|---|---|---|
| 5 | 6 | 7 | 8 | 5 | 6 | 7 | 8 | 5 | 6 | 7 | 8 | |
| K1, l/mol | 76.65 | 977.2 | 725.1 | 1,000 | 21.80 | 49.86 | 73.04 | 40.80 | 102.1 | 208.9 | 22.86 | 22.19 |
| K2, l/mol | 1.396 | 0.8150 | 1.072 | 0.7428 | 873.7 | 1,000 | 979.8 | 999.5 | 3.131 | 3.117 | 3.232 | 5.891 |
| K3o, l/mol | 1,000 | 996.0 | 856.1 | 892.3 | 6.633 | 4.627 | 0.1012 | 13.96 | 1,000 | 1,000 | 1,000 | 1,000 |
| K3i, l/mol | k3o | k3o | 59.25 | 458.8 | k3o | k3o | 6.444 | 22.67 | k3o | k3o | 132.5 | 188.3 |
| K4, l/mol | k2 | k2 | k2 | 46.71 | k2 | k2 | k2 | 113.4 | k2 | k2 | k2 | 0.5744 |
| kff, s−1 | 33,569 | 89,292 | 77,053 | 1,824 | 960.0 | 1,132 | 100,000 | 3,428 | 2,104 | 2,115 | 2,038 | 8,747 |
| kbf, s−1 | kff | 4,735 | 42,143 | 2,724 | kff | 500.0 | 659.5 | 500.0 | kff | 949.5 | 79,383 | 67,210 |
| kfe, s−1 | 1,189 | 906.0 | 501.9 | 18,781 | 99,974 | 86,284 | 55,208 | 22,552 | 100,000 | 99,538 | 99,562 | 100,000 |
| kbe, s−1 | kfe | 17,085 | 13,259 | 24,460 | kfe | 195,342 | 131,429 | 95,219 | kfe | 221,702 | 19,281 | 69,116 |
Kj, equilibrium binding constants Kj = kon/kj for the ion j; kff, kbf, kfe, and kbe, translocation rate constants.
As shown in Fig. 2, the 86Rb+ uptake curves predicted by the model fit the experimental data for all three NKCC2 isoforms reasonably well. These are the best fits that the PEA was able to identify within the broad parameter space searched. In Table 3, we show the predicted Michaelis-Menten constants for Na+, Cl−, and K+ transport in the three isoforms. These values were computed as the ion concentrations that lead to unidirectional fluxes of 0.5 in the NKCC2 models. The values reported in Table 1 of Plata et al. (13) are included for reference, as are the Km values we obtained from the nonlinear fitting of the Hill equation we did as part of the data scaling procedure (labeled as recomputed value; see Numerical Methods). The Km values computed by the NKCC2 models for Na+ and K+ agree reasonably well with those reported by Plata et al. (13). In contrast, the Km values from our cotransporter model for Cl− are consistently higher than the published values, although the qualitative relationship between the isoforms (B isoform Km < A isoform Km < F isoform Km) is the same. In part, the differences seem to be related to the method used by Plata et al. (13) to estimate the Km values (linear regression of log-transformed data normalized by Vmax, which was taken to be the flux at the highest ligand concentration). If the plateau region of the curve is not well defined, this method will underestimate Km. This assertion is further supported by the agreement between the recomputed Km values we obtained by nonlinear fitting of the Hill equation to the Cl− data and the predictions of the NKCC2 model. It is important to note also that the asymptotic standard errors of the recomputed Cl− Km values for the A and F isoforms are large. The reason is apparent in the Cl− data reported in Ref. 13 and shown in Fig. 2B. The A isoform data (circles) have the highest variability, whereas the F isoform data (triangles) exhibit the poorest definition of the plateau region. Both of these factors tend to increase the level of uncertainty about the exact value of Km.
Table 3.
Michaelis-Menten constant values (in mM) for the three isoforms
| Number of Parameters | A Isoform | B Isoform | F Isoform | |||
|---|---|---|---|---|---|---|
| Na+ | ||||||
| 5 | 2.9 | 3.1 | 14.7 | |||
| 6 | 2.8 | 3.2 | 14.7 | |||
| 7 | 2.8 | 3.3 | 14.7 | |||
| 8 | 2.8 | 3.2 | 14.7 | |||
| Published value | 5.0±3.9 | 3.0±0.6 | 20.6±7.2 | |||
| Recomputed value | 3.0±0.8 | 3.2±0.9 | 14.3±4.6 | |||
| Cl− | ||||||
| 5 | 37.4 | 23.0 | 77.2 | |||
| 6 | 37.1 | 22.7 | 77.2 | |||
| 7 | 37.2 | 22.6 | 77.3 | |||
| 8 | 37.1 | 23.0 | 78.3 | |||
| Published value | 22.2±4.8 | 11.6±0.7 | 29.2±2.1 | |||
| Recomputed value | 37.6±21.6 | 22.8±2.7 | 79.4±55.4 | |||
| K+ | ||||||
| 5 | 1.0 | 1.0 | 3.7 | |||
| 6 | 1.1 | 1.1 | 3.7 | |||
| 7 | 1.1 | 1.1 | 3.7 | |||
| 8 | 1.1 | 1.0 | 3.5 | |||
| Published value | 0.96±0.16 | 0.76±0.07 | 1.54±0.16 | |||
| Recomputed value | 1.0±0.5 | 1.0±0.2 | 3.1±1.6 | |||
Values with 5–8 parameters were obtained from the model. Published values were reported by Plata et al. (13). Recomputed values were estimated by nonlinear fitting of the Hill equation.
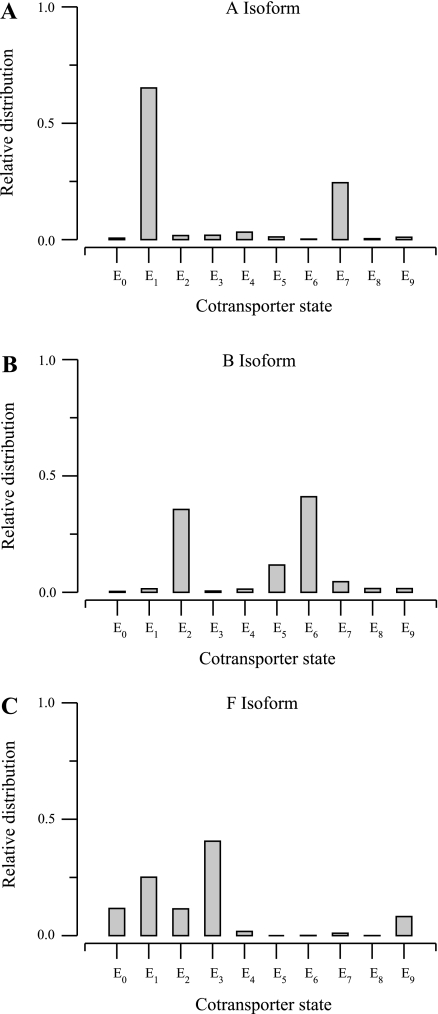
In Fig. 3, we show the relative distribution of the cotransporter between states of the eight-parameter model when the external ion concentrations are set to corresponding half-maximum concentrations listed in Table 3. In each of the three isoform models, the fractional amount of cotransporter did not exceed 0.5 in any state for the B and F isoforms, and only one state exceeded that value for the A isoform. This implies that, with these parameter values, no step is strongly rate limiting.
Fig. 3.
Cotransporter relative distribution obtained by solving the model in Eq. 1 with the parameters in Table 2 and fixed external concentrations equal to the half-maximum concentrations reported in Table 3. A: A isoform. B: B isoform. C: F isoform.
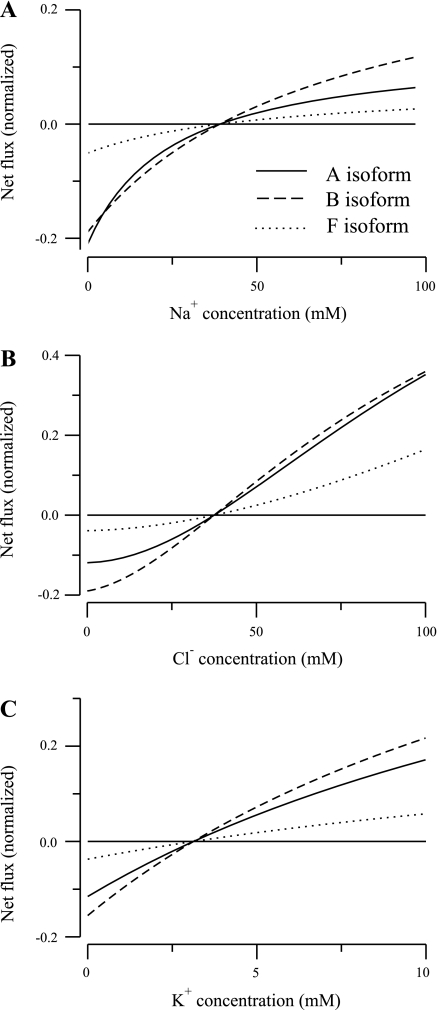
To verify that the parameter values lead to thermodynamically reasonable behavior, we ran simulations under conditions where the chemical potential difference across the membrane changes sign and the transporter reverses. The results, illustrated in Fig. 4, show that the net fluxes (J = J45 − J54; see Eqs. 22 and 23 in Appendix) of all three isoforms reverse at the same concentrations. This behavior is expected because the chemical potential depends only on the ligand concentration differences, and not on the parameters.
Fig. 4.
Net flux as a function of ion concentration for 3 isoforms of the NKCC2 cotransporter reported in Plata et al. (13). When kept fixed, the external ion concentrations were set to 25, 30, and 2 mM for Na+, Cl−, and K+, respectively. A: A isoform. B: B isoform. C: F isoform.
Inspection of the Km values in Table 3 illustrates that the five-, six- and seven-parameter models exhibit behavior similar to that of the eight-parameter model. Increasing the number of model parameters removes symmetry in the model, and the residual values, i.e., the value of the function in the optimization problem (4), monotonically decreases in each isoform.
Table 4 lists the results obtained from the F-test for pairs of models from five- to eight-parameter models. The value of F is calculated as follows
 |
(5) |
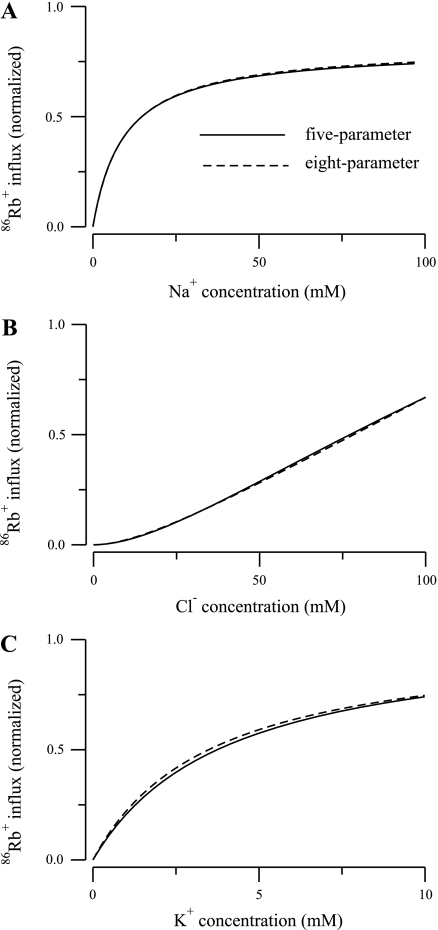
where f1 is the residual sum-squared-error value of the model with smaller number of parameters n1 and f2 is the residual sum-squared-error value of the model with larger number of parameters n2, N = 25 is the total number of data (17). From Table 4 it is worth noting that the reduction in the number of parameters, in a statistical sense, does not significantly affect the agreement between the model prediction and experimental data. To put this into perspective, in Fig. 5, we show kinetic curves for Na+, Cl−, and K+ for the F isoform of the five- and eight-parameter models. The continuous line represents the five-parameter model; the dashed line represents the eight-parameter model. Note that the largest difference is in the predicted K+ uptake curve (Fig. 5C), but the shift is relatively minor. Moreover, from Table 3, note that the largest relative difference of the Km values is for K+ of the F isoform for the five- and eight-parameter models, and that value is 0.057.
Table 4.
F-test for pairs of models
| Number of Parameters | A Isoform | B Isoform | F Isoform |
|---|---|---|---|
| 5 and 6 | 8.7 × 10⁻² | 4.6 × 10⁻¹ | 2.4 × 10⁻³ |
| 6 and 7 | 1.9 × 10⁻² | 2.6 × 10⁻² | 8.7 × 10⁻² |
| 7 and 8 | 1.2 × 10⁻² | 1.4 × 10⁻¹ | 1.4 × 100 |
Fig. 5.
86Rb+ influx as a function of ion concentration for the F isoform of the NKCC2 cotransporter for the 5- and 8-parameter models. A: Na+ uptake. B: Cl− uptake. C: K+ uptake.
Comparison with the Benjamin and Johnson Model
Our NKCC2 model is based on a previous model developed by Benjamin and Johnson (2). Our six-parameter NKCC2 model corresponds to their model, but we have employed a more robust optimization method. Furthermore, we fit our isoform models to uptake data generated by specific isoforms expressed in oocytes, whereas they analyzed a variety of cell types. The cells most relevant to our study are the MDCK and LLC-PK1 cells, which are of renal origin. However, to the best of our knowledge, the identity of the NKCC2 isoforms expressed in these cells is unknown.
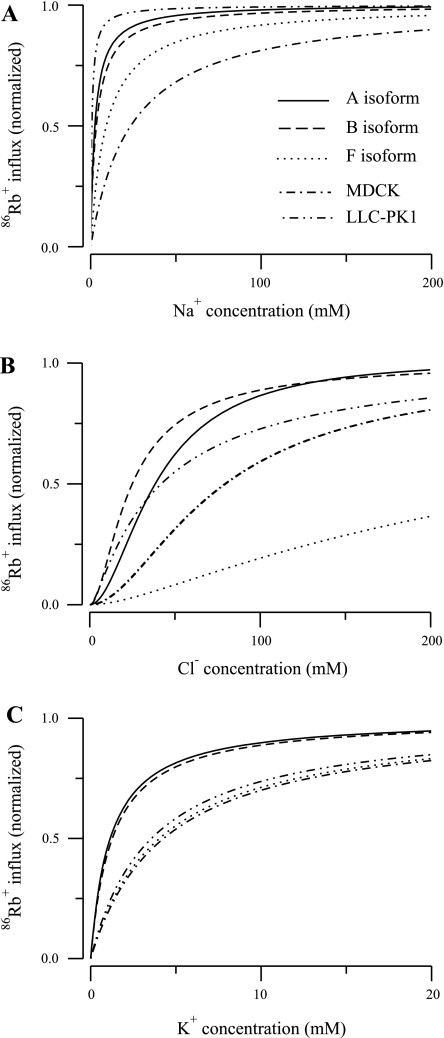
Table 5 lists the parameter values identified by Benjamin and Johnson (2) for these two cell lines, as well as our parameter estimates for the six-parameter model. To aid in the comparison, the parameters are expressed relative to our B isoform parameter values. Although there are differences between the parameters of three isoforms and the estimates obtained by Benjamin and Johnson (2), the question is, how do these differences influence model behavior? To address this question, we simulated the uptake experiments of Plata et al. (13) with our six-parameter model using the MDCK and LLC-PK1 parameters. The results are shown in Fig. 6, which also plots the uptake curves for our six-parameter model using our isoform parameters. For comparison, each curve was normalized by the Vmax computed at saturation. Given the differences in the data used to estimate the parameters, the agreement between the models is reasonable. Moreover, it is interesting that the uptake rates predicted by the Benjamin and Johnson model generally fall between the A and F isoform curves, which suggests that MDCK and LLC-PK1 cells may express multiple NKCC2 isoforms.
Table 5.
Comparison of parameter values from two cell types published in Benjamin and Johnson (2) to B isoform of the NKCC2 model
| Parameter | B Isoform (Control) | A Isoform | F Isoform | MDCK | LLC-PK1 |
|---|---|---|---|---|---|
| KNa | 1 | 19.60 | 4.19 | 0.044 | 0.896 |
| KCl | 1 | 0.0008 | 0.0031 | 0.051 | 0.431 |
| KK | 1 | 215.3 | 216.1 | 19.11 | 0.921 |
| kff | 1 | 78.88 | 1.868 | 1.58 | 1.242 |
| kbf | 1 | 9.47 | 1.899 | 19.53 | 8.05 |
| kfe | 1 | 0.0105 | 1.154 | 0.438 | 0.438 |
| kbe | 1 | 0.0875 | 1.135 | 0.035 | 0.0676 |
Values are ratios of parameter values for MDCK and LLC-PK1 cells from Benjamin and Johnson (2) and A and F isoforms for the NKCC2 6-parameter models to the parameter values obtained with the NKCC2 6-parameter model for the B isoform (control).
Fig. 6.
86Rb+ influx as a function of ion concentration for the parameters computed for the 3 isoforms with the NKCC2 6-parameter model and the parameters computed by Benjamin and Johnson (2) for MDCK and LLC-PK1 cells. Curves were normalized by the maximum reaction rate Vmax computed at saturation. A: Na+ uptake. B: Cl− uptake. C: K+ uptake.
Parameter Variation and Alternative Optima
Although the parameter sets listed in Table 2, each of which exhibits the smallest residual error, all provide reasonable fits to the data of Plata et al. (13), there are some aspects of the estimates that deserve attention. First, the degree of individual parameter variation between isoforms is substantial. Although differences in binding off rates are to be expected, the variation between the translocation parameters is much higher than suggested by the study of Giménez and Forbush (7), who concluded that the principal differences between NKCC2 isoforms could be attributed to variation in ion binding affinities.
The second issue is, are there other parameter sets that lead to essentially equivalent model behavior? Recall that the PEA executes 100 independent runs of the POA. Each run starts with an initial iterate that is randomly selected from a uniform distribution within the parameter bounds and returns an optimum parameter set. In Table 2, the optimum with the smallest residual error is listed, as specified in Eq. 4, for each model and isoform. However, for each isoform and model, there are other optima with slightly larger error function values but with significant differences in some parameters. As expected on the basis of the similarity in residual error, these parameter sets also provide reasonable fits to the data that, in a statistical sense where the variability of the data is taken into account, may not differ from the fits provided by the parameters in Table 2 (not shown).
The PEA also identified numerous local optima with error function magnitudes substantially greater than those of the optimum parameter set listed in Table 2. In some cases, 50% of the initial iterates led to such local optima. This suggests that the optimization surface is complex and that attempts to identify parameters without a broad search of the parameter space would be difficult. Interestingly, Benjamin and Johnson (2) reported just such difficulties in their study.
The fact that we identify multiple parameter sets that yield very similar fits suggests that typical uptake data from oocytes may be insufficient to obtain unique parameter estimates. One approach to rectification of this issue is to reduce model order and, hence, the number of parameters estimated. However, even our simplified five-parameter NKCC2 model shows a similar degree of inter-isoform translocation parameter variation. A second approach is to include additional data in the optimization procedure. However, we are not aware of any isoform-specific kinetic data that are not obtained in oocytes, and, as noted above, the restrictions inherent in working with live cells precludes some kinds of experiments that would provide additional constraints on parameter values (i.e., fluxes under zero cis or trans conditions, obligate ion exchange).
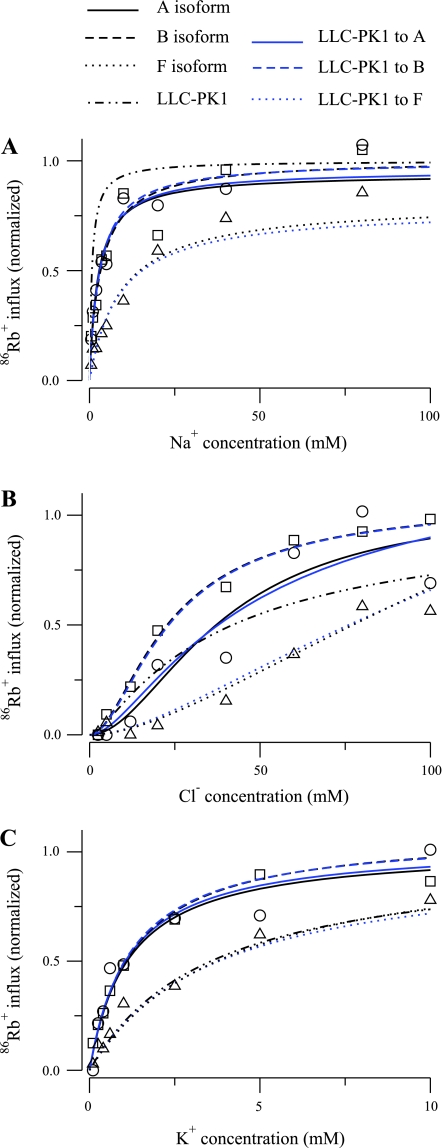
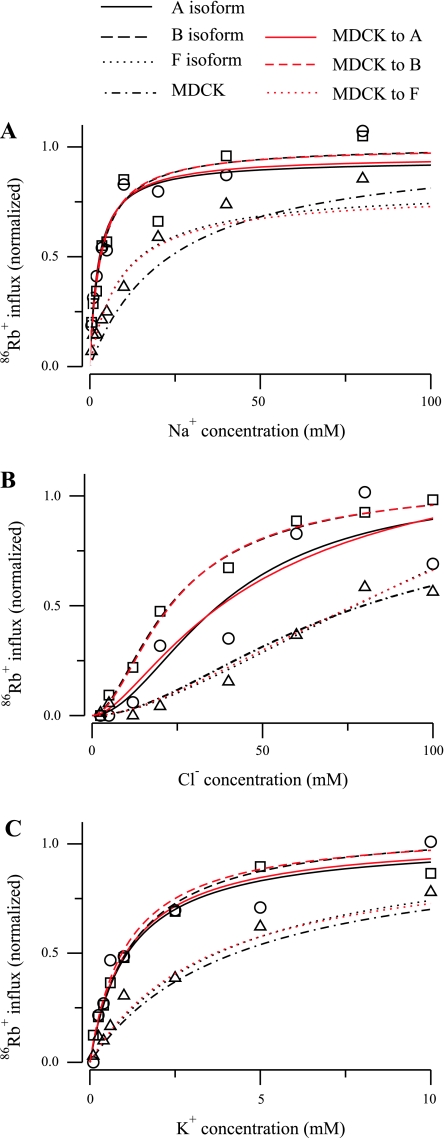
An alternative approach is to include indirectly additional constraints on the translocation parameters by employing the values identified by Benjamin and Johnson (2); these values were found to be suitable to predict ion uptake in a variety of cell types, both renal and nonrenal. To do this, we used our six-parameter model, which is equivalent to that used by Benjamin and Johnson (2), in an optimization problem where the data are the uptake curves measured by Plata et al. (13), and the initial values were the parameter values reported by Benjamin and Johnson (2) for cells of renal origin (MDCK cells and vesicles from LLC-PK1 cells). During the optimization, the translocation parameters were fixed. The results are shown in Figs. 7 and 8, and the parameters are listed in Table 6. For the B and F isoforms, adjustment of the three binding parameters was sufficient to obtain fits that are virtually identical to those provided by the parameters in Table 2. For the A isoform, it was necessary to allow one translocation coefficient to vary to obtain a reasonable fit to the data. These results illustrate how very similar model behavior can be obtained with substantially different parameter values.
Fig. 7.
86Rb+ influx as a function of ion concentration for the 6-parameter model of the NKCC2 cotransporter for the 3 isoforms reported in Plata et al. (13). A: Na+ uptake. B: Cl− uptake. C: K+ uptake. Blue curves were obtained by computing optimal parameters by allowing the off-binding rates to vary and keeping fixed the translocation rates to the parameters reported by Benjamin and Johnson (2) for the LLC-PK1 cells. For comparison, the results obtained by evaluating the parameters reported by Benjamin and Johnson (2) in the 6-parameter model are included.
Fig. 8.
86Rb+ influx as a function of ion concentration for the 6-parameter model of the NKCC2 cotransporter for the 3 isoforms reported in Plata et al. (13). A: Na+ uptake. B: Cl− uptake. C: K+ uptake. Red curves were obtained by computing optimal parameters by allowing the off-binding rates to vary and keeping fixed the translocation rates to the parameters reported by Benjamin and Johnson (2) for the MDCK cells. For comparison, the results obtained by evaluating the parameters reported by Benjamin and Johnson (2) in the 6-parameter model are included.
Table 6.
Comparison of parameter values from transformation of two cell types published in Benjamin and Johnson (2) to isoforms of the NKCC2 model
| Parameter | B&J MDCK | B&J LLC-PK1 | MDCK to A Isoform | LLC-PK1 to A Isoform | MDCK to B Isoform | LLC-PK1 to B Isoform | MDCK to F Isoform | LLC-PK1 to F Isoform |
|---|---|---|---|---|---|---|---|---|
| KNa, l/mol | 2.18 | 44.69 | 17.50 | 31.95 | 1.958 | 5.037 | 29.75 | 39.56 |
| KCl, l/mol | 50.72 | 413.29 | 22.71 | 22.52 | 999.8 | 768.3 | 3.864 | 5.473 |
| KK, l/mol | 88.43 | 4.26 | 397.9 | 399.4 | 3.779 | 5.28 | 901.4 | 617.0 |
| kff, s−1 | 1,791 | 1,406 | 893.6 | 900.3 | 1791 | 1,406 | 1,791 | 1,406 |
| kbf, s−1 | 9,765 | 4,025 | 9,765 | 4,025 | 9,765 | 4,025 | 9,765 | 4,025 |
| kfe, s−1 | 37,767 | 37,767 | 37,767 | 37,767 | 37,767 | 37,767 | 37,767 | 37,767 |
| kbe, s−1 | 6,927 | 13,193 | 3,456 | 8,448 | 6,927 | 13,193 | 6,927 | 13,193 |
Differential Ion Binding Between Isoforms
Figures 9 and 10 present the results of our analysis of the conclusions of the study by Giménez and Forbush (7) in which, by site-directed mutagenesis, they succeeded in transforming the B isoform into a protein that exhibited 86Rb+ uptake kinetics similar to the A or F isoform. The authors proposed a structure for the alternative splice variants that place the six mutated amino acids (a subset of the residues that differ between the 3 isoforms) at putative Cl− and Na+ binding sites. On the basis of this structure and their experimental results, the authors proposed that sequence differences between isoforms primarily influence Cl− and Na+ binding affinities, rather than altering overall protein structure or other kinetic parameters.
Fig. 9.
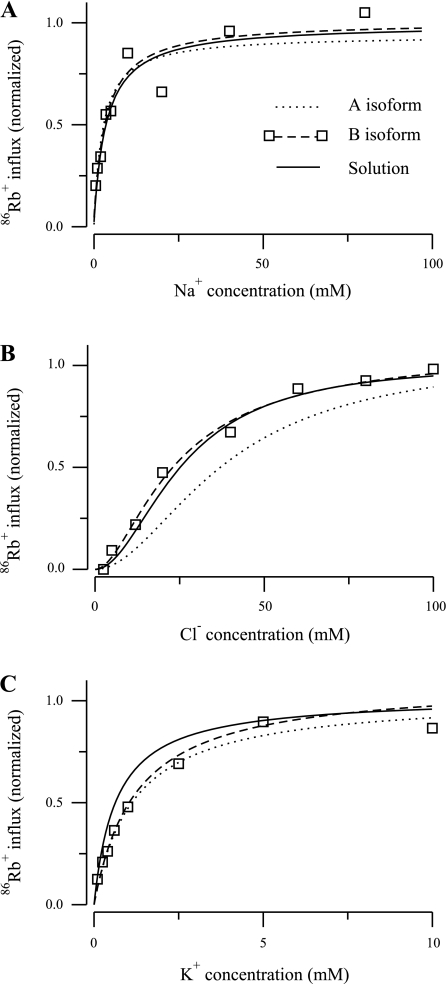
86Rb+ influx as a function of ion concentration for the B isoforms of the NKCC2 cotransporter reported in Plata et al. (13). A: Na+ uptake. B: Cl− uptake. C: K+ uptake. Optimal parameters were computed by allowing the off-binding rates for Na+ and Cl− to vary during the optimization process and keeping fixed the other parameters to the optimal values in Table 2 (8 parameters) for the A isoform. The continuous line represents the solution obtained using this process, the dotted line represents the A isoform for the parameters in Table 2 (8 parameters), and the dashed line represents the B isoform for the parameters in Table 2 (8 parameters); squares indicate data values.
Fig. 10.
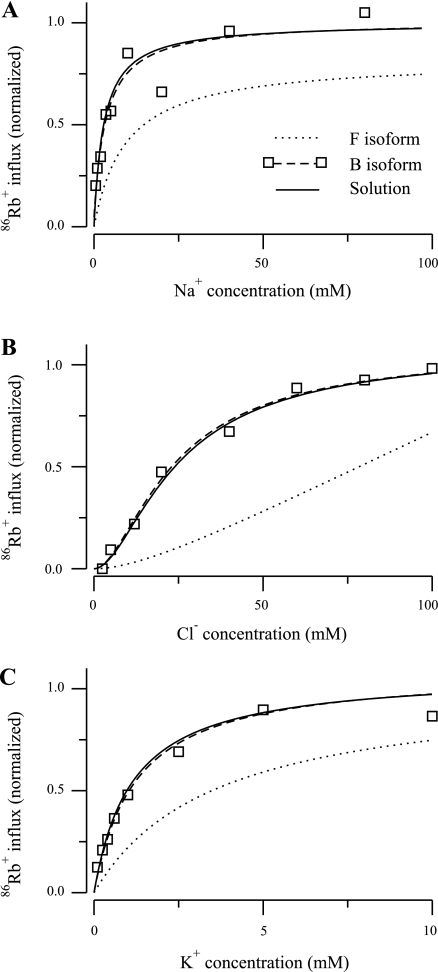
86Rb+ influx as a function of ion concentration for the B isoforms of the NKCC2 cotransporter reported in Plata et al. (13). A: Na+ uptake. B: Cl− uptake. C: K+ uptake. Optimal parameters were computed by allowing the off-binding rates for Na+, K+, and Cl− to vary during the optimization process and keeping fixed the other parameters to the optimal values on Table 2 (8 parameters) for the F isoform. The continuous line represents the solution obtained using this process, the dotted line represents the F isoform for the parameters in Table 2 (8 parameters), and the dashed line represents the B isoform for the parameters in Table 2 (8 parameters); squares indicate data values.
To explore this interesting hypothesis, we used the NKCC2 model and the POA to determine whether, by varying just the Cl− and Na+ binding coefficients, it is possible to transform the kinetics of one model isoform into another. In this effort, we utilized the data of Plata et al. (13) rather than kinetic data presented in the Giménez and Forbush study (7), which do not include measurement of the K+ dependency of 86Rb+ uptake. Figure 9 illustrates the results of an A-to-B isoform transformation, where the initial parameters were the optimal parameters of the eight-parameter A isoform model listed in Table 2. The dotted line in Fig. 9 shows the predicted uptake kinetics of the A isoform. The POA, with only k1, k2, and k4 allowed to vary, was then used to fit the model to the experimental data for the B isoform (squares); the dashed line shows the predicted uptake kinetics obtained with the optimal parameters given in Table 2. The results of the analysis, plotted with solid lines, show close agreement with the B isoform data and the optimal fit for the B isoform model. To obtain the fit, the release rate constants for Na+ and Cl− changed as follows: k1 and k4 decreased by 76 and 5%, respectively, and k2 increased by 265%. The Km values for the B isoform transformed model were 3.2, 26.7, and 0.575 mM for Na+, Cl−, and K+, respectively. It is interesting that the K+ uptake curve shifted, even though the K+ binding coefficients were not varied in the fitting. This is a good illustration of the fact that apparent Km values are functions of all of the model parameters and not just those related to binding of a specific ion.
These results are consistent with the concepts proposed by Giménez and Forbush (7), but this is not too surprising since the uptake kinetics of the A and B isoforms differ significantly only in Cl− dependency. In contrast, the B and F isoforms show significant differences in uptake dependency for all three ions. Figure 10 shows the results of an F-to-B transformation of the model. The data points are those of the B isoform, and the dashed line is the optimal fit. The dotted line is the predicted uptake curve using the optimal F isoform parameters. The Na+, Cl−, and K+ parameters (k1, k2, k , k
, k , and k4) were allowed to vary; the translocation parameters are from the eight-parameter F isoform model. The results, plotted as solid lines, show that the transformed kinetics agree well with the B-isoform data and the kinetics predicted by the NKCC2 model with the optimal fit parameters. Again, this is consistent with the binding hypothesis of Giménez and Forbush (7). The Km values for the B isoform transformed model are 2.9, 23.93, and 0.98 mM for Na+, Cl−, and for K+, respectively. The release rate constants changed as follows: k1 and k
 decreased by 96 and 97%, respectively, and k2 and k
 increased by 5,841 and 3,831%, respectively. Table 7 lists the ratios of the parameter values obtained by the A-to-B and F-to-B isoform transformations, with respect to the B isoform.
Table 7.
Comparison of NKCC2 model parameter values from the isoform transformation experiment relative to B isoform parameters
| Parameter | B Isoform (Control) | A Isoform | F Isoform | A to B | F to B |
|---|---|---|---|---|---|
| K1 | 1 | 24.51 | 0.5439 | 5.88 | 0.0204 |
| K2 | 1 | 0.0007 | 0.0059 | 0.0027 | 0.3503 |
| K3o | 1 | 63.91 | 71.62 | 63.91 | 2.353 |
| K3i | 1 | 20.24 | 8.305 | 20.24 | 112.6 |
| K4 | 1 | 0.4119 | 0.0051 | 0.4097 | 0.1992 |
| kff | 1 | 0.5321 | 2.551 | 0.5321 | 2.551 |
| kbf | 1 | 5.448 | 134.4 | 5.448 | 134.4 |
| kfe | 1 | 0.8328 | 4.434 | 0.8328 | 4.434 |
| kbe | 1 | 0.2569 | 0.7259 | 0.2569 | 0.0018 |
Values are ratios of parameter values for the A-to-B isoform transformation and the F-to-B isoform transformation to the parameter values obtained with the NKCC2 model for the B isoform (control).
The results of the foregoing isoform transformation simulation, as well as the parameter sets in Table 6 that build on the analysis of Benjamin and Johnson (2), show that an optimization strategy that incorporates insights from molecular and structural studies can provide parameter sets for the three isoforms that exhibit much less variability in parameter estimates than approaches where all parameter values are free to change (compare Tables 2 and 7). Although the later approach may yield marginally less residual error, there is little difference in model behavior, as shown by the plots in Figs. 9 and 10.
DISCUSSION
The most difficult task in modeling the NKCC transporter is finding values for a relatively large set of parameter values (e.g., rate constants for ion binding, release, and translocation) that yield model behaviors consistent with experimental data. Attacking this problem with a sensitivity analysis, where one parameter is varied while all others are kept fixed, is virtually impossible, because measured variables are normally influenced by several parameters. In this work, we used optimization methods to solve the nonlinear least-squares problem and to explore automatically and systematically the parameter space by starting the iterations with widely differing sets of initial iterates uniformly distributed on the parameter space. With the parameter space exploration algorithm, it is likely that the minimum found by the least-squares algorithm is the best one over a large range of parameter values. We successfully applied the method to sets of ion binding data for the three NKCC2 isoforms, and for each isoform, parameter sets were identified for four NKCC2 models with varying degrees of symmetry in the binding and translocation rate constants.
Similar nonlinear least-square approaches have been used by Benjamin and Johnson (2) to identify NKCC1 cotransporter parameters and by Chang and Fujita (3) to estimate Na-Cl cotransporter parameters in distal tubular cells. In both studies, the algorithms used to solve the problem investigated only one initial iterate. Furthermore, in both works, the authors reported problems in finding solutions that required some kind of human intervention to direct the minimization. Our study provides insight into the probable origin of these problems, since our results show that there are numerous local optima that can trap search algorithms. Nevertheless, the parameter sets obtained by Benjamin and Johnson (2) yield functional behavior that is reasonable in relationship to the behavior of the three isoform models we have developed. Furthermore, we have shown that their parameters can be used as a starting point to obtain reasonable parameter sets for the NKCC2 isoforms.
Our study also shows that essentially identical model fits to the measured uptake data can be obtained with multiple parameter sets. Although our methods always returned one set with the smallest residual least-squared error, this alone is not sufficient to ensure a statistically better fit than other parameter sets with slightly greater residual error. While this does not preclude use of the resulting models to predict overall cotransporter function (ion uptake into TAL cells), it does suggest that, at present, caution must be exercised in efforts to relate the parameters to functional details of the transporter cycle. This limitation is likely related to the paucity of experimental data relative to the complexity of the NKCC2 transporter. In general, the ability of inverse methods to identify unique parameter sets depends critically on the nature, quality, and quantity of the experimental data used in the optimization process. The kinetics of ion binding by the isoforms of the NKCC2 cotransporter has, to the best of our knowledge, only been assessed in transfected Xenopus oocytes. As discussed above, working with live cells limits the range over which exterior concentrations can be varied, and the interior ion concentrations are usually unknown. The fact that we could obtain parameter estimates for NKCC2 isoform models suggests that data from 86Rb+ uptake studies in transfected oocytes, although not ideal, are sufficient for our purpose, which is to obtain kinetic models that predict NKCC2 uptake in TAL cell models. However, it would be advantageous to have additional data available, such as specific assessments of K+/K+ and Na+/Na+ exchange. Such data would provide additional constraints and, hence, yield firmer, and perhaps unique, estimates of values of the model parameters. Until more data become available, we think that the parameter sets listed in Table 6 may be preferable for use in TAL cell models, because the parameter estimates are based on the broad array of data analyzed by Benjamin and Johnson (2) as well as the NKCC2 isoform specific data obtained by Plata et al. (13).
We used our optimization algorithm and the NKCC2 model to verify that changes in the binding affinities of Cl−, Na+, and K+ alone are sufficient to account for the known differences in ion uptake kinetics between the three isoforms. This is consistent with the conclusions of Giménez and Forbush (7) that the sequence differences between splice variants primarily affect ion binding affinities locally near the binding sites, rather than indirectly through differences in protein conformation or translocation parameters. Their conclusions were based on measurements of Km and Vmax for the mutant proteins. As noted by the authors, these observable characteristics are, in general, influenced by all of the molecular events involved in the transport process, as well as on the experimental conditions.
The motivation for this study arose from our interest in developing models of ion transport in TAL cells, as well as a larger scale model of the entire TAL segment. NKCC2 isoform models are essential elements in TAL cell models, and such models will facilitate the analysis of a number of intriguing questions concerning regulation of NKCC2, TAL cell, and segment function. Of particular interest to us is recent evidence that NKCC2 activity, and hence, TAL cell Na+ transport, is regulated by Cl−-sensitive WNK3 kinase (14) and by the metabolic sensor AMP-activated protein kinase (5). This implies the potential existence of intracellular autoregulatory pathways that restrain NKCC2-mediated Na+ uptake to rates where cytosolic Cl− concentration, and hence, cell volume, are stabilized and cellular metabolic stress is minimized. Further elucidation of such autonomous regulation of TAL cell function promises to provide fundamental insight into the operations of and the interactions among the urine concentrating mechanism, the tubuloglomerular feedback system, and renal sodium excretion.
GRANTS
This research was supported in part by National Institutes of Health Grants S06 GM08102 and SC1 GM084744 to the Minority Biomedical Research Support for Continuous Research Excellence program at the University of Puerto Rico and by a subcontract to NIH Grant DK-042091.
Supplementary Material
APPENDIX
Model Equations
Our model of the NKCC2 cotransporter assumes that the reaction cycle is in a steady state and consists of a linear system of algebraic equations. The linear equations are derived from a more general system of differential equations, as follows:
 |
(6) |
 |
(7) |
 |
(8) |
 |
(9) |
 |
(10) |
 |
(11) |
 |
(12) |
 |
(13) |
 |
(14) |
 |
(15) |
where C is the solute concentration of ion j in the intracellular (l = i) or extracellular (l = e) space; Ej = Ej(t) is the cotransporter density of state j; kj is the release rate constant (j = 1, 2, 3, 4); and kon is the binding rate constant, assumed equal for all ionic bindings (ion binding and release rate constants are assumed the same on either side of the membrane, except for some simulations where the K+ release rate constant differed between the luminal and cytosolic sides); kff and kbf are the forward and reverse translocation rates for loaded transporter; and kfe and kbe are the forward and reverse translocation rates for empty transporter.
Adding Eqs. 6–15 and noting that the derivative of the sum of the Ej(t) values is equal to zero, implies Eq. 16, where ET is a constant
 |
(16) |
Moreover, from Eq. 16, one obtains
 |
(17) |
which makes Eq. 15 redundant. By replacing E9 in Eqs. 6–14 with the expression in Eq. 17, the ordinary differential equation system reduces to a system of nine equations in nine unknowns. In the steady state, all of the derivatives in Eqs. 6–14 are zero, and the model reduces to a system of linear equations.
86Rb+ Unidirectional Influx
The unidirectional influx of 86Rb+ corresponds to the unidirectional transport between transporter states 2 and 8 (see Fig. 1). The forward and reverse reaction velocities are given below; the subscripts indicate the pair of states represented, and the order indicates the direction (i.e., J23 is the forward flux between states 2 and 3, and J32 is the reverse reaction).
 |
(18) |
 |
(19) |
 |
(20) |
 |
(21) |
 |
(22) |
 |
(23) |
 |
(24) |
 |
(25) |
 |
(26) |
 |
(27) |
 |
(28) |
Consider the three reactions from the cotransporter density state 2 to state 4 in Fig. 1. The unidirectional flux from state 2 to state 4 (J24) is equal to the flux from state 2 to state 3 (J23) multiplied by the probability that state 3 proceeds to state 4 instead of returning to state 2 [J34/(J34 + J32)], i.e.,
 |
(29) |
Similarly, the unidirectional flux from the cotransporter density state 4 to state 2 is given by
 |
(30) |
In general, the unidirectional fluxes from the cotransporter density state 2 to state i (i = 4,5, 6, 7, 8) are computed using the following recursive formulas:
 |
(31) |
and
 |
(32) |
The unidirectional flux corresponding to 86Rb+ uptake is
 |
(33) |
Each entry of the vector of model unidirectional fluxes, JM(p) in Eq. 4, consists of the value of J28 for each ion at each concentration value, and p is the vector of variable parameters.
The costs of publication of this article were defrayed in part by the payment of page charges. The article must therefore be hereby marked “advertisement” in accordance with 18 U.S.C. Section 1734 solely to indicate this fact.
REFERENCES
- 1.Alberty RA Physical Chemistry. New York: Wiley, 1987.
- 2.Benjamin BA, Johnson EA. A quantitative description of the Na-K-2Cl cotransporter and its conformity to experimental data. Am J Physiol Renal Physiol 273: F473–F482, 1997. [DOI] [PubMed] [Google Scholar]
- 3.Chang H, Fujita T. A kinetic model of the thiazide-sensitive Na-Cl cotransporter. Am J Physiol Renal Physiol 276: F952–F959, 1999. [DOI] [PubMed] [Google Scholar]
- 4.Coleman TF, Li Y. An interior, trust region approach for nonlinear minimization subject to bounds. SIAM J Opt 6: 418–445, 1996. [Google Scholar]
- 5.Fraser SA, Giménez I, Cook N, Jennings I, Katerelos M, Katsis F, Levidiotis V, Kemp BE, Power DA. Regulation of the renal-specific Na+-K+-2Cl− co-transporter NKCC2 by AMP-activated protein kinase (AMPK). Biochem J 405: 85–93, 2007. [DOI] [PMC free article] [PubMed] [Google Scholar]
- 6.Gagnon E, Forbush B, Caron L, Isenring P. Functional comparison of renal Na-K-Cl cotransporters between distant species. Am J Physiol Cell Physiol 284: C365–C370, 2003. [DOI] [PubMed] [Google Scholar]
- 7.Giménez I, Forbush B. The residues determining differences in ion affinities among the alternative splice variants F, A, and B of the mammalian renal Na-K-Cl cotransporter (NKCC2). J Biol Chem 282: 6540–6547, 2007. [DOI] [PubMed] [Google Scholar]
- 8.Giménez I, Isenring P, Forbush B. Spatially distributed alternative splice variants of the renal Na-K-Cl cotransporter exhibit dramatically different affinities for the transported ions. J Biol Chem 277: 8767–8770, 2002. [DOI] [PubMed] [Google Scholar]
- 9.Haas M The Na-K-Cl cotransporters. Am J Physiol Cell Physiol 267: C869–C885, 1994. [DOI] [PubMed] [Google Scholar]
- 10.Lytle C, McManus TJ. A minimal kinetic model of (Na + K + 2Cl) cotransport with ordered binding and glide symmetry. J Gen Physiol 88: 36a, 1986. [DOI] [PubMed] [Google Scholar]
- 11.Lytle C, McManus TJ, Haas M. A model of Na-K-2Cl cotransport based on ordered ion binding and glide symmetry. Am J Physiol Cell Physiol 274: C299–C309, 1998. [DOI] [PubMed] [Google Scholar]
- 12.Moré JJ, Sorensen DC. Computing a trust region step. SIAM J Sci Stat Comput 3: 553–572, 1983. [Google Scholar]
- 13.Plata C, Meade P, Vázquez N, Hebert SC, Gamba G. Functional properties of the apical Na+-K+-2Cl− cotransporter isoforms. J Biol Chem 277: 11004–11012, 2002. [DOI] [PubMed] [Google Scholar]
- 14.Rinehart J, Kahle KT, de Los Heros P, Vazquez N, Meade P, Wilson FH, Hebert SC, Gimenez I, Gamba G, Lifton RP. WNK3 kinase is a positive regulator of NKCC2 and NCC, renal cation-Cl− cotransporters required for normal blood pressure homeostasis. Proc Natl Acad Sci USA 102: 16777–16782, 2005. [DOI] [PMC free article] [PubMed] [Google Scholar]
- 15.Russell JM Sodium-potassium-chloride cotransport. Physiol Rev 80: 211–276, 2000. [DOI] [PubMed] [Google Scholar]
- 16.Weinstein AM A mathematical model of rat distal convoluted tubule. I. Cotransporter function in early DCT. Am J Physiol Renal Physiol 289: F699–F720, 2005. [DOI] [PubMed] [Google Scholar]
- 17.Zar JH Biostatistical Analysis. Englewood Cliffs, NJ: Prentice-Hall, 1999.
Associated Data
This section collects any data citations, data availability statements, or supplementary materials included in this article.


