Abstract
The inflammatory bowel diseases (Crohn's disease; ulcerative colitis) are idiopathic chronic inflammatory disorders of the intestine and/or colon. A major advancement in our understanding of the pathogenesis of these diseases has been the development of mouse models of chronic gut inflammation. One model that has been instrumental in delineating the immunological mechanisms responsible for the induction as well as regulation of intestinal inflammation is the T cell transfer model of chronic colitis. This paper presents a detailed protocol describing the methods used to induce chronic colitis in mice. Special attention is given to the immunological concepts that explain disease pathogenesis in this model, considerations and potential pitfalls in using this model, and finally different “tricks” that we have learned over the past 12 years that have allowed us to develop a more simplified version of this model of experimental IBD.
Keywords: adaptive immune system, T cell trafficking, inflammation, inflammatory bowel disease, cytokines, IL-10-deficient mice
the inflammatory bowel diseases (IBD; Crohn's disease; ulcerative colitis) are idiopathic chronic inflammatory disorders of the intestine and/or colon, in which patients suffer from rectal bleeding, severe diarrhea, abdominal pain, fever, and weight loss (5, 25, 26). Histopathological inspection of biopsies obtained from patients with active disease reveals the presence of a large inflammatory cell infiltrate coincident with extensive mucosal and transmural injury including edema, loss of goblet cells, decreased mucous production, crypt cell hyperplasia, erosions, and ulcerations. A major limitation in understanding the pathogenetic mechanisms responsible for the induction and perpetuation of these chronic inflammatory disorders has been the availability of animal models that recapitulate the human diseases. Over the past 15 years a number of different rodent models have been developed that have greatly advanced our understanding of disease pathogenesis. Currently, there are least 25–30 different mouse and rat models of intestinal inflammation that may be grouped into three major categories according to the nature of the inflammation and method of the induction of the disease (4). These include the erosive, self-limiting models of colitis; spontaneous models of chronic colonic (and/or small bowel) inflammation induced by targeted gene deletion; and models of chronic colitis and intestinal inflammation induced by disruption of T cell homeostasis. Although no single animal model completely recapitulates the clinical and histopathological characteristics of human IBD, data obtained from a number of different studies using the various rodent models have revealed three basic underlying principles and recurring themes (4, 25). First, chronic gut inflammation is largely mediated by T lymphocytes (T cells). Second, commensal enteric bacteria are required to initiate and perpetuate intestinal and/or colonic inflammation. Finally, the genetic background of the animal represents an important modulator/modifier of disease onset and severity. Indeed, data obtained from a number of different experimental studies suggest that chronic gut inflammation results from a dysregulated immune response to components of the normal gut flora. Thus it is reasonable to suggest that T cell-dependent models of IBD are significantly more relevant to human disease than are the erosive, self-limiting models of acute colitis if one wishes to investigate the immunological mechanisms responsible for the induction, perpetuation, and/or regulation of the chronic disease.
Of the many spontaneous models of chronic colitis that have been developed, only a small number of these models have been used by sufficient numbers of investigators to yield detailed information on the penetrance, severity, and reproducibility of the gut inflammation. By far the most widely used of the gene-targeted models of spontaneous colitis is the IL-10-deficient (IL-10−/−) mouse. Mice with targeted disruption (i.e., deletion) of the IL-10 gene develop spontaneous pancolitis and cecal inflammation by 2–4 mo of age (1). Histopathological inspection of colons obtained from mice with active disease show many of the same characteristics as those observed in human IBD. As with virtually all mouse models of chronic colitis, T cells play an important role in disease pathogenesis. In addition, genetic background of the mouse is a major modifier of disease with disease penetrance and severity occurring to a much greater extent in 129SvEv IL-10−/− than in C57Bl/6 or Balb/c IL-10−/− animals. The advantages of using the IL-10−/− model is that it is a well-established Th1-mediated model of transmural colitis, which can be treated with various immunological agents (anti-TNF-α, anti-IFN-γ antibodies), antibiotics, and probiotics. However, onset and severity of disease are variable and in some cases disease requires many months to develop. Furthermore, we have found that continuous brother-sister mating (inbreeding) of these mice (129SvEv IL-10−/−) to maintain adequate numbers of animals results in a significant reduction in the penetrance and severity of disease over the course of a 2-yr period.
Because of these observations, coupled to the desire to more precisely “synchronize” the onset and severity of disease, the T cell transfer model of chronic colitis has become more widely used over the past 3–4 years by a number of different investigators from around the world. This is the prototypical and best-characterized model of chronic colitis induced by disruption of T cell homeostasis. Adaptive transfer of CD4+CD45RBhigh T cells (naive T cells) from healthy wild-type (WT) mice into syngeneic recipients that lack T and B cells induces a pancolitis and small bowel inflammation at 5–8 wk following T cell transfer (20, 22). Histopathological inspection of distal colon obtained from mice with active disease reveals transmural inflammation, epithelial cell hyperplasia, polymorphonuclear leukocyte (PMN) and mononuclear leukocyte infiltration, crypt abscesses, and epithelial cell erosions. Depending on the strain of the donor and recipient, reconstituted mice exhibit varying degrees of weight loss and diarrhea and loose stools. The major advantages of this model are that one can examine the very earliest immunological events associated with the induction of gut inflammation as well as the perpetuation of disease. Like the IL-10−/− model, the T cell transfer model is responsive to a variety of different immunological and antibiotic treatment protocols. Although the original reports describing this model suggested that the inflammation was confined exclusively to the colon, more recent data demonstrated that the transfer of naive T cells into recombinase activating gene-1-deficient (RAG−/−) mice induces both colitis and small bowel inflammation, making this a model similar to Crohn's disease (12, 18). Finally, this model is ideal to study the role that regulatory T cells (Tregs) play in suppressing or limiting the onset and/or perpetuation of intestinal and colonic inflammation. Therefore, the objective of this communication is to provide a detailed protocol describing the procedures and methods used to induce chronic gut inflammation in mice.
MATERIALS
Equipment
Refrigerated swinging bucket centrifuge.
Platform rocker.
Magnet (Dynal).
Top-loading balance with capability to weigh live animals.
Animals and Reagents
C57BL/6 WT mice of either sex are used for donors.
Immunodeficient RAG−/− mice (males) on C57BL/6 background used for recipients (Jackson Laboratories, Bar Harbor MN). Important: Male or female donor WT mice can be transferred into male RAG knockout recipients. If female RAG−/− recipients are to be used then only female WT donors may be used.
100-mm petri dish (Falcon).
10-ml syringe.
26G3/8 needles.
70-μm nylon cell strainer (BD Falcon cat. no. 352350).
Glass microslides, single frosted (Corning cat. no. 2948).
15-ml and 50-ml polypropylene conical tubes.
Injection tubes: disposable/sterile polypropylene 5-ml tubes with caps (Labcon North America; cat. no. 3811-345-008).
12 × 75-mm 5-ml polystyrene round-bottom flow tubes (BD Falcon).
FACS buffer: 1× PBS (without Ca2+/Mg2+) supplemented with 4% fetal calf serum.
Dynal buffer: 1× PBS (without Ca2+/Mg2+) supplemented with 2 mM EDTA and 0.1% bovine serum albumin.
ACT hypotonic buffer for erythrocyte lysis: 0.15 M NH4Cl in 0.02 M Trizma base in deionized water; pH to 7.2.
Trypan blue solution: 0.4% Trypan blue in 1× PBS.
Dynal Mouse CD4 Negative Isolation Kit (Invitrogen, Carlsbad, CA).
Fluorescently labeled antibodies from commercial sources (BD Biosciences or eBiosciences), such as CD45RB-FITC and CD4-APC (see notes). Important: These antibodies should be carefully titrated on mouse splenocytes prior to the experiment to ensure optimal staining.
Reagent Setup
Prepare all buffers and solutions in advance.
Prepare fluorescently labeled single-color control antibodies by diluting antibodies in FACS buffer to obtain previously determined optimal titer.
Prepare all buffers as described in the Dynal Mouse CD4 Negative Isolation Kit protocol provided on the company web site.
METHODS
Enrichment for CD4 ± T cells
Euthanize donor WT mice by an approved method.
Remove spleens and place them into a petri dish (on ice) containing 10–15 ml of FACS buffer.
Wet two glass slides with FACS buffer and tease each spleen apart by rubbing the spleen between the frosted ends of the glass slides until only connective tissue remains. Continue until no large pieces of tissue remain in the buffer.
Using a 10-ml syringe (no needle), withdraw the cell suspension from the petri dish into the syringe and then gently expel the suspension out of the syringe with a 26-gauge needle attached and into a 50-ml conical placed on ice. If the cell debris plugs the needle, carefully replace it with a new one and continue.
Rinse the petri dish with an additional 10 ml of FACS buffer, aspirate into a 10-ml syringe without the needle, and repeat step 4 with the needle on. Continue washing until the 50-ml conical tube is full.
Pellet cells by centrifugation at 400 g for 10 min at 4°C.
Aspirate and discard most of the supernatant (SN) leaving a residual 2–3 ml covering the cell pellet. Gently disrupt the cell pellet with a stream of FACS buffer using a T1000 or T5000 pipette.
- Count cells by the following method:
- Add 20 μl of cell suspension from step 7 to 80 μl of ACT hypotonic lysis buffer (thus making a 1:5 dilution) in a 0.5-ml Eppendorf microfuge tube, gently mix, and leave for 5 min at room temperature to lyse the red blood cells (RBCs). Important: The RBC lysis step is required for accurate determination of leukocyte numbers that will be used for the subsequent steps.
- Vortex and transfer 10 μl of lysed cells into a new 0.5-ml Eppendorf microfuge tube containing 90 μl of Trypan blue solution (with dilution in the previous step this will result in a final dilution of 1:50). Mix cells gently and count viable cells using a hemocytometer. Calculate total number of cells.
- To the cells remaining in ACT buffer add 400 μl of FACS buffer and pellet by centrifugation. Aspirate and discard SN and resuspend cells in 200–300 μl of FACS buffer. Pass these cells through the 70-μm cell strainer to get rid of large clumps. Keep cells on ice and save them for single-color staining (step 19).
Transfer aliquots of cells remaining in the 50-ml conical tube from step 7 into additional 50-ml conical tubes such that the cell number does not exceed a maximum of 25 × 107 per 50-ml tube.
10. Use the Dynal Mouse CD4 Negative isolation kit protocol exactly as written to enrich for CD4+ cells. Important: Perform all incubations on a rocking platform with gentle tilting to ensure uniform coating of cells with antibodies or magnetic beads.
NOTE: Although the protocol described here uses the Dynal CD4+ negative enrichment kit to enrich for CD4+ T cells, any comparable method for CD4+ T cell enrichment can be used.
11. Following the negative selection protocol, CD4+ cells will remain in the SN and unwanted cells bound to the magnetic beads will accumulate on the sides of the tube. With the 50-ml tube still in the magnet, tilt the assembly and carefully decant or pipette out the SN into a new 50-ml conical tube on ice.
12. Pellet cells by centrifugation at 400 g at 4°C for 10 min.
13. Aspirate and discard most of the SN, leaving a residual volume of 300–500 μl. Resuspend the cell pellet by carefully pipetting up and down several times using a T1000 pipette. Pool cells from all 50-ml tubes containing negative fractions enriched for CD4+ cells into a single 15-ml tube. Wash each 50-ml tube with additional FACS buffer to ensure quantitative transfer of all cells.
14. Pellet cells in the 15-ml tube by centrifugation. Aspirate and discard SN. Resuspend the cell pellet in 1 ml of FACS buffer by gentle repetitive pipetting. Important: If debris or clumps are visible then the cell suspension should be passed cells through a 70-μm cell strainer.
15. Add 10 μl of cell suspension to 90 μl of Trypan blue solution (1:10 dilution) and count cells using a hemocytometer.
Fluorescently Labeling the CD4+ T Cells for Cell Sorting
16. Prepare antibody cocktail containing pretitrated anti-CD4-APC and anti-CD45RB-FITC antibodies diluted to optimal concentration. As a general rule we use 1 ml of antibody cocktail in FACS buffer for every 5 × 10⁷ cells. Important: When calculating total volume of antibody cocktail needed to prepare don't forget to subtract volume of the buffer in which cells are suspended.
17. To prepare the staining cocktail add appropriate amount of antibodies to 1.5-ml Eppendorf microfuge tube (or a larger tube to accommodate greater volumes) and fill to 1 ml with FACS buffer. Vortex well and add the remainder of the calculated volume (minus the residual volume for your cell suspension) before combining antibody cocktail with the cells in 15-ml tube. Cap and gently invert it to ensure proper mixing.
18. Incubate on a rocking platform with gentle tilting for 15 min at 4°C.
19. While the cells are incubating, start preparing a 96-well staining plate. Steps a–h described below do not have to be carried out completely before proceeding to step 20, but, rather, worked in between those steps to ensure that both cells for the sorting and cells for single-color controls are ready in approximately the same time.
Take cells from step 8c and transfer equal aliquots into wells of the 96-well round-bottom plate that correspond to single-color control staining.
Fill to 200 μl with FACS buffer using a multichannel pipette and pellet cells by centrifugation at 300 g for 3 min at 4°C using a precooled plate centrifuge.
Using a 21-gauge needle attached to the vacuum line (bevel down), aspirate and discard SN, add 100 μl of Fc receptor block (anti-CD16/32, to prevent nonspecific binding of the antibodies), mix by pipetting several times up and down, and incubate on a rocking platform at 4°C for 15 min.
Wash by filling each well to 200 μl with FACS buffer using a multichannel pipette and pellet cells by centrifugation as described above.
Aspirate and discard SN. Add 100 μl of appropriate antibodies diluted in FACS buffer to wells corresponding with single-color controls. Resuspend well to unstained control (it will receive anti-FcR antibodies) in 100 μl of FACS buffer. Mix by pipetting several times up and down and incubate on a rocking platform at 4°C for 15 min.
Wash as described above.
Aspirate and discard SN. Perform an additional washing step as described above.
Aspirate and discard SN. Resuspend cells in 200 μl of FACS buffer and transfer into 12 × 75-mm flow tubes containing 150–200 μl of FACS buffer. Label tubes and prepare a separate staining sheet describing the content of the tubes. Cap the tubes and place on ice.
20. Following incubation with antibody cocktail, fill the 15-ml tube from step 18 with FACS buffer and pellet cells by centrifugation as described in step 6 to wash cells.
21. Aspirate and discard SN. Resuspend the cells in FACS buffer to obtain concentration of 25–50 × 106 cells/ml. It should be noted that the concentration of cells is dependent on the specific cell sorter to be used. Important: If debris or clumps are visible it is necessary to pass cells through a 70-μm cell strainer prior to cell sorting. Failure to do so will cause plugging of the cell sorter. In addition, cells must be protected from light by covering the tube with foil and placed on ice prior to sorting.
Cell Sorting for Purification of CD4+CD45RBhigh Cells
22. Flow cytometry:
The following general description of the flow cytometric analysis and cell sorting of CD45RBhigh and CD45RBlow populations is meant as a guide for investigators as well as to provide key information for an experienced flow cytometry operator to reproduce our procedure.
A sample of unstained cells is used to establish baseline autofluorescence of the cells and for forward scatter (FSC) vs. side scatter (SSC) gating of the lymphoid cells. We routinely employ further gating on SSC height vs. SSC width and FSC height vs. FSC width to discriminate singlet cells.
Single-color controls are generally used for establishing appropriate levels of compensation to apply for each fluorochrome. Note that with the fluorochromes used here (FITC and APC) no compensation is usually required.
A single-parameter histogram (gated on singlet lymphoid cells based on FSC vs. SSC) is used to gate the CD4 (APC)-positive singlet cells.
A second single-parameter histogram, gated on CD4-positive singlet cells, is collected to establish sort gates. The CD45RBhigh population is identified as the 40% of cells exhibiting the brightest CD45RB staining. The CD45RBlow cells are defined as the 15% of cells with the dimmest CD45RB expression. Each of these is sorted individually.
A small aliquot of each sorted cell population is routinely analyzed after sorting to determine the purity of the sort. Sorts of >99% purity should be expected from sorting cells based on these criteria.
Troubleshooting
Low yield of CD45RBhigh or CD45RBlow cells.
Possible cause: Not enough spleens were used as donors or the donors are very young. Generally 8–10 spleens from 8- to 10-wk-old mice are sufficient to get anywhere from 5 to 8 million CD4+CD45RBhigh cells, which is enough to reconstitute 10–15 recipient RAG−/− mice with 0.5 × 10⁶ cells per mouse.
Cell viability low.
Possible cause: Cells were not kept on ice (unless specifically indicated by the protocol); harsh pipetting or vortexing of cells. Keep the tube with cells on ice at all times possible, such as when transferring to and from the centrifuge, cold room, etc. Whenever a protocol calls for resuspension of the pellet, this should be done by very gentle pipetting to avoid as much cell agitation as possible, and absolutely not by vortexing.
Cell yield and viability is also influenced by the experience of the investigator performing the isolation and the total time it takes to complete the entire procedure. As one becomes more comfortable with the technique, greater cell yield will inevitably result.
Injection of RAG−/− Mice With Flow-Purified CD4+ CD45RBhigh T Cells
23. After sorting, fill the collection tubes containing sorted cells with FACS buffer and pellet by centrifugation as described above.
24. Aspirate and discard SN. Resuspend sorted cells in the residual volume (∼500 μl) of 1× PBS. Important: Resuspend cells very gently using a 1,000-μl pipette by carefully pipetting up and down to break the cell pellet. Transfer cells into an injection tube (maximum of 5 × 10⁶ cells per tube) and dilute with cold 1× PBS for a final cell concentration of 1 × 10⁶/ml. Keep injection tubes on ice prior to injection.
25. Weigh recipient mice using a top-loading balance and record the weight. Prior to the injection of the mice gently invert the tube (s) from step 24 several times to mix cells. Very slowly draw 0.5 ml (0.5 × 10⁶ cells) into 1-ml syringe with the 26G3/8 needle attached. Holding the mouse by the back of the neck with thumb and index finger, secure it using one hand and push gently with the fourth and third fingers to slightly stretch its abdomen. Ear notch mice using a hole punch or other preferred method. Slowly inject the cells [intraperitoneally (ip)] into recipient mice.
Important: When performing ip injections, ensure that the needle is inserted all the way into the peritoneal cavity. Failure to do so may result in cells being injected subcutaneously, which will not induce disease.
Monitoring Disease Progression and Assessment of Colitis
26. Monitor disease progression by weighing each mouse weekly using a top-loading balance. Make sure that the function of the balance is set to measure live animals (this function averages weight of the moving animal over a period of time). Typically we see modest weight increases over the first 3 wk followed by slow but progressive weight loss over the next 4–5 wk, accompanied by appearance of loose stools and diarrhea as well as a “hunched-over” appearance.
27. Starting at week 4-5, recipient mice will start developing signs of disease and may need to be weighed twice per week.
NOTE: It has been our experience that ∼10–20% do not develop significant weight loss and/or loose stools and diarrhea. However, we find that these mice may still develop significant intestinal inflammation, which will be visible upon necropsy and macroscopic evaluation.
28. When mice lose ∼15–20% of their original body weight or at 8 wk postinjection, the animals should be euthanized and assessed for macroscopic evidence of colitis.
Apply 70% ethanol on the abdomen to wet the fur.
Using small surgical scissors open the abdomen.
Move the internal organs to one side then and then cut the pelvic girdle (bones) and the muscles around the anus.
Carefully excise the entire colon starting from the anus by holding one end with forceps and cutting it free of the mesentery using scissors from below the cecum to just above the anal opening. Care must be taken to prevent stretching of the colon.
Place the colon on a plastic board, measure and record its length, and clean it of fecal material. To do this, cut the colon in half and then gently roll a cotton swab along its length, squeezing fecal pellets out of the colon and taking care not to stretch or damage the tissue. Weigh the colonic tissue.
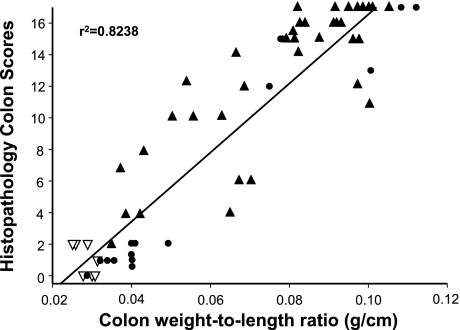
NOTE: Colonic length and weight may be recorded to calculate length-to-weight ratio, which we have found to correlate well with blinded histopathological scores (Fig. 5). In addition, gross scores can be assigned to the colons by the following criteria: normal colonic morphology thickness and opacity receives a score of 0; mild bowel wall thickening in the absence of visible hyperemia receives a score of 1; moderate bowel wall thickening and hyperemia receives a score of 2; severe bowel wall thickening with rigidity and marked hyperemia receives a score of 3; and severe bowel wall thickening with rigidity, hyperemia, and colonic adhesions receives a score of 4.
This model produces a pancolitis, i.e., colonic inflammation equally affecting the entire colon. However, for histological processing and blinded histopathological scoring we obtain a small (0.5 cm) piece from proximal and distal portions of the colon. These pieces of tissue are then placed in 10% PBS-formalin and allowed to fix for at least 24 h at room temperature prior to paraffin embedding.
29. Embed fixed tissue into paraffin blocks using standard histological techniques. Section the paraffin-embedded samples in a cross-sectional manner to produce 5-μm sections. Mount three to four sections on a glass slide, stain the sections with hematoxylin and eosin, and then coverslip the samples.
30. Perform blinded histopathological analysis using the following scoring criteria (modified from Refs. 18 and 19): 1) degree of inflammation in lamina propria (score 0–3); 2) goblet cell loss (score 0–2); 3) abnormal crypts (score 0–3); 4) presence of crypt abscesses (score 0–1); 5) mucosal erosion and ulceration (score 0–1); 6) submucosal spread to transmural involvement (score 0–3); 7) number of neutrophils counted at ×40 magnification (score 0–4). Total histopathological score is calculated by combining the scores for each of the seven parameters for a maximum score of 17.
Important: Histological scoring should be done by an experienced pathologist in a blinded fashion, e.g., each sample should be assigned a number without revealing the identity of the sample or the treatment.
Troubleshooting: Majority of Reconstituted Mice Develop Little or No Disease
Possible causes:
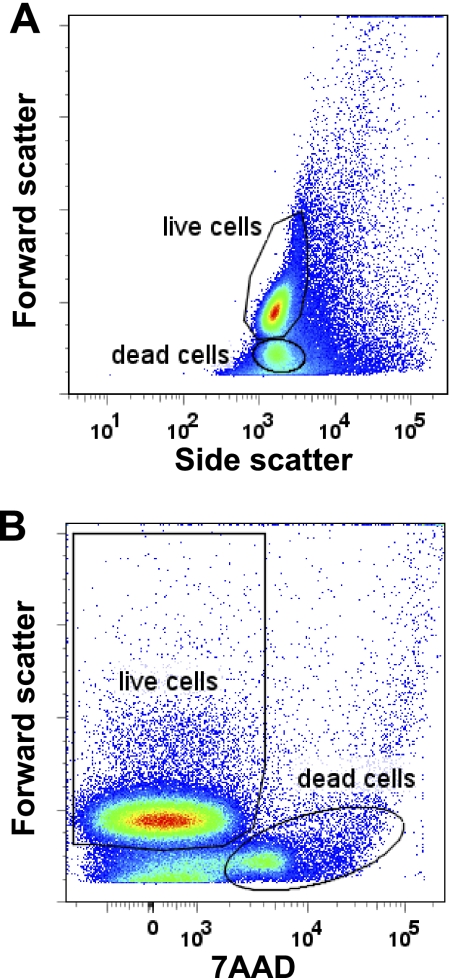
CD4+CD45RBhigh T cells injected with low cell viability or cells did not reconstitute recipients (poor ip injection technique). Performing postsort analysis on the sorted cells is critical to evaluate the viability and purity of the cells. Greater than 90% of the cells should fall within the “viable” or “live” cell gate as determined with the help of someone with experience in running a flow cytometer. Viability of the cells can be easily assessed by analyzing SSC vs. FSC plot (see Fig. 1A). As cells die they shrink, thus FSC decreases (decrease in size). Cells in the top region of Fig. 1A are live or viable cells, cells in the bottom region are dead or dying cells. In addition, viability of the cells can be assessed using fluorescent nucleic dyes that are taken up by dead or dying cells, such as 7-amino-actinomycin D (7AAD) (or propidium iodide). To do this, an aliquot of cells is stained with the dye and is analyzed by flow cytometry to determine regions of live and “dead” cells. As can be seen in Fig. 1B, cells with the lower FSC properties are those stained with 7AAD and thus should be excluded from the sort.
We have found over the past 12–14 years that penetrance of disease is ∼85–90%. The reasons for the lack of disease in the 10–15% of injected mice has not been identified; however, we suspect that faulty ip injection technique may account for some of the variability. Indeed, the few “nonresponders” may be checked for T cell reconstitution by analyzing the spleen for CD4+ T cells. If comparable to other mice with disease, then this mouse should not be excluded from analysis. However, if few or no T cells are found in the spleen then this mouse can be excluded from the group prior to analysis as nonresponder.
Another critical point is identification of naive T cells and the minimal number of T cells that can be injected to reliably induce colitis. CD45RBhigh cells are defined as 40% brightest of CD45RB-expressing cells. This population contains mainly naive T cells with >90% are CD25−, about 80% are CD62L+ and slightly more than 10% are CCR7+. In recent years some investigators further subdivide CD4+CD45RBhigh cells into CD25− and CD62L+ cells to ensure transfer of maximal number of naive CD4+ T cells (10, 16). We have found that although sorted CD4+CD25− T cells induce disease, it also introduces more variability in the severity of colitis compared with reconstitution with CD4+CD45RBhigh T cells.
Fig. 1.
Discrimination of live and dead cells by forward scatter (FSC), side scatter (SSC), and 7-amino-actinomycin D (7AAD). A: analysis of splenocytes (erythrocyte free) using FSC and SSC. Upper population denoted as “live cells” represent viable splenocytes. Bottom population denoted as “dead cells” represent nonviable cells, which should be excluded from the sorting gate when preparing to sort for CD4+CD45RBhigh/low cells. B: viability of the cells can also be assessed by staining with 7AAD. In this graph only nonviable cells stain with 7AAD. Data were acquired by using a BD LSR II flow cytometer and analyzed with FlowJo software (ver. 7.2.2 for PC).
Important: Development of gut inflammation in this model is critically dependent on intact intestinal flora (25). Thus all mice should receive tap water that has not been acidified or had any antibiotic addition. We have also avoided the use of autoclaved bedding and food, i.e., a conventional animal housing environment.
ANTICIPATED RESULTS AND DISCUSSION
The entire procedure of cell isolation, enrichment, and labeling cells with antibodies requires ∼3.5–4 h. Depending on the FACS machine used for cell sorting, the entire process for sorting the cells by an experienced investigator requires 2–3 h including postsort analysis. Injection of the sorted CD4+CD45RBhigh T cells into 10 recipient lymphopenic mice will require an additional 1–1.5 h. It has been our experience that chronic colitis will develop within 5–10 wk following T cell transfer depending on the strain and type of lymphopenic recipient selected. Colonic inflammation develops as a result of enteric antigen-driven activation, polarization, and homeostatic expansion of the naive (CD4+CD45RBhigh) T cells to produce colitogenic effector cells such as Th1 and/or Th17 cells (4, 6, 20). Because this only occurs in the absence of CD4+CD25+Foxp3+ Tregs, virtually any T cell-deficient recipient (e.g., RAG−/−, SCID, CD3−/−, TCRα−/− × TCRβ−/−) can be used. We have found that Balb/c SCID mice develop a more rapid and severe form of colitis than do the C57Bl/6 RAG-1−/− mice. In addition, we have observed that the presence of B cells in T cell-deficient recipients will slow modestly the onset of colitis, supporting the concept that B cells may represent an important regulatory cell in mice (13, 14, 18).
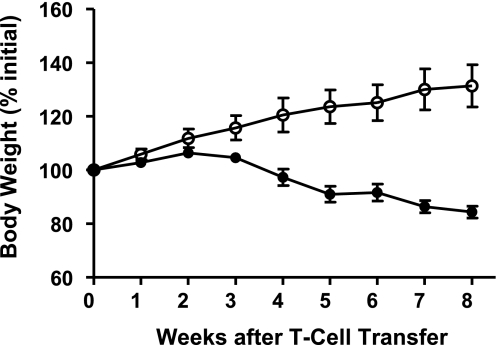
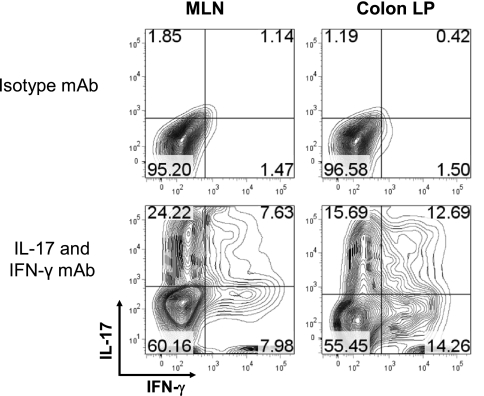
The standard protocol that we have used over the past 12–14 years requires the transfer (ip) of 0.5 × 10⁶ donor T cells to each immunodeficient recipient. We have found that this number of donor T cells provides the most consistent colitis within 6–8 wk in most strains of mice. The development of disease may be monitored over the 6- to 8-wk period by evaluating the presence or absence of what has been termed the “wasting syndrome,” which is characterized by diarrhea or loose stools, piloerection, reduced physical activity, and loss of body weight. It is not uncommon for mice to lose >15% of their initial body weight by 6–8 wk posttransfer (Fig. 2). Although it is reasonable to assume that the weight loss is due to the physiological problems resulting from the development of severe colitis, the generation of disease-producing T helper cell 1 (Th1 and Th17) effector cells occurs in many different tissues as well as the colon (Fig. 6) (20, 22). Thus inflammatory tissue damage and dysfunction may occur in the small intestine, liver, stomach, and possibly other organ systems (18, 20). In reality, it may be the systemic production of Th1 and Th17 effector cells in the small bowel as well as the colon that contributes significantly to the wasting syndrome observed in this model. One aspect of virtually all mouse models of chronic colitis is the lack of substantial amounts of occult blood in the feces of diseased mice. This may relate to the fact that frank ulcerations are uncommon in most mouse models of colitis. The reasons for this difference from human disease are not known at the present time but are worthy of investigation.
Fig. 2.
Body weight following adoptive transfer of CD4+CD45RBhigh or CD4+CD45RBlow T cells from wild-type donors into RAG−/− recipients. CD4+CD45RBhigh (•) or CD4+CD45RBlow T cells (○; 0.5 × 10⁶ cells of each) were injected [intraperitoneally (ip)] into RAG−/− mice to induce chronic colitis. Note the gradual loss of body weight beginning at week 4 for the mice reconstituted with CD4+CD45RBhigh T cells. Data derived from Ref. 18.
Fig. 6.
Intracellular staining for interleukin-17 (IL-17) and interferon-γ (IFN-γ) in T cells obtained from the mesenteric lymph nodes (MLNs) and colonic lamina propria (colon LP) of RAG−/− mice reconstituted with CD4+CD45RBhigh T cells at 8 wk posttransfer. Mononuclear cells were prepared from MLN and colon LP as previously described (17, 18). Cells were cultured for 16 h in a CD3-coated 24-well plate with soluble CD28 (1 μg/ml final) in complete RPMI-1640 medium. GolgiStop was added for the last 6 h. Cells were harvested, stained with anti-CD4, permeabilized by use of the BD cytofix/cytoperm kit and stained with isotype control monoclonal antibody (mAb) or IL-17 and IFN-γ mAbs. Contour plots are shown gated on CD4+ cells. Data were acquired by BD LSR II flow cytometer and analyzed using FlowJo software (ver. 7.2.2 for PC).
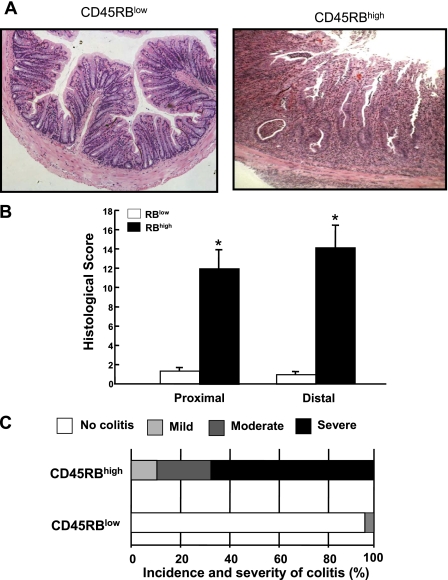
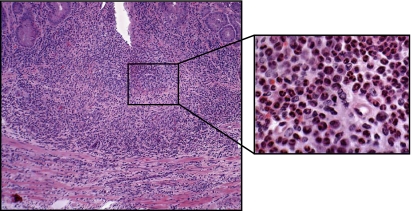
Figure 3 illustrates the histopathology that can be expected at 8 wk following adoptive transfer of CD4+CD45RBlow or CD4+CD45RBhigh T cells into RAG−/− mice. Transfer of CD4+CD45RBlow T cells serves as the control by repopulating RAG−/− (or SCID) mice with CD4+T cells that do not induce colitis. Within the CD4+CD45RBlow population resides a small subset of regulatory T cells that suppresses the production of disease producing Th1/Th17 cells derived from the injected naive T cells (see below) (2, 7, 21). Note the intact epithelium with normal numbers of goblet cells and lack of inflammatory cell infiltrate in the CD4+CD45RBlow T cell reconstituted mice (Fig. 3). Adoptive transfer of CD4+CD45RBhigh T cells into RAG−/− mice induces moderate-to-severe chronic colitis, which is characterized by large increases in bowel thickness and transmural infiltration of lymphocytes, monocytes, macrophages, and PMNs, affecting all layers of the colon (Figs. 3 and Fig. 4). We consistently observe a dramatic reduction in goblet cell numbers and in severe cases formation of crypt abscesses. In many respects, these mice exhibit many of the histopathological features of Crohn's colitis. It has been our experience that ∼80–90% of the RAG−/− recipients will develop moderate-to-severe colitis over a 6- to 8-wk period whereas RAG−/− reconstituted with CD4+CD45RBlow T cells never develop colitis (Fig. 3C). It is not uncommon that some mice (20–30%) develop significant weight loss at 4–5 wk and thus must be euthanized at that time. We have also found that the inflamed colon is significantly shorter in length and heavier in weight than are colons from a healthy WT or RAG−/− mice injected with CD4+CD45RBlow T cells. Indeed, when we correlate blinded histopathology scores with the length-to-weight ratio of the colons from different mice from a variety of different studies we find a highly significant correlation, suggesting that length-to-weight ratio may be a used as a quantitative index of inflammation (Fig. 5).
Fig. 3.
Histopathology of chronic colitis. A: representative micrographs of RAG−/− mice reconstituted with either CD4+CD45RBhigh (RBhigh) or CD4+CD45RBlow (RBlow) T cells (0.5 × 10⁶ cells) at 8 wk posttransfer. Note the large increase in bowel wall thickness, inflammatory cell infiltrate, and the appearance of crypt abscess (arrow) in the RAG−/− reconstituted with CD4+CD45RBhigh T cells. B: blinded histopathology scores of colons from both groups of mice (n = 9 for each group). See methods for scoring criteria. C: incidence and severity of chronic colitis. Animals receiving a histopathology score of 0 were judged to be without disease (no colitis); mild colitis received histopathology scores of 1–5; moderate colitis received histopathology scores of 6–10, and severe colitis received histopathology scores 11–17. We have found that >80% of the RAG−/− injected with CD4+CD45RBhigh T cells develop moderate-to-severe colitis at 8 wk following adoptive transfer.
Fig. 4.
High magnification of colon obtained from RAG−/− at 8 wk following adoptive transfer with CD4+CD45RBhigh T cells. Note the large mixed leukocyte infiltrate composed primarily of granulocytes, T cells, and monocytes (inset).
Fig. 5.
Correlation between colonic weight-to-length (g/cm) ratio and blinded histopathological scores. ▴, RAG−/− mice reconstituted with CD4+CD45RBhigh T cells (n = 36); ▿, RAG−/− mice reconstituted with CD4+CD45RBlow T cells (n = 7); •, RAG−/− mice reconstituted with both CD4+CD45RBhigh and CD4+CD45RBlow T cells (n = 14). Data derived from Ref. 18.
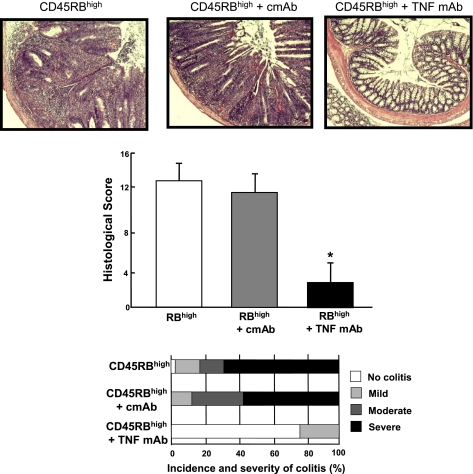
Historically, the T cell transfer model has been described as a Th1 model of colitis because IFN-γ production in cells in the inflamed tissue is very high in this model (18). With the recent discovery of the Th17 subset of effector T cells, the inflammation induced in this model is now thought to represent a mixed Th1/Th17 model of colitis since CD4+ T cells isolated from the spleen, mesenteric lymph nodes, and colonic lamina propria of colitic mice produce both cytokines (Fig. 6). Quantitative real-time polymerase chain reaction as well as RNase protection assays reveal large and significant increases in tumor necrosis factor (TNF)-α as well as other Th1 and macrophage-derived cytokines (8, 17, 19). Therefore, it is not surprising to find that administration of a monoclonal antibody directed against mouse TNF-α attenuates colitis in this model (Fig. 7). These data suggest again that this model closely mimics Crohn's disease since anti-TNF therapy (inflixamab) has been found to be effective in treating patients with this disease (24).
Fig. 7.
Histopathology, incidence, and severity of chronic colitis of RAG−/− mice reconstituted with CD4+CD45RBhigh T cells and treated with either an irrelevant isotype monoclonal antibody (cmAb) or a mAb against mouse tumor necrosis factor-α (TNF mAb). At 48 h following reconstitution of RAG−/− with T cells, mice were treated with 0.5 mg of either mAb (ip) 3 times per week for 8 wk.
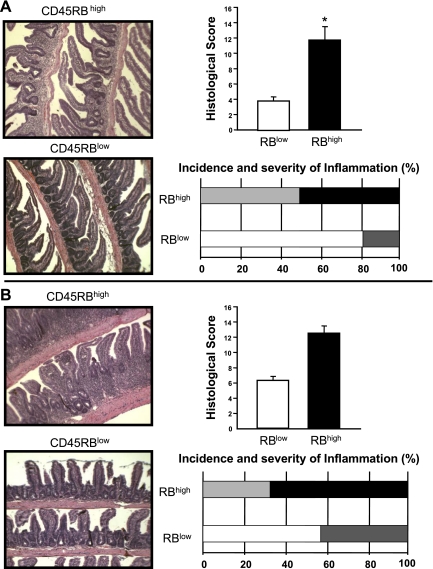
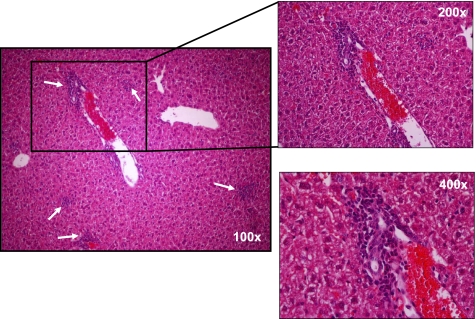
Another interesting yet underappreciated aspect of this model is the development of small bowel and liver inflammation. We have reported that transfer of CD4+CD45RBhigh T cells into RAG−/− recipients induces both colitis and small bowel inflammation (18). We have found that the small intestine of these reconstituted mice exhibited a loss of goblet cells along the entire length of small intestine, which was most noticeable in the distal portion and loss of Paneth cell staining in the crypts of the distal small bowel (Fig. 8) (18). This pathology may prove useful for investigators who wish to ascertain whether the immunological mechanisms responsible for colonic inflammation are similar to those that induce inflammation of the small intestine. The reasons for the relative paucity of reports by other laboratories describing small intestine inflammation in this model are not clear; however, most of the original studies used SCID recipients whereas we have used primarily RAG−/− mice. It has been well described that SCID mice are “leaky” in that they can begin to develop B cells with age which may influence the development of intestinal inflammation. This is supported by work from our laboratory as well as others demonstrating that T cell-deficient but B cell-replete mice develop duodenal inflammation but not ileitis (3, 18). In addition to the small intestine, reconstitution of lymphopenic mice with naive T cells induces liver inflammation (Fig. 9). We have found that the inflammation occurs within the interlobular and periportal regions of the liver. These observations suggest that the T cell transfer model may be useful for investigating whether gut inflammation drives liver and possibly biliary inflammation as observed in primary sclerosing cholangitis associated with IBD.
Fig. 8.
Histopathology, incidence, and severity of jejunal (A) and ileal (B) inflammation in RAG−/− mice reconstituted with CD4+CD45RBhigh or CD4+CD45RBlow T cells. Note the villus blunting, bowel wall thickening, and inflammatory infiltrate in the mice injected with CD4+CD45RBhigh T cells. Incidence and severity of inflammation were based on scores described in the Fig. 3 legend. Data derived from Ref. 18.
Fig. 9.
Liver histopathology in RAG−/− mice reconstituted with CD4+CD45RBhigh T cells at 8 wk posttransfer. Note the periportal and intralobular inflammatory infiltrate composed primarily of mononuclear cells.
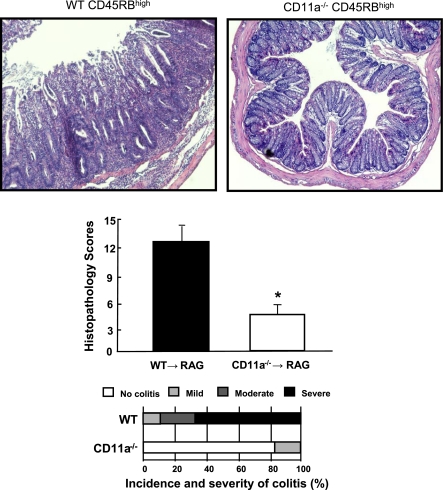
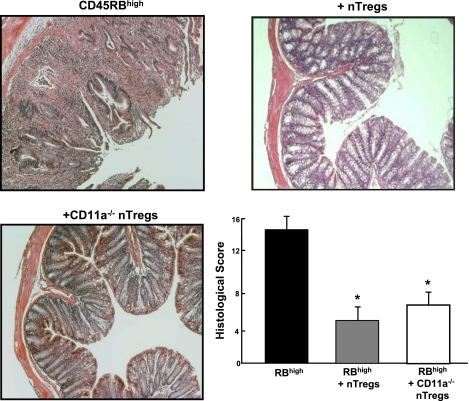
A major advantage of the T cell transfer model is its utility for investigating the specific immunological mechanisms responsible for induction as well as suppression of chronic gut inflammation. For example, it is thought that certain T cell-associated adhesion molecules are important for the induction of disease. We have found that this is indeed the case in the T cell transfer model. Adoptive transfer of CD4+CD45RBhigh T cells deficient in lymphocyte function-associated antigen-1 (LFA-1; CD11a/CD18) into lymphopenic recipients fails to induce colitis, suggesting that this T cell-associated adhesion molecule is required for induction of disease (Fig. 10) (17, 19). In other studies, the T cell transfer model has been used to assess the role of different lymphocyte populations, cytokines, and accessory proteins in induction of disease. One aspect of this model that has proven invaluable for delineating the mechanisms responsible for immune regulation is that cotransfer of both CD4+CD45RBhigh and CD4+CD45RBlow T cells prevents the induction of colitis (6, 20, 21). Work by several groups of investigators has established that the regulatory activity of the CD4+CD45RBlow population resides within a subset of naturally occurring T cells that express the IL-2 receptor-α chain (termed CD25) and the transcription factor Foxp3 (i.e., CD4+CD25+Foxp3+ T cells) and are termed “natural regulatory T cells” or nTregs (6, 7, 9, 11, 21). In addition to preventing the induction of colitis, it has been demonstrated that nTregs may reverse or “cure” established disease in an IL-10-dependent manner (15, 27). We have utilized this model to ascertain whether LFA-1−/− nTregs are capable of reversing established disease. Surprisingly, we found that although LFA-1 is required for induction of disease, it is not critical for suppression of active colitis (Fig. 11).
Fig. 10.
Adoptive transfer of CD11a-deficient (CD11a−/−) CD4+CD45RBhigh T cells into RAG-1−/− recipients fails to induce colitis. Histopathology, incidence, and severity of colitis were determined at 8 wk posttransfer. Data obtained from Ref. 19.
Fig. 11.
Cotransfer of CD11a−/− regulatory T cells (Tregs; CD4+CD25+) with CD4+CD45RBhigh T cells suppresses the development of chronic colitis as effectively as wild-type Tregs. Wild-type or CD11a−/− Tregs (0.25 × 10⁶ cells) were injected into RAG−/− recipients at 2 wk following injection of CD4+CD45RBhigh T cells (0.5 × 10⁶ cells). Histopathology was quantified at 8 wk posttransfer.
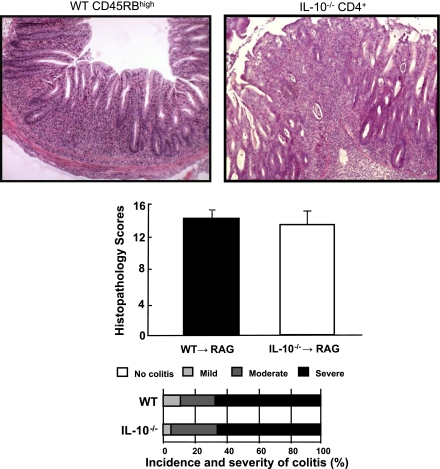
There is becoming an increased expectation for investigators to use animal models of chronic intestinal inflammation to delineate the pathogenetic mechanism responsible for induction, perpetuation, and/or regulation of experimental IBD. However, many of the spontaneous mouse models of IBD are not readily available, have not been adequately characterized, and/or possess a relatively low penetrance of disease. Furthermore, many investigators do not have the background and/or ready access to the detailed immunological methods and/or instrumentation required to prepare the different purified donor T cells to be used in the T cell transfer model. This has prompted our laboratory to develop a simplified version of the T cell transfer model. This version has proven particularly promising and is based on the observation that adoptive transfer of flow purified CD4+CD45RBhigh or CD4+CD45RBlow T cells obtained from IL-10−/− donor mice induces chronic colitis in lymphopenic mice (23, 28). We reasoned that unfractionated CD4+ T cells (which contain both CD4+CD45RBhigh and CD4+CD45RBlow T cells) should be capable of inducing colitis in RAG−/− recipients. Indeed, we have found that transfer of at least 1 million IL-10−/− CD4+ T cells enriched using a commercially available negative selection kit (Dynal) induces moderate-to-severe colitis in ∼80% of the mice (Fig. 12). This method does not require flow cytometry for T cell purification and the time required to prepare the cells and inject the mice is reduced by more than 60%. This variation of the standard protocol may prove useful for investigators who wish to establish and characterize a simple mouse model of chronic gut inflammation.
Fig. 12.
Adoptive transfer of CD4+ T cells obtained from interleukin-10-deficient (IL-10−/−) mice induces chronic colitis in RAG−/− recipients at 8 wk posttransfer. IL-10−/− splenocytes were enriched for CD4+ T cells (>85%) using a commercially available negative selection kit specifically for CD4+ T cells (Dynal). Wild-type (WT) CD4+CD45RBhigh T cells were purified by flow cytometry as described in the methods. RAG-1−/− recipients were injected (ip) either with IL-10−/− CD4+ T cells (1 × 10⁶ cells) or with CD4+CD45RBhigh T cells (0.5 × 10⁶ cells). Note that IL-10−/− CD4+ injected mice possessed a similar incidence and severity of chronic colitis as did RAG−/− mice injected with WT naive T cells purified by flow cytometry. n = 8 for each group.
Concluding Remarks
There is a growing expectation that investigators will use at least one model of chronic intestinal inflammation to investigate the molecular, cellular, and immunological mechanisms responsible for the induction, perpetuation, and/or regulation of experimental IBD. Unfortunately, many of the spontaneous mouse models of IBD are not readily available, have not been adequately characterized, and/or possess a relatively low penetrance of disease. Because the T cell transfer model induces colitis in a predictable manner with a high incidence of disease in all major strains of mice, it has grown in popularity over the past several years. We have found that the standard protocol presented in this communication can be mastered by technicians, graduate students, postdoctoral fellows, and new faculty within 3–4 mo. Newer and more simplified variations of the T cell transfer model (e.g., IL-10−/− CD4+→RAG-1−/−) can be mastered in a matter of weeks and do not require the use of flow cytometry.
GRANTS
This work was supported by the National Institutes of Health (PO1 DK-43785; Project 1 and Cores B and C) and the Yamanouchi USA Foundation.
REFERENCES
- 1.Berg DJ, Davidson N, Kuhn R, Muller W, Menon S, Holland G, Thompson-Snipes L, Leach MW, Rennick D. Enterocolitis and colon cancer in interleukin-10-deficient mice are associated with aberrant cytokine production and CD4 (+) TH1-like responses. J Clin Invest 98: 1010–1020, 1996. [DOI] [PMC free article] [PubMed] [Google Scholar]
- 2.Coombes JL, Robinson NJ, Maloy KJ, Uhlig HH, Powrie F. Regulatory T cells and intestinal homeostasis. Immunol Rev 204: 184–194, 2005. [DOI] [PubMed] [Google Scholar]
- 3.Dohi T, Fujihashi K, Koga T, Shirai Y, Kawamura YI, Ejima C, Kato R, Saitoh K, McGhee JR. T helper type-2 cells induce ileal villus atrophy, goblet cell metaplasia, and wasting disease in T cell-deficient mice. Gastroenterology 124: 672–682, 2003. [DOI] [PubMed] [Google Scholar]
- 4.Elson CO, Cong Y, McCracken VJ, Dimmitt RA, Lorenz RG, Weaver CT. Experimental models of inflammatory bowel disease reveal innate, adaptive, and regulatory mechanisms of host dialogue with the microbiota. Immunol Rev 206: 260–276, 2005. [DOI] [PubMed] [Google Scholar]
- 5.Fiocchi C Inflammatory bowel disease: etiology and pathogenesis. Gastroenterology 115: 182–205, 1998. [DOI] [PubMed] [Google Scholar]
- 6.Izcue A, Coombes JL, Powrie F. Regulatory T cells suppress systemic and mucosal immune activation to control intestinal inflammation. Immunol Rev 212: 256–271, 2006. [DOI] [PubMed] [Google Scholar]
- 7.Izcue A, Powrie F. Special regulatory T cell review: regulatory T cells and the intestinal tract—patrolling the frontier. Immunology 123: 6–10, 2008. [DOI] [PMC free article] [PubMed] [Google Scholar]
- 8.Kawachi S, Morise Z, Jennings SR, Conner E, Cockrell A, Laroux FS, Chervenak RP, Wolcott M, Van der Heyde H, Gray L, Feng L, Granger DN, Specian RA, Grisham MB. Cytokine and adhesion molecule expression in SCID mice reconstituted with CD4+ T cells. Inflamm Bowel Dis 6: 171–180, 2000. [DOI] [PubMed] [Google Scholar]
- 9.Kim JM, Rudensky A. The role of the transcription factor Foxp3 in the development of regulatory T cells. Immunol Rev 212: 86–98, 2006. [DOI] [PubMed] [Google Scholar]
- 10.Kjellev S, Lundsgaard D, Poulsen SS, Markholst H. Reconstitution of Scid mice with CD4+. Int Immunopharmacol 6: 1341–1354, 2006. [DOI] [PubMed] [Google Scholar]
- 11.Kronenberg M, Rudensky A. Regulation of immunity by self-reactive T cells. Nature 435: 598–604, 2005. [DOI] [PubMed] [Google Scholar]
- 12.Laroux FS, Norris HH, Houghton J, Pavlick KP, Bharwani S, Merrill DM, Fuseler J, Chervenak R, Grisham MB. Regulation of chronic colitis in athymic nu/nu (nude) mice. Int Immunol 16: 77–89, 2004. [DOI] [PubMed] [Google Scholar]
- 13.Mizoguchi A, Mizoguchi E, Smith RN, Preffer FI, Bhan AK. Suppressive role of B cells in chronic colitis of T cell receptor alpha mutant mice. J Exp Med 186: 1749–1756, 1997. [DOI] [PMC free article] [PubMed] [Google Scholar]
- 14.Mizoguchi E, Mizoguchi A, Preffer FI, Bhan AK. Regulatory role of mature B cells in a murine model of inflammatory bowel disease. Int Immunol 12: 597–605, 2000. [DOI] [PubMed] [Google Scholar]
- 15.Mottet C, Uhlig HH, Powrie F. Cutting edge: cure of colitis by CD4+CD25+ regulatory T cells. J Immunol 170: 3939–3943, 2003. [DOI] [PubMed] [Google Scholar]
- 16.Mudter J, Wirtz S, Galle PR, Neurath MF. A new model of chronic colitis in SCID mice induced by adoptive transfer of CD62L+ CD4+ T cells: insights into the regulatory role of interleukin-6 on apoptosis. Pathobiology 70: 170–176, 2002. [DOI] [PubMed] [Google Scholar]
- 17.Ostanin DV, Furr KL, Pavlick KP, Gray L, Kevil CG, Shukla D, D'Souza D, Hoffman JM, Grisham MB. T cell-associated CD18 but not CD62L, ICAM-1, or PSGL-1 is required for the induction of chronic colitis. Am J Physiol Gastrointest Liver Physiol 292: G1706–G1714, 2007. [DOI] [PubMed] [Google Scholar]
- 18.Ostanin DV, Pavlick KP, Bharwani S, D'Souza D, Furr KL, Brown CM, Grisham MB. T cell-induced inflammation of the small and large intestine in immunodeficient mice. Am J Physiol Gastrointest Liver Physiol 290: G109–G119, 2006. [DOI] [PubMed] [Google Scholar]
- 19.Pavlick KP, Ostanin DV, Furr KL, Laroux FS, Brown CM, Gray L, Kevil CG, Grisham MB. Role of T cell-associated lymphocyte function-associated antigen-1 in the pathogenesis of experimental colitis. Int Immunol 18: 389–398, 2006. [DOI] [PubMed] [Google Scholar]
- 20.Powrie F T cells in inflammatory bowel disease: protective and pathogenic roles. Immunity 3: 171–174, 1995. [DOI] [PubMed] [Google Scholar]
- 21.Powrie F Immune regulation in the intestine: a balancing act between effector and regulatory T cell responses. Ann NY Acad Sci 1029: 132–141, 2004. [DOI] [PubMed] [Google Scholar]
- 22.Powrie F, Leach MW, Mauze S, Menon S, Caddle LB, Coffman RL. Inhibition of Th1 responses prevents inflammatory bowel disease in scid mice reconstituted with CD45RBhi CD4+ T cells. Immunity 1: 553–562, 1994. [DOI] [PubMed] [Google Scholar]
- 23.Rennick DM, Fort MM, Davidson NJ. Studies with IL-10−/− mice: an overview. J Leukoc Biol 61: 389–396, 1997. [DOI] [PubMed] [Google Scholar]
- 24.Sandborn WJ, Targan SR. Biologic therapy of inflammatory bowel disease. Gastroenterology 122: 1592–1608, 2002. [DOI] [PubMed] [Google Scholar]
- 25.Sartor RB Mechanisms of disease: pathogenesis of Crohn's disease and ulcerative colitis. Nat Clin Pract Gastroenterol Hepatol 3: 390–407, 2006. [DOI] [PubMed] [Google Scholar]
- 26.Strober W, Fuss I, Mannon P. The fundamental basis of inflammatory bowel disease. J Clin Invest 117: 514–521, 2007. [DOI] [PMC free article] [PubMed] [Google Scholar]
- 27.Uhlig HH, Coombes J, Mottet C, Izcue A, Thompson C, Fanger A, Tannapfel A, Fontenot JD, Ramsdell F, Powrie F. Characterization of Foxp3+CD4+CD25+ and IL-10-secreting CD4+CD25+ T cells during cure of colitis. J Immunol 177: 5852–5860, 2006. [DOI] [PMC free article] [PubMed] [Google Scholar]
- 28.Yen D, Cheung J, Scheerens H, Poulet F, McClanahan T, McKenzie B, Kleinschek MA, Owyang A, Mattson J, Blumenschein W, Murphy E, Sathe M, Cua DJ, Kastelein RA, Rennick D. IL-23 is essential for T cell-mediated colitis and promotes inflammation via IL-17 and IL-6. J Clin Invest 116: 1310–1316, 2006. [DOI] [PMC free article] [PubMed] [Google Scholar]


