

Abstract
Little is known about the changes that take place in the adolescent brain over the first few years following the onset of psychosis. The present longitudinal study builds on an earlier cross-sectional report demonstrating brain abnormalities in adolescent-onset psychosis patients with a recent-onset first episode of psychosis. Magnetic resonance imaging studies were obtained at baseline and 2 years later from 21 adolescents with psychosis and 34 healthy controls matched for age, gender, and years of education. Whole-brain volumes and gray matter (GM) and cerebrospinal fluid (CSF) volumes of the frontal, parietal, temporal, and occipital lobes were measured at baseline and at 2-year follow-up. In the frontal lobe, the rate of GM volume loss was significantly higher in male patients (2.9% and 2.0%, respectively, for left and right) than in controls (1.2% and 0.7%, respectively, for left and right). In the left frontal lobe, male patients showed a significantly higher rate of CSF volume increase than controls (8.6% vs 6.4%). These differences in rates of volume change were observed in male and female patients, although only males showed significant time × diagnosis interactions. This negative finding in females should be interpreted with caution as the study was underpowered to detect change in women due to limited sample size. An exploratory analysis revealed that schizophrenia and nonschizophrenia psychotic disorders showed similar volume change patterns relative to controls. Change in clinical status was not correlated with longitudinal brain changes. Our results support progression of frontal lobe changes in males with adolescent-onset psychosis.
Keywords: MRI, first episode, early onset, psychosis, neuroimaging, brain volumes
Introduction
The study of adolescents with first-episode psychosis is of great interest for understanding the pathogenesis of psychosis because younger patients are less confounded by environmental factors such as substance abuse, disease duration, education years, and treatment effects, thus representing a more homogenous patient group. Brain volume abnormalities have been consistently described early in the course of psychosis. Reduction in whole brain and in gray matter (GM) volume, primarily in the frontal and temporal lobes, and enlargement of the lateral ventricles1–4 are among the most replicated findings in cross-sectional studies of adult patients with first psychotic episodes compared with healthy controls, in line with those typically described in chronic schizophrenia.5,6 Moreover, early onset psychosis (EOP, first episode before 18 years of age) has been associated with brain changes similar to those reported in chronic schizophrenia.7–10
The nature, timing, and course of these structural abnormalities need to be elucidated in order to understand the pathological processes underlying psychosis, in the context of the neurodevelopmental or the neurodegenerative hypothesis.11 The essential question concerns whether brain abnormalities observed at an early stage are static or progress with time.
Evidence of progressive brain changes during the initial years of psychosis is still not conclusive. Whereas some follow-up studies of first-episode schizophrenia have found progressive reduction of GM volume in the total brain,12 frontal,13 parietal and temporal lobes,14 and enlargement of the lateral ventricles,12,15 others have failed to detect such longitudinal changes.16–19 Greater volume decline has been found at follow-up in first-episode schizophrenia patients compared with chronic patients,13 suggesting that brain changes are more pronounced during the early stages of the illness. Longitudinal brain changes observed in patients with childhood-onset schizophrenia include greater GM loss and larger increase in ventricular volume than controls.20–23 GM loss in these patients appears to start in the parietal cortex, subsequently spreading through the temporal, frontal, and prefrontal cortices,24 and frontal atrophy seems to be progressive during adolescence.25 On the other hand, the only longitudinal study of adolescent-onset schizophrenia showed no progressive changes over a 2- to 3-year period in the prefrontal GM deficit, and in the ventricular enlargement observed relative to control subjects.26,27
Most longitudinal studies of first-episode psychosis comprise both adolescents and adults,12,14,15,19 making it difficult to disentangle the influence of normal development on findings. Longitudinal studies of early onset schizophrenia (with the exception of James et al26,27) have included mostly treatment-resistant patients with a considerable duration of illness at baseline scanning.20–25
To avoid these confounding factors and minimize the impact of illness and medication on baseline and follow-up conditions, this longitudinal study followed a cohort of psychotic patients with very recent onset of psychosis (under 6 months), short duration of disease, and short antipsychotic treatment prior to scanning. The study includes a matched comparison group of healthy adolescents to control for age-related changes, and all subjects were followed for the same period of 2 years. The cohort of patients is particularly suited for a longitudinal study because it showed structural changes relative to controls,10 in line with known changes in adults. Based on previous research, we hypothesized that the pattern of change over time would be different between psychotic patients and control subjects, with the former having greater loss of GM. In exploratory analyses, we also sought to determine if volume changes would be different in patients with schizophrenia compared with patients with other psychotic disorders and to assess the influence of clinical status on brain volumes.
Methods
Subjects
The sample used in this longitudinal study was made up of 21 patients (5 females) and 34 controls (13 females). Subjects came from a larger sample with 23 adolescents assessed at their first episode described in detail elsewhere.10 Briefly, the baseline group of patients was composed of 23 adolescents (age range 12–18 years, mean [SD] age 15.8 [1.7] years, 6 females) with a first psychotic episode and a maximum 6-month history of positive symptomatology. Patients were consecutively admitted to a short-term psychiatric hospitalization unit in a general hospital covering a catchment area of about 3.5 million people. The group of healthy individuals were recruited from 5 local schools, and included 37 adolescents (age range 13–18 years, mean [SD] age 15.3 [1.4] years, 14 females) without any psychiatric diagnosis.10 Exclusion criteria for both groups were presence (in control subjects) or comorbidity (in patients) with other Axis I disorders including the use of intoxicants (except for sporadic use), pervasive developmental disorders, neurological disorders, head trauma, mental retardation, pregnancy, and/or breast-feeding. Clinical and neuroimaging data were collected for all participants. The present study included only those subjects for whom magnetic resonance imaging (MRI) and clinical data were available at follow-up (table 1). Two patients and 3 controls were lost to follow-up. Of those patients, one refused the evaluation and other left the country. As for the controls, one refused the evaluation, one developed fear of the MRI machine, and one could not undergo the MRI protocol due to dental braces. The time elapsed between the first psychotic symptoms and the first MRI scan was brief (mean [SD] 3.2 [3] months). Controls were matched with the patient sample for age, gender, and years of education. Sociodemographic characteristics of the participants are reported in table 1.
Table 1.
Sociodemographic Characteristics of Patients and Controls Followed for 2 y
| Patients (n = 21) |
Controls (n = 34) |
Test | |||
| Mean | SD | Mean | SD | ||
| Age (y) | 15.7 | 1.7 | 15.2 | 1.4 | t = 1.2; P = 0.241 |
| Gender (male/female) | 16/5 | 21/13 | Chi-square = 0.7; P = 0.412 | ||
| Education (y) | 8.3 | 2.0 | 8.8 | 1.4 | t = 1.9; P = 0.280 |
| Parental socioeconomic statusa (1/2/3/4/5) | 6/8/1/1/5 | 3/8/8/2/13 | P = 0.094; Fisher's exact test | ||
| Handedness: right/left/mixed | 19/1/1 | 29/3/2 | P = 0.835; Fisher's exact test | ||
| Between-scan follow-up period (wk) | 24.2 | 1.0 | 24.2 | 0.5 | t = 0; P = 1.0 |
| Race/ethnicity (Caucasian/Hispanic/Caribbean/other) | 17/1/2/1 | 32/0/1/1 | P = 0.352; Fisher's exact test | ||
| Strauss and Carpenter Scale (baseline) | 52.4 | 8.5 | |||
| Duration of illness (mo) | 3.2 | 3 | |||
| Duration of treatment (wk) | 3.7 | 5.5 | |||
| Diagnosis (schizophrenia/other) | 8/13 | ||||
| Treatment (at baseline): quetiapine/olanzapine/risperidone | 5/8/8 | ||||
| Treatment (at follow-up): quetiapine/olanzapine/risperidone/clozapine/other | 9/2/3/3/2 | ||||
Parental socioeconomic status, assessed with the Hollingshead scale28 (ranging from 1 to 5). A rating of 5 corresponds to the highest socioeconomic status and a rating of 1 means the lowest socioeconomic status.
The study was approved by the Ethics and Clinical Research Boards of Gregorio Marañón General University Hospital, where the study took place. Prior to enrollment, legal representatives gave written informed consent and patients and controls assented to participate. All subjects met MRI safety criteria.
Measures
Baseline evaluations for both groups included collection of sociodemographic data, a physical examination, a clinical examination, and an MRI (for further details see Moreno et al10). The clinical and neuroimaging examinations were repeated at 2-year follow-up. Four experienced psychiatrists conducted the clinical evaluations. Patients and controls were evaluated for Diagnostic and Statistical Manual of Mental Disorders, Fourth Edition (DSM-IV) diagnoses using the Schedule for Affective Disorders and Schizophrenia for School-Age-Children Present and Lifetime version (K-SADS-PL, Spanish version29). Pervasive developmental disorder exclusion diagnoses were made based on clinical and DSM-IV criteria. Global functioning was evaluated with the Global Assessment of Functioning Scale (GAF).30 Psychotic symptoms were assessed in the patient group using the Positive and Negative Symptom Scale (PANSS)31 in its validated Spanish version.32 Intraclass correlation coefficients for the PANSS for the 4 psychiatrists were excellent, ranging from 0.72 to 0.96. Patients were also administered the Strauss and Carpenter Outcome Scale33 at baseline. Sociodemographic data included parental socioeconomic status as measured by the Hollingshead-Redlich Scale.28 Handedness was assessed using the Neurological Evaluation Scale.34 Clinical examinations (PANSS, GAF) at baseline and follow-up are reported in table 2.
Table 2.
Clinical Symptom Scores (Mean, SD) of Patients at Baseline and 2-y Follow-up, and Absolute Change
| Baseline |
Follow-up |
Changea | |||
| Mean | SD | Mean | SD | ||
| PANSS score | |||||
| Negative | 21.6 | 6.4 | 15.4 | 5.8 | −5.9*** |
| Positive | 22.8 | 6.1 | 12.8 | 4.5 | −9.9*** |
| General | 42.3 | 8.7 | 30.1 | 8.0 | −11.4*** |
| Total | 86.9 | 14.5 | 58.3 | 16.5 | −27.4*** |
| GAF | 43.6 | 18.4 | 75.8 | 14.8 | 32.5*** |
GAF, Global Assessment of Functioning Scale; PANSS, Positive and Negative Symptom Scale.
Paired t test: ***P < 0.001.
All patients had been receiving second-generation antipsychotics at the time of the baseline MRI scan for a mean (SD) time of 3.7 (5.5) weeks. No correlation was observed between disease or treatment duration and volume variables. During the follow-up period, treatments were adjusted according to clinical criteria and no standard protocol was followed. At the final evaluation, 90.5% patients were still receiving second-generation antipsychotics.
For an exploratory analysis, the group of patients was subdivided into 2 subgroups: “schizophrenia” and “nonschizophrenia” psychotic disorders (including bipolar disorder, depression with psychotic features, brief reactive episodes, and atypical psychoses). The diagnoses used in this report were those confirmed with the K-SADS at the 2-year follow-up evaluation.
MRI Acquisition and Processing
Two MRI scans were obtained from each subject: one at baseline and one at 2-year follow-up. Special care was taken to perform the baseline MRI as soon as possible after the clinical assessment, to avoid the potential confounding effect of initial medication and other factors related to onset of the disease. The time elapsed between the clinical examination and MRI scanning was reasonably short (mean [SD] 2.5 [5.5] weeks, median 0.4, range 0–24). The follow-up scan was performed at a mean (SD) 24.2 (0.7) months later (range 22.6–27.5); there were no significant differences between patients and controls concerning this period (table 1). Appointments for scanning were simultaneous for patients and controls, to avoid any cohort bias due to MRI equipment conditions.
MRI scans were acquired with a Philips Gyroscan 1.5T scanner, using the same acquisition protocol at baseline and follow-up, a T1-weighted 3D gradient echo sequence with the following parameters: matrix size 256 × 256, pixel size 0.9 × 0.9 mm (FOV 256 mm), flip angle 30°, echo time 4.6 ms, slice thickness 1.5 mm. T2-weighted sequences were also acquired for segmentation of the intracranial volume (ICV), verification of cerebrospinal fluid (CSF) segmentation, and other clinical purposes (Turbo-Spin Echo, turbo factor 15, echo time 120 ms, matrix size 256 × 256, slice thickness 3.5 mm).
Segmentation and Region of Interest Definition
To obtain volume measurements of the main brain lobes, we used a method for semiautomated segmentation of the brain based on the Talairach proportional grid system, similar to the one described elsewhere.35–37 This method has also been used in longitudinal studies measuring volume changes.38,39 Basically, we used a 2-step procedure. The first involved skull stripping, using an ICV mask obtained from the T2-weighted scan, where the external borders of the sulcal CSF are clearly visible. This ICV image was then coregistered with the T1-weighted scan for the segmentation of cerebral tissues into GM, white matter (WM), and CSF40 and segmentation of the cerebellum, which is necessary for building the Talairach grid. In a second stage, we applied the Talairach reference system41 to define regions of interest (ROIs) and to obtain volume data (figure 1). MR images were processed using locally developed software.37
Fig. 1.

Triplanar View of the Talairach Proportional Grid Built in a Skull-Stripped Brain to Illustrate the Segmentation and Quantification Method. The set of grid cells colored in red describe the frontal region of interest (right hemisphere) used in the study. Green color overlaid on the magnetic resonance imaging shows the segmentation of gray matter tissue.
The segmentation of cerebral tissues was performed using the standard algorithm in SPM2 (Statistical Parametric Mapping).40 The algorithm also removes the effect of radiofrequency field inhomogeneities.42 The Talairach grid is built on the edited brain MRI by manually selecting the position of the anterior and posterior commissure points and a third point in the midsagittal plane. The coordinates of these points serve to calculate the transformation (rigid rotation) required to comply with the Talairach space. Then, our application finds automatically the outer limits of the scalp edited (without cerebellum) MRI in Talairach space, and the 3D grid is built. At the end of this process, the brain is subdivided into 1056 box cells of the Talairach proportional grid system. On each brain with the Talairach grid, the 3D tissue masks correspond to GM, and CSF are superimposed, and the volume for each ROI and tissue type were calculated by summing the number of voxels across all Talairach “boxels,” following the regional groupings of grid cells described in previous studies (figure 1).35–37 The validity of the Talairach-based procedure as a suitable automated segmentation tool in schizophrenia research has previously been demonstrated.35–37 Reliability of our implementation of the method was assessed by repeating the whole segmentation procedure in a sample of 5 cases randomly selected. Values of intraclass correlation coefficient ranged from 0.96 to 0.99 for regional GM measurements and from 0.89 to 0.99 for CSF data.
The ROIs included in the analysis were the frontal, parietal, temporal, and occipital lobes, defined using the boundaries described previously for the Talairach method.35,36 Whole-brain GM and CSF were also measured. For each ROI, we obtained volumes for each hemisphere and for GM and CSF. In the occipital lobe, we were not able to obtain separate measurements for each hemisphere using the Talairach grid because of the marked asymmetry of this brain region. Volume data for WM were not included in the analysis to reduce the dimensionality of the analysis and because most studies have shown much less change in WM volume. ICV was measured by adding the total GM, WM, and CSF volumes, including the cerebellum.
The longitudinal change in volume was measured as the difference between follow-up and initial volume of each ROI. We used a quotient for total brain volume of the corresponding ROI, to allow comparisons of rates of change in measurements of different size. On the other hand, studies on brain growth in adolescents have shown that the total cerebral volume peaks at 10.5 years in females and 14.5 years in males,43 and that after the second decade whole-brain size begins a low decline into late adulthood.44 Based on these findings, our rationale was that minor differences on ICV between scans would rather reflect measurement error due to head positioning in the scanner and potential calibration differences in the MRI equipment. Change in ICV was then considered as longitudinal measurement error assuming that changes of skull size within the 2-year period in our population of adolescents was unlikely.45 Thus, we calculated a correction factor as a quotient between the initial (baseline) and final ICV (E_ICV = ICV1/ICV2), assuming that the total ICV should be equal in both scans. Average values of this correction factor were similar for patients and controls (mean 0.44% and 0.33%, respectively, for patients and controls), ranging from −1.56% to 2.11%, expressed as percent difference between ICV1 and ICV2. Thus, for each ROI, the magnitude of relative change in volume between the baseline (Vol1) and follow-up (Vol2) MRI was calculated as follows:
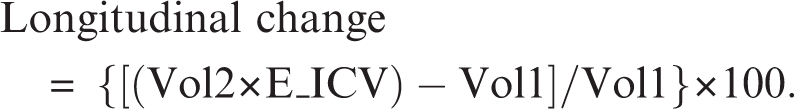 |
Statistical Analysis
Differences between patients and controls in demographic data were checked using Student's t, Fisher's exact, and chi-square tests. Descriptive and comparative analyses were made separately for males and females because of known gender differences in developmental trajectories of the brain43,46 as well as in abnormalities associated with psychosis.47 The sample of female patients was only 5 subjects, which might have introduced a bias toward male data in an analysis of both sexes pooled. Volume comparisons between patients and controls at baseline were done with an ANCOVA model, using ICV as a covariate. Despite the lack of statistically significant differences between patients and controls in ICV, brain size was used as a covariate because of the developmental changes known to occur in the brain of adolescent subjects43 in the age range included in this study (12–18 years).
To test for significant longitudinal change in clinical symptom scores and volume variables within each group, we used paired t tests. The hypothesis of different longitudinal change in patients and controls was tested by repeated measures ANCOVA. The model in this ANCOVA included time as the within-subject repeated factor, expressed as volume data at baseline (Vol1) and at follow-up (Vol2) for each subject, Diagnosis (patient vs control) as the between-subject factor, and ICV at baseline as the covariate. Because the main aim of the study was to investigate whether longitudinal volume changes differed between controls and patients, we focused on significant time × diagnosis interactions.
An exploratory analysis was also performed to examine the association between volume measures and clinical scores, using Pearson's linear correlation coefficient. The statistical analysis was done using SAS (9.0), and a 2-tailed P value threshold of 0.05 was considered statistically significant.
Results
Sociodemographic and Clinical Characteristics
At baseline, patients and controls were not significantly different in terms of age, gender, education, parental socioeconomic status, race, or handedness. With respect to clinical measures, all PANSS scores were significantly higher at baseline than at the 2-year follow-up, whereas GAF scores increased over follow-up (table 2). All patients were on second-generation antipsychotics at baseline (quetiapine 5, olanzapine 8, risperidone 8) and 90.5% were still on medication at follow-up (quetiapine 9, olanzapine 2, risperidone 3, clozapine 3, other second-generation antipsychotics 2) (table 1).
Baseline Differences Between Patients and Controls
At baseline, male patients showed smaller frontal GM volumes in both right (F1,34 = 6.8, P = 0.0131) and left hemispheres (F1,34 = 6.6, P = 0.0125) relative to controls. Male patients also showed larger frontal CSF volumes (right: F1,34 = 5.0, P = 0.0324; left: F1,34 = 4.9, P = 0.0331). In the right parietal lobe, male patients also showed smaller GM volumes, although this was of only marginal significance (F1,34 = 4.0, P = 0.0434) (table 3). Contrary to males, no statistically significant differences were observed between female patients and controls at baseline (table 4).
Table 3.
Volume Measurements in cubic centimeter (Mean SD) of Male Controls and Patients at Baseline and 2-y Follow-up. Rate of volume change between baseline and follow-up was calculated for each subject (see “Methods”), and mean values are shown for each group (%Ch). Negative values indicate volume decrease and vice versa. Columns at the right show significance of the group comparisons at baseline (Basal) and for differences in longitudinal change (Long)
| Controls (n = 21) |
Patients (n = 16) |
|||||||||||
| Baseline |
Follow-up |
%Cha | Baseline |
Follow-up |
||||||||
| Mean | SD | Mean | SD | Mean | SD | Mean | SD | %Cha | Basalb | Longc | ||
| Intracranial | 1524.1 | 107.5 | 1517.4 | 107.5 | −0.4 | 1480.9 | 124.5 | 1475.7 | 120.2 | −0.4 | ||
| Total gray matter | 873.0 | 68.4 | 855.2 | 64.3 | −1.6*** | 832.7 | 64.9 | 821.6 | 55.4 | −1.2 | ||
| Total white matter | 412.1 | 35.2 | 422.6 | 36.6 | 3.1 | 404.0 | 42.1 | 419.3 | 45.7 | 4.1 | ||
| Total CSF | 239.1 | 27.9 | 239.6 | 29.5 | 0.8 | 244.1 | 38.9 | 234.8 | 38.3 | −1.3 | ||
| Gray matter | ||||||||||||
| Frontal left | 83.7 | 6.4 | 82.2 | 6.2 | −1.2* | 80.0 | 7.7 | 77.4 | 8.4 | −2.9** | ** | * |
| Frontal right | 87.2 | 6.8 | 86.2 | 6.7 | −0.7 | 82.5 | 8.1 | 80.6 | 8.6 | −2.0 | ** | * |
| Parietal left | 68.2 | 7.3 | 65.8 | 6.4 | −2.9*** | 64.0 | 6.4 | 62.4 | 7.0 | −2.2* | ||
| Parietal right | 67.6 | 7.9 | 65.6 | 6.4 | −2.3** | 63.4 | 7.1 | 61.8 | 7.7 | −2.1 | * | |
| Temporal left | 83.4 | 6.4 | 81.3 | 6.1 | −2.0** | 78.8 | 6.4 | 79.5 | 5.7 | 1.3 | ||
| Temporal right | 82.2 | 7.0 | 79.9 | 6.5 | −2.3*** | 79.9 | 5.7 | 78.7 | 6.6 | −1.1 | ||
| Occipital bilateral | 98.0 | 11.4 | 95.8 | 10.3 | −1.4 | 92.4 | 11.4 | 87.0 | 9.6 | −5.0* | ||
| CSF | ||||||||||||
| Frontal left | 23.9 | 5.0 | 25.3 | 5.0 | 6.4 | 26.6 | 6.2 | 28.4 | 6.0 | 8.6* | * | ** |
| Frontal right | 25.0 | 5.0 | 25.2 | 5.3 | 1.9 | 27.7 | 6.0 | 26.6 | 5.7 | −2.2 | * | |
| Parietal left | 22.4 | 4.7 | 24.7 | 4.8 | 12.1*** | 23.5 | 4.8 | 23.5 | 5.4 | 1.0 | ||
| Parietal right | 19.8 | 3.9 | 20.7 | 3.9 | 6.2 | 21.3 | 4.1 | 18.8 | 3.4 | −10.1** | ||
| Temporal left | 18.6 | 2.0 | 18.3 | 2.2 | −1.3 | 18.4 | 3.9 | 17.7 | 3.6 | −2.0 | ||
| Temporal right | 17.0 | 2.7 | 15.9 | 2.0 | −3.9 | 16.0 | 2.5 | 14.7 | 3.4 | −7.7 | ||
| Occipital bilateral | 19.4 | 3.5 | 17.8 | 4.1 | −7.4* | 18.9 | 4.6 | 15.8 | 3.8 | −15.3*** | ||
CSF, cerebrospinal fluid.
Paired t test: *P < 0.05, **P < 0.01, ***P < 0.001.
ANCOVA: *P < 0.05, **P < 0.01.
Repeated measures ANCOVA; time × diagnosis interaction: *P < 0.05, **P < 0.01.
Table 4.
Volume Measurements in cubic centimeter (Mean SD) of Female Controls and Patients at Baseline and 2-y Follow-up. Rate of volumetric change between baseline and follow-up was calculated for each subject (see “Methods”), and mean values are shown for each group (%Ch). Negative values indicate volume decrease and vice versa
| Controls (n = 13) |
Patients (n = 5) |
|||||||||
| Baseline |
Follow-up |
Baseline |
Follow-up |
|||||||
| Mean | SD | Mean | SD | %Cha | Mean | SD | Mean | SD | %Cha | |
| Intracranial | 1433.9 | 120.1 | 1427.5 | 118.8 | −0.4 | 1405.7 | 113.1 | 1398.7 | 119.3 | −0.5 |
| Total gray matter | 800.1 | 73.4 | 795.2 | 64.7 | −0.1 | 807.6 | 97.8 | 790.1 | 92.7 | −1.5 |
| Total white matter | 390.7 | 38.6 | 395.8 | 40.2 | 1.7 | 372.3 | 43.5 | 378.2 | 40.9 | 2.2 |
| Total CSF | 243.1 | 26.1 | 236.5 | 34.5 | −2.6* | 225.8 | 47.3 | 230.4 | 45.4 | 4.0 |
| Gray matter | ||||||||||
| Frontal left | 72.8 | 8.5 | 72.5 | 7.6 | 0.2 | 76.3 | 9.5 | 73.9 | 10.2 | −2.7 |
| Frontal right | 76.7 | 8.1 | 76.0 | 7.0 | −0.3 | 77.8 | 9.1 | 75.1 | 10.8 | −3.1 |
| Parietal left | 61.8 | 7.9 | 61.0 | 6.2 | −0.5 | 63.4 | 9.0 | 62.1 | 6.6 | −0.8 |
| Parietal right | 62.1 | 9.0 | 60.8 | 7.1 | −1.3 | 62.5 | 8.8 | 60.4 | 7.4 | −2.3 |
| Temporal left | 76.3 | 7.4 | 76.0 | 7.0 | 0.1 | 76.4 | 11.0 | 74.9 | 7.1 | −0.7 |
| Temporal right | 77.4 | 8.2 | 76.4 | 7.6 | −0.8 | 73.7 | 9.7 | 73.2 | 10.6 | −0.2 |
| Occipital bilateral | 88.6 | 10.9 | 91.7 | 12.2 | 4.2 | 96.6 | 13.6 | 92.2 | 16.1 | −4.4 |
| CSF | ||||||||||
| Frontal left | 24.6 | 4.5 | 26.4 | 4.8 | 8.0** | 24.4 | 8.0 | 28.9 | 7.1 | 22.6** |
| Frontal right | 26.3 | 4.6 | 26.1 | 4.6 | 0.1 | 23.3 | 7.8 | 25.9 | 7.9 | 16.2 |
| Parietal left | 22.0 | 4.2 | 23.9 | 4.4 | 9.8* | 22.6 | 6.5 | 23.0 | 6.0 | 5.5 |
| Parietal right | 19.9 | 4.0 | 20.4 | 4.7 | 2.7 | 18.9 | 6.8 | 19.9 | 5.6 | 14.1 |
| Temporal left | 19.6 | 3.2 | 19.0 | 2.8 | −2.4 | 17.5 | 2.3 | 18.1 | 2.8 | 4.3 |
| Temporal right | 18.8 | 3.2 | 15.9 | 2.5 | −14.5** | 17.0 | 2.8 | 15.3 | 2.9 | −8.2 |
| Occipital bilateral | 20.8 | 3.2 | 19.8 | 4.3 | −5.0 | 19.9 | 5.8 | 17.8 | 5.0 | −8.0 |
CSF, cerebrospinal fluid.
Paired t test: *P < 0.05, **P < 0.01.
Longitudinal Volume Changes
In male controls, there was a reduction of approximately 2% in GM volumes in all brain lobes after the 2-year period. The paired t test revealed that this loss of GM was statistically significant in all brain lobes except the occipital lobe (table 3). Male patients showed a loss of GM volume in all brain lobes, ranging from 1.1% to 5%, after the 2-year period, although some of these changes were not significant. In the frontal lobe, the rate of GM volume loss was higher in patients (2.9% and 2.0%, respectively, for left and right) than in controls (1.2% and 0.7%, respectively, for left and right) table 3. These differences in the rates of change between male patients and controls resulted in a significant time × diagnosis interaction term in the repeated measures ANCOVA (left: F1,33 = 5.9, P = 0.0201; right: F1,33= 6.2, P = 0.0273; table 3; figure 2).
Fig. 2.

Individual Trajectories of Longitudinal Change in gray matter and cerebrospinal fluid Volumes of the Left Frontal Lobe in Patients and Controls. Vertical dotted lines represent 14, 16, and 18 years old.
Rates of sulcal CSF volume change over the 2-year follow-up were highly variable in male subjects (table 3). In the left frontal lobe, male patients showed a higher rate of CSF volume increase than controls (8.6% vs 6.4%) (table 3; figure 2). A significant time × diagnosis interaction was found in the repeated measures ANCOVA of the left frontal CSF (F1,33 = 7.1, P = 0.008) (table 3; figure 2). However, only small changes were observed in right CSF volume (table 3). The occipital lobe showed highest longitudinal change, 5.0% and −15.3%, respectively, for GM and CSF in males (table 3), and these rates of change were higher in patients and controls. However, no significant group differences (interaction terms) were obtained in the repeated measures ANCOVA. This lack of statistical significance reflects the large variability of this brain region, partly due to the small size (15–20 cc), and the larger segmentation error caused by partial volume effects in this ROI. For these reasons, results concerning the occipital lobe should be taken with caution, and should be confirmed in a larger sample.
In females, the rates of frontal GM volume loss were 2.7% (left) and 3.1% (right) in patients and 0.2% (left) and 0.3% (right) in controls. The increases in sulcal frontal CSF volume were 22.6% and 16.2% in patients and 8.0% and 0.1% in controls (left and right hemispheres, respectively). However, no significant time × diagnosis interaction was obtained in the repeated measures ANCOVA (table 4).
No significant correlations were observed between change in clinical scores and volume change rates during follow-up. There was also a lack of correlation between duration of treatment (in weeks) and changes in total intracranial GM volume (r = 0.026, P = 0.910).
In the variables that showed significant differences between patients and controls, an exploratory analysis was done by subdividing the patients in 2 groups: “schizophrenia” and “nonschizophrenia” psychotic disorders. Looking at the distribution of data points in the frontal lobe, where differences in GM and CSF measurements between patients and controls were significant, it seems that both subtypes of psychosis show similar pattern of change relative to controls (figure 3).
Fig. 3.

Means and Distributions of Volume Data for gray matter and cerebrospinal fluid of the Left Frontal Lobe Showing Differences Between Subtypes of Psychosis Relative to Control Subjects. Schiz, “schizophrenia”; non Schiz, “nonschizophrenia”psychotic disorders (including bipolar disorder, depression with psychotic features, brief reactive episodes, and atypical psychoses). Data points represent percentage of volume change from baseline to follow-up. Negative values indicate volume loss and vice versa. Means are represented by solid lines.
Discussion
The present study provides new evidence that baseline frontal lobe volume deficits in male EOP show progressive differentiation from control subjects during the early stages of the illness. Patients showed a loss of GM and an increase of CSF volumes at a greater rate than matched control subjects. Considering the short illness duration and follow-up time in our sample, these changes must have occurred within a relatively short period after onset of symptoms and were only observed in the frontal lobe.
The age-related whole-brain changes observed in our study consisted of WM and CSF volume increase and GM loss, in agreement with the expected pattern described for adolescents.43,48,49 The main difference in volume change rates between patients and controls during the follow-up period was a higher rate of GM loss and higher rate of CSF increase in the frontal lobe of patients. These differences in volume change rates were observed in both male and female patients, although only males showed significant time × diagnosis interactions. It has been hypothesized that shorter duration or lesser severity of illness may account for more subtle brain volume changes in women.50,51 The small number of female patients in our sample does not allow for reliable testing of those gender differences. Our results should not be seen as an indication of distinct longitudinal patterns in male and female patients. Because of our choice to make a separate analysis for each sex, we can only be certain that at least male patients show some progressive changes relative to control subjects. However, the question of whether this finding is restricted to males or common to both sexes can only be resolved by performing a separate analysis using an equally representative sample of both sexes. The GM deficit and CSF excess in the frontal lobe present at baseline in psychotic males is consistent with previous cross-sectional studies.8,20,52–55 Progressive reduction in frontal GM volume and increase in frontal CSF volume have been reported to occur during the initial years after onset of schizophrenia in young adults13,38 and later in the course of the illness.45 Frontal abnormalities are also in agreement with the findings of Vidal et al25 documenting baseline bilateral deficits in medial frontal cortices in chronically ill patients with childhood-onset schizophrenia and faster progression of those deficits during adolescence as compared with healthy controls. The same baseline and progressive deficits were also present, although with less degree of severity, in a matched group of psychosis patients who did not meet schizophrenia criteria.25 These results suggest a continuum between early onset and adult-onset/chronic disorders. Other studies of childhood-onset schizophrenia have found results different from those reported here. The National Institute of Mental Health (NIMH) longitudinal 5-year follow-up study of 12 childhood-onset schizophrenia patients and 12 matched controls did not find GM deficits in temporal or frontal cortices in the baseline scan (more than 3 years after onset of illness), although frontal and temporal deficits progressed during follow-up.24 In our sample of adolescent-onset psychosis patients, we documented frontal GM volume deficits already 3 months after onset of illness and, unlike in the Thompson et al24 study, the pattern of change after 2 years included only frontal lobe decrease.
Clinical differences in the patients studied may account for some of those differences in findings. Whereas the NIMH childhood-onset schizophrenia studies24 included treatment-resistant patients who had been ill for some years, our sample was more clinically representative, including consecutive admissions to a hospital covering a catchment area, with significant clinical improvement of patients at follow-up. The greater severity of the NIMH cases may partly be responsible for their findings with greater and more widespread GM loss, even after longer duration of illness. The fact that frontal deficits appear earlier than those in other brain areas may be related to the timing of maturation of the frontal lobe relative to other brain regions.43 Childhood-onset schizophrenia patients showed widespread changes relative to controls at an early age, but at follow-up differences persisted only in the frontal and temporal areas.56
Previous studies of adolescent-onset schizophrenia showed smaller prefrontal cortex27 and larger CSF volumes26 in patients than in controls, but failed to show further changes over 2–3 years of follow-up.26,27 Clinical differences in the patient sample may partly explain their results, compared with those observed in this study. In the James et al studies,26,27 patients had been ill for a mean of 1.5 years (2 years for males) before the first scan. Longer follow-up could help determine if our patients, with very similar age of onset and referred also within the community, follow a course similar to those reported by James et al.26,27
Our findings seem to support the neurodevelopmental hypothesis of schizophrenia. Even though, with our data, we cannot determine when frontal lobe changes started, the appearance of volume changes already at the baseline scan, shortly after onset of the first positive symptoms, may reflect earlier disruption of developmental processes (eg, neuronal migration,57 synaptic pruning58,59). Frontal lobe deficits seem to be more genetically mediated than deficits in other areas60 and are even present during the prodromal phases of psychosis.61 Although the progressive decrease in frontal GM and the subsequent increase in frontal CSF sulci in our sample could be understood as a consequence of the toxic effect of psychosis on brain structures, some researchers have argued against explanations based solely on volume differences in the absence of concurrent and consistent data on evidence of neuronal death and acceleration of clinical progression.11,62 Alternatively, neurodevelopmental mechanisms active during adolescence may be disrupted in psychotic patients (eg, impaired synaptic plasticity62), therefore acting after onset and during the early years of illness. Brain development continues until early adulthood and any prior event could be conceptualized as neurodevelopmental in nature. Concerning the duration of the progressive loss of GM observed in our patients, we can only speculate that the rate of progressive changes would reach a plateau after the age of 18, according to the study of Sporn.20 This stop of GM loss observed by Sporn suggests that young adult or late adolescent studies would need longer time periods and larger samples to assess this attenuated effect.
Our results suggest a lack of association between symptomatology and volume changes, in agreement with previous studies.12,63,64 These results further jeopardize the hypothesis of neurodegeneration. In fact, in our sample, negative and positive psychotic symptoms, although present at follow-up, significantly improved over time, which would be difficult to reconcile with a scenario of brain degeneration. Our analysis could imply that excess GM loss, as an expression of abnormal brain maturation, may not be so critical at the functional level in the short term. Among the potential explanations for this finding is the existence of compensatory synaptic and cellular pruning of malfunctioning neurons. Excessive pruning in those adolescents could represent an appropriate response to a dysfunctional mechanism for establishing cortical representations.12,24
Differences in brain volume changes between different subtypes of adolescent-onset psychosis were not observed in the present study. The group of “nonschizophrenia psychotic disorders” showed no pattern distinct from the schizophrenia group. If differences appear after a longer follow-up, therefore implying that early phases of psychosis are less differentiated, this will need to be tested in longer term studies.
The present report has several limitations. Firstly, the follow-up period was short and included only one follow-up point, which may not be fully representative of the complex overall pattern of brain changes in adolescents, considering the large individual variability observed in longitudinal studies.20 Secondly, the small sample size, especially with respect to females, limits the generalization of our results. For this reason, negative findings in females should be interpreted with caution as the study was underpowered to detect change in women due to limited sample size. Thirdly, absent a medication-free comparison group, an impact of antipsychotic medication on our longitudinal findings cannot be ruled out. Finally, our measurement protocol restricted to brain lobes constrains findings to large-scale changes in the brain. Use of voxel-based methods would complement our study, allowing the analysis of small-scale regional gray and WM volume abnormalities not necessarily related to major subdivision in brain lobes. Strengths of the study include the short duration of disease, and short antipsychotic treatment prior to scanning, and homogeneity of the patient and control samples, which limits the impact of sociodemographic factors and maturational processes on findings. The length of the follow-up period was also carefully set the same for all participants, thus reducing the confounding factors affecting the analysis of longitudinal changes.
In conclusion, this study lends further support to the extant literature on frontal GM deficits after the first episode of psychosis. Patients featured in this study were adolescents with less than 6 months since onset of illness, followed for 2 years after their first psychotic episode. Progression of brain change was statistically significant only in male patients, although female patients showed similar rates of change over time. Improvement in clinical status was not associated with brain changes. Differences between patients and controls in the brain regions showing significant changes seemed to be the same in patients with schizophrenia and patients with other psychotic diagnoses. Longer follow-up studies will help to determine whether such changes are limited to adolescence or progress into adulthood.
Funding
Ministerio de Sanidad y Consumo; Instituto de Salud Carlos III (RETICS RD06/0011, REM-TAP Network, FIS PI052271, CIBER CB06/01/0079); Ministerio de Industria (CDTEAM Programa CENIT).
References
- 1.Steen RG, Mull C, McClure R, Hamer RM, Lieberman JA. Brain volume in first-episode schizophrenia: systematic review and meta-analysis of magnetic resonance imaging studies. Br J Psychiatry. 2006;188:510–518. doi: 10.1192/bjp.188.6.510. [DOI] [PubMed] [Google Scholar]
- 2.Vita A, De Peri L, Silenzi C, Dieci M. Brain morphology in first-episode schizophrenia: a meta-analysis of quantitative magnetic resonance imaging studies. Schizophr Res. 2006;82:75–88. doi: 10.1016/j.schres.2005.11.004. [DOI] [PubMed] [Google Scholar]
- 3.Fannon D, Chitnis X, Doku V, et al. Features of structural brain abnormality detected in first-episode psychosis. Am J Psychiatry. 2000;157:1829–1834. doi: 10.1176/appi.ajp.157.11.1829. [DOI] [PubMed] [Google Scholar]
- 4.Kuroki N, Shenton ME, Salisbury DF, et al. Middle and inferior temporal gyrus gray matter volume abnormalities in first-episode schizophrenia: an MRI study. Am J Psychiatry. 2006;163:2103–2110. doi: 10.1176/appi.ajp.163.12.2103. [DOI] [PMC free article] [PubMed] [Google Scholar]
- 5.Shenton ME, Dickey CC, Frumin M, McCarley RW. A review of MRI findings in schizophrenia. Schizophr Res. 2001;49:1–52. doi: 10.1016/s0920-9964(01)00163-3. [DOI] [PMC free article] [PubMed] [Google Scholar]
- 6.Honea R, Crow TJ, Passingham D, Mackay CE. Regional deficits in brain volume in schizophrenia: a meta-analysis of voxel-based morphometry studies. Am J Psychiatry. 2005;162:2233–2245. doi: 10.1176/appi.ajp.162.12.2233. [DOI] [PubMed] [Google Scholar]
- 7.Kumra S, Giedd JN, Vaituzis AC, et al. Childhood-onset psychotic disorders: magnetic resonance imaging of volumetric differences in brain structure. Am J Psychiatry. 2000;157:1467–1474. doi: 10.1176/appi.ajp.157.9.1467. [DOI] [PubMed] [Google Scholar]
- 8.Friedman L, Findling RL, Kenny JT, et al. An MRI study of adolescent patients with either schizophrenia or bipolar disorder as compared to healthy control subjects. Biol Psychiatry. 1999;46:78–88. doi: 10.1016/s0006-3223(98)00351-5. [DOI] [PubMed] [Google Scholar]
- 9.Sowell ER, Toga AW, Asarnow R. Brain abnormalities observed in childhood-onset schizophrenia: a review of the structural magnetic resonance imaging literature. Ment Retard Dev Disabil Res Rev. 2000;6:180–185. doi: 10.1002/1098-2779(2000)6:3<180::AID-MRDD5>3.0.CO;2-I. [DOI] [PubMed] [Google Scholar]
- 10.Moreno D, Burdalo M, Reig S, et al. Structural neuroimaging in adolescents with a first psychotic episode. J Am Acad Child Adolesc Psychiatry. 2005;44:1151–1157. doi: 10.1097/01.chi.0000179055.46795.3f. [DOI] [PubMed] [Google Scholar]
- 11.Weinberger DR, McClure RK. Neurotoxicity, neuroplasticity, and magnetic resonance imaging morphometry: what is happening in the schizophrenic brain? Arch Gen Psychiatry. 2002;59:553–558. doi: 10.1001/archpsyc.59.6.553. [DOI] [PubMed] [Google Scholar]
- 12.Cahn W, Hulshoff Pol HE, Lems EB, et al. Brain volume changes in first-episode schizophrenia: a 1-year follow-up study. Arch Gen Psychiatry. 2002;59:1002–1010. doi: 10.1001/archpsyc.59.11.1002. [DOI] [PubMed] [Google Scholar]
- 13.Gur RE, Cowell P, Turetsky BI, et al. A follow-up magnetic resonance imaging study of schizophrenia. Relationship of neuroanatomical changes to clinical and neurobehavioral measures. Arch Gen Psychiatry. 1998;55:145–152. doi: 10.1001/archpsyc.55.2.145. [DOI] [PubMed] [Google Scholar]
- 14.Whitford TJ, Grieve SM, Farrow TF, et al. Progressive grey matter atrophy over the first 2-3 years of illness in first-episode schizophrenia: a tensor-based morphometry study. Neuroimage. 2006;32:511–519. doi: 10.1016/j.neuroimage.2006.03.041. [DOI] [PubMed] [Google Scholar]
- 15.Lieberman J, Chakos M, Wu H, et al. Longitudinal study of brain morphology in first episode schizophrenia. Biol Psychiatry. 2001;49:487–499. doi: 10.1016/s0006-3223(01)01067-8. [DOI] [PubMed] [Google Scholar]
- 16.DeLisi LE, Hoff AL. Failure to find progressive temporal lobe volume decreases 10 years subsequent to a first episode of schizophrenia. Psychiatry Res. 2005;138:265–268. doi: 10.1016/j.pscychresns.2005.02.005. [DOI] [PubMed] [Google Scholar]
- 17.Dickey CC, Salisbury DF, Nagy AI, et al. Follow-up MRI study of prefrontal volumes in first-episode psychotic patients. Schizophr Res. 2004;71:349–351. doi: 10.1016/j.schres.2004.04.010. [DOI] [PMC free article] [PubMed] [Google Scholar]
- 18.Whitworth AB, Kemmler G, Honeder M, et al. Longitudinal volumetric MRI study in first- and multiple-episode male schizophrenia patients. Psychiatry Res. 2005;140:225–237. doi: 10.1016/j.pscychresns.2005.07.006. [DOI] [PubMed] [Google Scholar]
- 19.Price G, Cercignani M, Bagary MS, et al. A volumetric MRI and magnetization transfer imaging follow-up study of patients with first-episode schizophrenia. Schizophr Res. 2006;87:100–108. doi: 10.1016/j.schres.2006.06.019. [DOI] [PMC free article] [PubMed] [Google Scholar]
- 20.Sporn AL, Greenstein DK, Gogtay N, et al. Progressive brain volume loss during adolescence in childhood-onset schizophrenia. Am J Psychiatry. 2003;160:2181–2189. doi: 10.1176/appi.ajp.160.12.2181. [DOI] [PubMed] [Google Scholar]
- 21.Gogtay N, Sporn A, Clasen LS, et al. Comparison of progressive cortical gray matter loss in childhood-onset schizophrenia with that in childhood-onset atypical psychoses. Arch Gen Psychiatry. 2004;61:17–22. doi: 10.1001/archpsyc.61.1.17. [DOI] [PubMed] [Google Scholar]
- 22.Rapoport JL, Giedd J, Kumra S, et al. Childhood-onset schizophrenia. Progressive ventricular change during adolescence. Arch Gen Psychiatry. 1997;54:897–903. doi: 10.1001/archpsyc.1997.01830220013002. [DOI] [PubMed] [Google Scholar]
- 23.Rapoport JL, Giedd JN, Blumenthal J, et al. Progressive cortical change during adolescence in childhood-onset schizophrenia. A longitudinal magnetic resonance imaging study. Arch Gen Psychiatry. 1999;56:649–654. doi: 10.1001/archpsyc.56.7.649. [DOI] [PubMed] [Google Scholar]
- 24.Thompson PM, Vidal C, Giedd JN, et al. Mapping adolescent brain change reveals dynamic wave of accelerated gray matter loss in very early-onset schizophrenia. Proc Natl Acad Sci U S A. 2001;98:11650–11655. doi: 10.1073/pnas.201243998. [DOI] [PMC free article] [PubMed] [Google Scholar]
- 25.Vidal CN, Rapoport JL, Hayashi KM, et al. Dynamically spreading frontal and cingulate deficits mapped in adolescents with schizophrenia. Arch Gen Psychiatry. 2006;63:25–34. doi: 10.1001/archpsyc.63.1.25. [DOI] [PubMed] [Google Scholar]
- 26.James AC, Javaloyes A, James S, Smith DM. Evidence for non-progressive changes in adolescent-onset schizophrenia: follow-up magnetic resonance imaging study. Br J Psychiatry. 2002;180:339–344. doi: 10.1192/bjp.180.4.339. [DOI] [PubMed] [Google Scholar]
- 27.James AC, James S, Smith DM, Javaloyes A. Cerebellar, prefrontal cortex, and thalamic volumes over two time points in adolescent-onset schizophrenia. Am J Psychiatry. 2004;161:1023–1029. doi: 10.1176/appi.ajp.161.6.1023. [DOI] [PubMed] [Google Scholar]
- 28.Hollingshead AB, Redlich FC. Schizophrenia and social structure. Am J Psychiatry. 1954;110:695–701. doi: 10.1176/ajp.110.9.695. [DOI] [PubMed] [Google Scholar]
- 29.Kaufman J, Birmaher B, Brent D, et al. Schedule for affective disorders and schizophrenia for school-age children-present and lifetime version (K-SADS-PL): initial reliability and validity data. J Am Acad Child Adolesc Psychiatry. 1997;36:980–988. doi: 10.1097/00004583-199707000-00021. [DOI] [PubMed] [Google Scholar]
- 30.Endicott J, Spitzer RL, Fleiss JL, Cohen J. The global assessment scale. A procedure for measuring overall severity of psychiatric disturbance. Arch Gen Psychiatry. 1976;33:766–771. doi: 10.1001/archpsyc.1976.01770060086012. [DOI] [PubMed] [Google Scholar]
- 31.Kay SR, Fiszbein A, Opler LA. The positive and negative syndrome scale (PANSS) for schizophrenia. Schizophr Bull. 1987;13:261–276. doi: 10.1093/schbul/13.2.261. [DOI] [PubMed] [Google Scholar]
- 32.Peralta V, Cuesta MJ. Psychometric properties of the positive and negative syndrome scale (PANSS) in schizophrenia. Psychiatry Res. 1994;53:31–40. doi: 10.1016/0165-1781(94)90093-0. [DOI] [PubMed] [Google Scholar]
- 33.Strauss JS, Carpenter WT., Jr The prediction of outcome in schizophrenia. I. Characteristics of outcome. Arch Gen Psychiatry. 1972;27:739–746. doi: 10.1001/archpsyc.1972.01750300011002. [DOI] [PubMed] [Google Scholar]
- 34.Buchanan RW, Heinrichs DW. The Neurological Evaluation Scale (NES): a structured instrument for the assessment of neurological signs in schizophrenia. Psychiatry Res. 1989;27:335–350. doi: 10.1016/0165-1781(89)90148-0. [DOI] [PubMed] [Google Scholar]
- 35.Andreasen NC, Rajarethinam R, Cizadlo T, et al. Automatic atlas-based volume estimation of human brain regions from MR images. J Comput Assist Tomogr. 1996;20:98–106. doi: 10.1097/00004728-199601000-00018. [DOI] [PubMed] [Google Scholar]
- 36.Kates WR, Warsofsky IS, Patwardhan A, et al. Automated Talairach atlas-based parcellation and measurement of cerebral lobes in children. Psychiatry Res. 1999;91:11–30. doi: 10.1016/s0925-4927(99)00011-6. [DOI] [PubMed] [Google Scholar]
- 37.Desco M, Pascau J, Reig S, et al. Multimodality Image Quantification Using Talairach Grid. Paper Presented at Proceedings of SPIE Medical Imaging. 2001; San Diego, CA: SPIE; vol4422:1385-1392. [Google Scholar]
- 38.Ho BC, Andreasen NC, Nopoulos P, Arndt S, Magnotta V, Flaum M. Progressive structural brain abnormalities and their relationship to clinical outcome: a longitudinal magnetic resonance imaging study early in schizophrenia. Arch Gen Psychiatry. 2003;60:585–594. doi: 10.1001/archpsyc.60.6.585. [DOI] [PubMed] [Google Scholar]
- 39.Molina V, Reig S, Sanz J, et al. Increase in gray matter and decrease in white matter volumes in the cortex during treatment with atypical neuroleptics in schizophrenia. Schizophr Res. 2005;80:61–71. doi: 10.1016/j.schres.2005.07.031. [DOI] [PubMed] [Google Scholar]
- 40.Ashburner J, Friston KJ. Multimodal image coregistration and partitioning—a unified framework. Neuroimage. 1997;6:209–217. doi: 10.1006/nimg.1997.0290. [DOI] [PubMed] [Google Scholar]
- 41.Talairach J, Tournoux P. Co-planar Stereotaxic Atlas of the Human Brain. New York, NY: Thieme Medical; 1988. [Google Scholar]
- 42.Ashburner J, Friston KJ. Voxel-based morphometry–the methods. Neuroimage. 2000;11:805–821. doi: 10.1006/nimg.2000.0582. [DOI] [PubMed] [Google Scholar]
- 43.Lenroot RK, Gogtay N, Greenstein DK, et al. Sexual dimorphism of brain developmental trajectories during childhood and adolescence. Neuroimage. 2007;36:1065–1073. doi: 10.1016/j.neuroimage.2007.03.053. [DOI] [PMC free article] [PubMed] [Google Scholar]
- 44.Pfefferbaum A, Mathalon DH, Sullivan EV, Rawles JM, Zipursky RB, Lim KO. A quantitative magnetic resonance imaging study of changes in brain morphology from infancy to late adulthood. Arch Neurol. 1994;51:874–887. doi: 10.1001/archneur.1994.00540210046012. [DOI] [PubMed] [Google Scholar]
- 45.Mathalon DH, Sullivan EV, Lim KO, Pfefferbaum A. Progressive brain volume changes and the clinical course of schizophrenia in men: a longitudinal magnetic resonance imaging study. Arch Gen Psychiatry. 2001;58:148–157. doi: 10.1001/archpsyc.58.2.148. [DOI] [PubMed] [Google Scholar]
- 46.Nopoulos P, Flaum M, O'Leary D, Andreasen NC. Sexual dimorphism in the human brain: evaluation of tissue volume, tissue composition and surface anatomy using magnetic resonance imaging. Psychiatry Res. 2000;98:1–13. doi: 10.1016/s0925-4927(99)00044-x. [DOI] [PubMed] [Google Scholar]
- 47.Goldstein JM, Seidman LJ, O'Brien LM, et al. Impact of normal sexual dimorphisms on sex differences in structural brain abnormalities in schizophrenia assessed by magnetic resonance imaging. Arch Gen Psychiatry. 2002;59:154–164. doi: 10.1001/archpsyc.59.2.154. [DOI] [PubMed] [Google Scholar]
- 48.Sowell ER, Peterson BS, Thompson PM, Welcome SE, Henkenius AL, Toga AW. Mapping cortical change across the human life span. Nat Neurosci. 2003;6:309–315. doi: 10.1038/nn1008. [DOI] [PubMed] [Google Scholar]
- 49.Jernigan TL, Trauner DA, Hesselink JR, Tallal PA. Maturation of human cerebrum observed in vivo during adolescence. Brain. 1991;114:2037–2049. doi: 10.1093/brain/114.5.2037. [DOI] [PubMed] [Google Scholar]
- 50.Nopoulos P, Flaum M, Andreasen NC. Sex differences in brain morphology in schizophrenia. Am J Psychiatry. 1997;154:1648–1654. doi: 10.1176/ajp.154.12.1648. [DOI] [PubMed] [Google Scholar]
- 51.Molina V, Sanz J, Sarramea F, Misiego JM, Benito C, Palomo T. Association between excessive frontal cerebrospinal fluid and illness duration in males but not in females with schizophrenia. Eur Psychiatry. 2005;20:332–338. doi: 10.1016/j.eurpsy.2004.11.015. [DOI] [PubMed] [Google Scholar]
- 52.Salokangas RK, Cannon T, Van Erp T, et al. Structural magnetic resonance imaging in patients with first-episode schizophrenia, psychotic and severe non-psychotic depression and healthy controls. Results of the schizophrenia and affective psychoses (SAP) project. Br J Psychiatry Suppl. 2002;43:s58–s65. doi: 10.1192/bjp.181.43.s58. [DOI] [PubMed] [Google Scholar]
- 53.Hirayasu Y, Tanaka S, Shenton ME, et al. Prefrontal gray matter volume reduction in first episode schizophrenia. Cereb Cortex. 2001;11:374–381. doi: 10.1093/cercor/11.4.374. [DOI] [PubMed] [Google Scholar]
- 54.Cannon TD, van Erp TG, Huttunen M, et al. Regional gray matter, white matter, and cerebrospinal fluid distributions in schizophrenic patients, their siblings, and controls. Arch Gen Psychiatry. 1998;55:1084–1091. doi: 10.1001/archpsyc.55.12.1084. [DOI] [PubMed] [Google Scholar]
- 55.Narr KL, Bilder RM, Woods RP, et al. Regional specificity of cerebrospinal fluid abnormalities in first episode schizophrenia. Psychiatry Res. 2006;146:21–33. doi: 10.1016/j.pscychresns.2005.10.005. [DOI] [PubMed] [Google Scholar]
- 56.Greenstein D, Lerch J, Shaw P, et al. Childhood onset schizophrenia: cortical brain abnormalities as young adults. J Child Psychol Psychiatry. 2006;47:1003–1012. doi: 10.1111/j.1469-7610.2006.01658.x. [DOI] [PubMed] [Google Scholar]
- 57.Cannon TD, Mednick SA, Parnas J. Genetic and perinatal determinants of structural brain deficits in schizophrenia. Arch Gen Psychiatry. 1989;46:883–889. doi: 10.1001/archpsyc.1989.01810100025005. [DOI] [PubMed] [Google Scholar]
- 58.Keshavan MS, Anderson S, Pettegrew JW. Is schizophrenia due to excessive synaptic pruning in the prefrontal cortex? The Feinberg hypothesis revisited. J Psychiatr Res. 1994;28:239–265. doi: 10.1016/0022-3956(94)90009-4. [DOI] [PubMed] [Google Scholar]
- 59.Huttenlocher PR, Dabholkar AS. Regional differences in synaptogenesis in human cerebral cortex. J Comp Neurol. 1997;387:167–178. doi: 10.1002/(sici)1096-9861(19971020)387:2<167::aid-cne1>3.0.co;2-z. [DOI] [PubMed] [Google Scholar]
- 60.Cannon TD, Thompson PM, van Erp TG, et al. Cortex mapping reveals regionally specific patterns of genetic and disease-specific gray-matter deficits in twins discordant for schizophrenia. Proc Natl Acad Sci U S A. 2002;99:3228–3233. doi: 10.1073/pnas.052023499. [DOI] [PMC free article] [PubMed] [Google Scholar]
- 61.Pantelis C, Velakoulis D, McGorry PD, et al. Neuroanatomical abnormalities before and after onset of psychosis: a cross-sectional and longitudinal MRI comparison. Lancet. 2003;361:281–288. doi: 10.1016/S0140-6736(03)12323-9. [DOI] [PubMed] [Google Scholar]
- 62.McGlashan TH. Is active psychosis neurotoxic? Schizophr Bull. 2006;32:609–613. doi: 10.1093/schbul/sbl032. [DOI] [PMC free article] [PubMed] [Google Scholar]
- 63.DeLisi LE, Stritzke P, Riordan H, et al. The timing of brain morphological changes in schizophrenia and their relationship to clinical outcome. Biol Psychiatry. 1992;31:241–254. doi: 10.1016/0006-3223(92)90047-4. [DOI] [PubMed] [Google Scholar]
- 64.Paillere-Martinot M, Caclin A, Artiges E, et al. Cerebral gray and white matter reductions and clinical correlates in patients with early onset schizophrenia. Schizophr Res. 2001;50:19–26. doi: 10.1016/s0920-9964(00)00137-7. [DOI] [PubMed] [Google Scholar]