Abstract
The adaptive immune response and, in particular, T cells have been shown to be important in the genesis of hypertension. In the present study, we sought to determine how the interplay between ANG II, NADPH oxidase, and reactive oxygen species modulates T cell activation and ultimately causes hypertension. We determined that T cells express angiotensinogen, the angiotensin I-converting enzyme, and renin and produce physiological levels of ANG II. AT1 receptors were primarily expressed intracellularly, and endogenously produced ANG II increased T-cell activation, expression of tissue homing markers, and production of the cytokine TNF-α. Inhibition of T-cell ACE reduced TNF-α production, indicating endogenously produced ANG II has a regulatory role in this process. Studies with specific antagonists and T cells from AT1R and AT2R-deficient mice indicated that both receptor subtypes contribute to TNF-α production. We found that superoxide was a critical mediator of T-cell TNF-α production, as this was significantly inhibited by polyethylene glycol (PEG)-SOD, but not PEG-catalase. Thus, T cells contain an endogenous renin-angiotensin system that modulates T-cell function, NADPH oxidase activity, and production of superoxide that, in turn, modulates TNF-α production. These findings contribute to our understanding of how ANG II and T cells enhance inflammation in cardiovascular disease.
Keywords: cytokines, TNF-α, electron spin resonance, adoptive transfer, NADPH oxidase, superoxide
the renin-angiotensin system (RAS) is a prominent mediator of hypertension and a key target in the treatment of this disease. ANG II has myriad effects on the cardiovascular system. In many tissues, ANG II activates the NADPH oxidase to produce reactive oxygen species (ROS) (16). In the cardiovascular system, this effect of ANG II has been linked to the induction of cardiac hypertrophy, inflammation, lipid oxidation, endothelial dysfunction, and ultimately increased blood pressure (4).
We have recently demonstrated that the T cell plays an important role in the development of hypertension (18). ANG II increases T-cell activation, production of proinflammatory cytokines, and infiltration into perivascular fat. At this site, the T cell can produce cytokines and release other mediators that affect the smooth muscle cells and endothelium of the adjacent vessel. In this prior study, we demonstrated that the TNF-α antagonist, etanercept prevented ANG II-induced increase in blood pressure and vascular superoxide production, suggesting an important role of this cytokine in hypertension.
In addition to the classical components required for T cell function, T cells express other proteins not typically associated with immune responses, suggesting alternate physiological and pathological roles for the T cell. For example, T cells contain components of the RAS such as the ANG I-converting enzyme (ACE) (6), renin, the renin receptor, and angiotensinogen (Agt) (24). This suggests that T cells may be able to produce ANG II and thus contribute to the local RAS in tissues, however, T-cell production of ANG II has not yet been demonstrated.
Because of the established contributions of ANG II, NADPH oxidase, and ROS to hypertension, we sought to determine whether these mediators were involved in modulation of T cell function. Our findings indicate that T cells have a functional RAS, that they produce ANG II and that the majority of AT1 receptors are expressed within the T cell, suggesting an intracrine RAS. Our results demonstrate that ANG II has direct actions on T cell function, including activation, expression of tissue-homing markers, and production of TNF-α. We further identified a role of the T cell NADPH oxidase and superoxide production in this ANG II-dependent modulation of T cell function.
METHODS
Animals.
Mice were maintained in the Emory Animal Facility under standard conditions (12:12-h light-dark cycle, 20°C room temperature), and were given Purina Rodent Chow 5001 diet and water ad libitum. The Institutional Animal Care and Use Committee at Emory University approved all experimental protocols. C57BL/6 and RAG1−/− mice were obtained from Jackson Laboratories. The p47phox−/− mice and their appropriate controls were obtained from Taconic. AT2R−/− mice were bred from animals provided by Dr. Tadashi Inagami (Vanderbilt University). All mice were on a C57BL/6 background. ANG II (490 ng·min−1·kg−1) was infused, and blood pressure was measured noninvasively as described previously (44). For adoptive transfer, mice were anesthetized with xylazine/ketamine, and cells were injected via tail vein. ANG II infusion, and blood pressure monitoring was begun 3 wk after adoptive transfer.
T-cell isolation and culture.
CD4+, CD8+, or all T cells were isolated from peripheral blood mononuclear cells (PBMC) and spleens as previously described (18). Briefly, spleens were removed and disrupted using forceps to release a single cell suspension that was passed through a 70-μm sterile strainer. Total blood leukocytes were isolated from whole heparinized blood, following osmotic lysis of excess red blood cells. Cells were centrifuged (800 g) and washed twice with PBS. For purified T-cell separation, splenocytes or PBMC were isolated from donor mice and were purified using auto-MACS and either CD4+, CD8+, or Pan T cell isolation kits (Miltenyi Biotech, Auburn, CA). Cell purity was confirmed by FACS analysis to be ≥ 99% by staining a fraction of the isolated T cells with a fluorescent anti-CD3 antibody. T cells were cultured as previously described (18). Briefly, 2 × 10⁵ cells in 100 μl of media were seeded on 96-well plates coated with anti-CD3 antibodies (BD Biosciences, San Jose, CA), with or without additional treatments, and cultured for various times as indicated for each experiment.
Quantitative real-time and standard PCR.
RNA was extracted from either T cells or indicated tissues using TriZOL (Invitrogen, Carlsbad, CA), and purified using procedure with the Qiagen RNeasy Kit. Following purification, 1 μg was reverse-transcribed using random hexamers and Superscript III (Invitrogen). The resulting cDNA was purified with the PCR Purification Kit (Qiagen). Quantitative expression of each gene of interest was determined using real-time PCR fluorescent probes and primers, which are proprietary products from Applied Biosystems. Each reaction was performed in a total volume of 20 μl, which included 2 μl cDNA, 1 μl TaqMan primers and probes, 7 μl nuclease-free water, and 10 μl TaqMan Gene Expression Master Mix. Samples were run in triplicate, along with negative water controls. Standard curves for these assays were generated using DNA targets amplified from mouse kidney cDNA using standard PCR primers (Sigma-Genosys, St. Louis, MO) that flank the Taqman assay location, and PuReTaq Ready-to-Go PCR beads (GE Healthcare, Piscataway, NJ). For expression of AT2 receptors, standard PCR techniques were employed using the following primers designed against the murine sequence for the receptor (accession number NM_007429): forward 5′-AGAAGGAATCCCTGGCAAGC; reverse 5′-CAAACCAATGGCTAGGCTG. This primer set amplified a target 756 base pairs in length, which was isolated using 2% agarose and visualized using Quantity One software and a Gel-Doc system (both Bio-Rad, Hercules, CA).
Extracellular and intracellular flow cytometry.
After T cell isolation, cells were centrifuged at 800 g, washed twice with PBS, 0.5% BSA (FACS buffer), counted and resuspended in 1% BSA PBS, and stored on ice less than 30 min. Within 30 min, 106 cells were stained for 20–60 min at 4°C with antibodies and washed twice with FACS buffer. Antibodies used for staining were as follows and used in different combinations, depending on the experiment: APC anti-CD44 (GK1.5); PerCP anti-CD8 (53-6.7); PE CCR5; FITC CD69 (H1.2F3), from BD Biosciences; AT1 receptor N-10 antibody, AT2 receptor H-143 receptor antibody, or rabbit IgG isotype control, from Santa Cruz. For receptor expression, a secondary antibody incubation was performed (FITC-conjugated secondary goat-anti-rabbit antibody, Santa Cruz) for 60 min at 4°C. Intracellular staining was also performed for receptor expression using a fixation/permeabilization kit (eBioscience, San Diego, CA). Cells were washed, followed by fixation for 45 min with a 4% paraformaldehyde buffer from the kit and permeabilization for 10 min using a buffer provided in the kit containing 0.1% saponin and 0.009% sodium azide. Cells were then stained with primary antibodies (1 μg/ml), incubating for 60 min at 4°C, followed by a wash with FACS buffer. Cells were then incubated with a FITC-conjugated secondary goat-anti-rabbit antibody (Santa Cruz, 1 μg/ml) for 60 min at 4°C, followed by two washes with FACS buffer. Following extracellular and intracellular immunostaining procedures, cells were resuspended in FACS buffer and analyzed immediately on an LSR-II flow cytometer with DIVA software (Becton Dickinson, Franklin Lakes, NJ). Data were analyzed with Flowjo software (Treestar, Ashland, OR).
Measurement of ANG II and cytokine production.
ANG II production was measured in media from cultured cells using the ANG II enzyme immunoassay kit (SPI-Bio, Cayman Chemicals, Ann Arbor, MI). A standard curve, negative controls (blank wells with Ellman's developing reagent), negative binding wells that only received anti-angiotensin II Fab′ monoclonal antibody labeled with acetylcholinesterase (wells treated with culturing media), and positive controls (wells containing 9.5 pg/myocardial ANG II) were run in each experiment. Samples were loaded in duplicate and quantified by absorbance at 405 nm. The picogram per milliliter value for each sample was calculated by using the A405corr readings in the linear formula obtained from the standard curve. Cytokine production of T cells were measured using the cytometric bead array (BD Biosciences, San Jose, CA), as previously described (18). Briefly, T cells were cultured 48 h, and the media samples were collected for analysis of the amount of secreted TNF-α, IFN-γ, IL-2, IL-4, and IL-5.
Measurement of superoxide using electron spin resonance.
For detection of O2·− the spin probe 1-hydroxy-4-methoxy-2,2,6,6-tetramethylpiperidine (TMH) was used as previously described (43). T cells were cultured 3 h with or without 1 μmol/l perindopril in 24-well dishes in 1 × 10⁶ cells/ml of media. Cells were pelleted, and following removal of the media, they were resuspended in Krebs-HEPES buffer (pH 7.35) containing 50 μM DF and 5 μM DETC to a final concentration of 1.5 × 10⁶ cells per 100 μl. The TMH spin probe was dissolved to 0.5 mmol/l in 0.9% NaCl with Chelex containing 50 μM DF and 5 μM DETC and used at a final concentration of 50 μmol/l. The dissolved spin probe was continuously bubbled with argon gas prior to use. ESR spectra were recorded using a Bruker EMX spectrometer using the following settings; field sweep, 80 G; microwave frequency, 9.39 GHz; microwave power, 2 mW; modulation amplitude, 5 G; conversion time, 327.68 ms; time constant, 5,242.88 ms; 512 points resolution; and receiver gain, 1 × 10⁴.
AT2R−/− adoptive transfer, ANG II infusion, and measurement of blood pressure.
RAG-1−/− mice underwent adoptive transfer of 107 T cells from either C57BL/6 or AT2−/− mice via tail vein injection as previously described (18). After allowing 3 wk for T-cell engraftment, subcutaneous osmotic pumps were then implanted for administration of 490 ng·min−1·kg−1 ANG II, after which T cells from spleens were harvested and stained for T cells markers to verify reconstitution of the T-cell population using flow cytometry.
Blood pressure was measured using the tail cuff approach with a device specifically designed for mice (Hatteras Instruments, Cary, NC). All tail-cuff measurements were acquired between 8 and 10 AM each day. Animals were accustomed to the device for 5 days before data were acquired. Baseline (prepump implantation) measurements were obtained for two consecutive days, and measurements were averaged. Day 1 was counted as the day pumps were implanted. Values were again obtained on days 6 and 7 and their average presented as day 7 measurements. Finally, pressures were again measured on days 13 and 14 and presented as day 14 measurements. Blood pressure measurements on RAG-1−/− mice following adoptive transfer of T cells from C57BL/6 mice, RAG-1−/− mice after adoptive transfer of AT2R−/− T cells were performed in parallel and compared with similar measurements in ANG II-treated C57BL/6 mice studied during this same period.
Statistical methods.
For data involving comparisons of two groups, a Student's one-tailed t-test was used. When comparing the effect of an intervention, paired analysis was performed, as T cells taken from each mouse were divided into untreated and treated groups. For comparisons between more than two groups, one-way or two-way ANOVA was employed. P values <0.05 were accepted as significantly different. When ANOVA indicated significant differences, the Student-Newman-Keuls post hoc test was used for comparison of multiple groups, the Bonferroni test was used for selected comparisons, and the Dunnett's test was used for repeated-measures analysis.
RESULTS
T-cell response to exogenous and endogenous ANG II—variations in spleen vs. blood-derived cells.
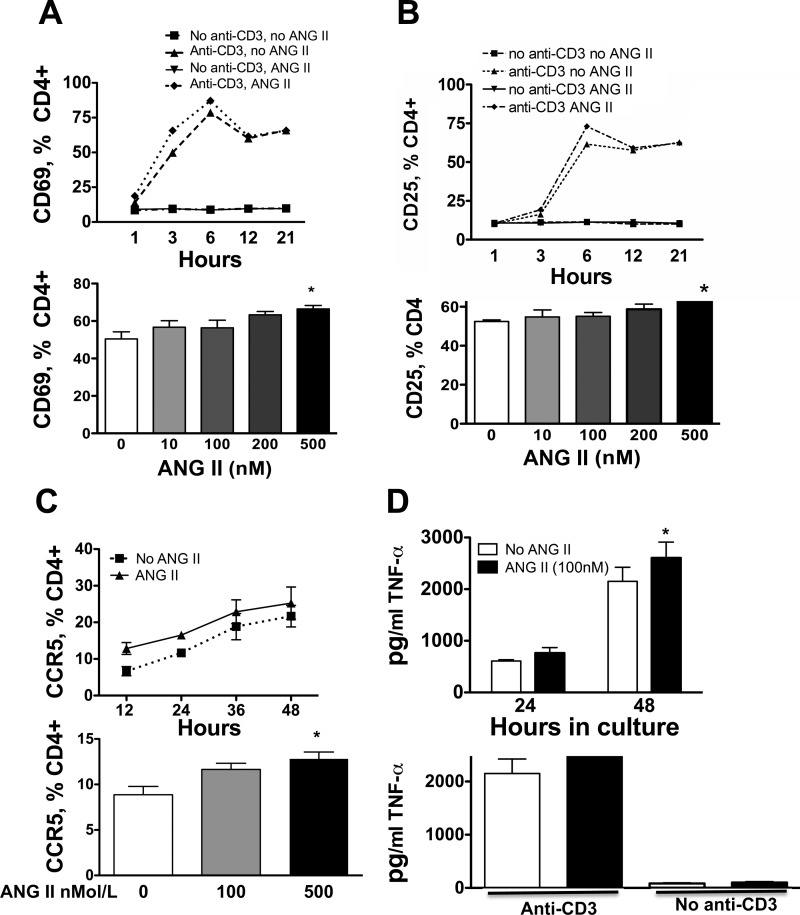
To examine the effect of ANG II on T cells, T cells were isolated from the spleen and peripheral blood, purified and cultured in plates containing anti-CD3 in the presence or absence of ANG II. In preliminary studies of spleen-derived cells, we found dose-dependent, albeit small increases in the acute surface marker CD69 after a 3-h exposure to ANG II (10–500 nmol/l, Fig. 1A), while CD25 was only minimally affected by 500 nmol/l ANG II in these cells (Fig. 1B). A slight increase in the cell surface homing marker, CCR5, was observed after 12-h exposure to 500 nmol/l ANG II (Fig. 1C). Likewise, TNF-α was modestly increased by ANG II in spleen-derived T cells (Fig. 1D), while IFN-γ, IL-5, IL-4, and IL-2 either did not change in response to ANG II or levels were too low to be detected. In the absence of anti-CD3, ANG II had no stimulatory effect, in keeping with the concept that this hormone acts as a costimulatory molecule for T cell activation (30).
Fig. 1.
Effect of ANG II on activation markers in spleen-derived T cells. Responses to varying concentrations and times of exposure to ANG II were analyzed for CD69 (A; n = 8), CD25 (B; n = 10), CCR5 (C; n = 4–8), and TNF-α production (D; n = 8). T cells were isolated from spleens of C57BL/6 mice, and 2 × 10⁵ cells were incubated with ANG II at the indicated doses and times. X axis in upper Panel C is in hours. For the time responses, 500 μM ANG II was employed. *P < 0.01 vs. no ANG II.
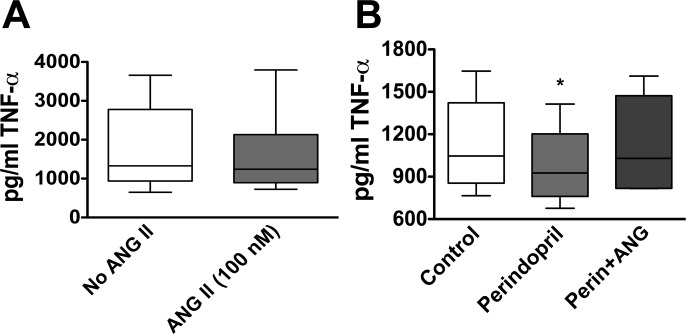
In contrast to the modest effect of exogenous ANG II on TNF-α production from spleen-derived T cells, we found that the addition of ANG II to blood-derived T cells in culture had no effect on this cytokine's production (Fig. 2A). Because T cells have been reported to express multiple components of the RAS, we considered the possibility that blood-derived T cells produce endogenous ANG II, which could self-activate the cells, and that exogenous ANG II might therefore have minimal additional effects. The addition of the ANG I-converting enzyme inhibitor perindopril (1 μmol/l) caused a significant decrease in TNF-α levels (Fig. 2B) in cells exposed to anti-CD3 without ANG II for 48 h. This decrease in TNF-α was reversed by the addition of ANG II (100 nmol/l) (Fig. 2B). Perindopril did not affect levels of other cytokines including IFN-γ, IL-2, IL-4, and IL-5 (data not shown).
Fig. 2.
The effects of ANG II on blood-derived T cell production of TNF-α. T cells were isolated by negative selection, and 2 × 10⁵ cells were placed in culture for 48 h. A: effect of exogenous ANG II on TNF-α production in circulating T cells. B: effect of the ANG I-converting enzyme inhibitor perindopril. The addition of ANG II restored the decrease in production of TNF-α caused by perindopril (n = 7). *P < 0.01 vs. control cells.
Production of ANG II by T cells—confirmation of an endogenous RAS.
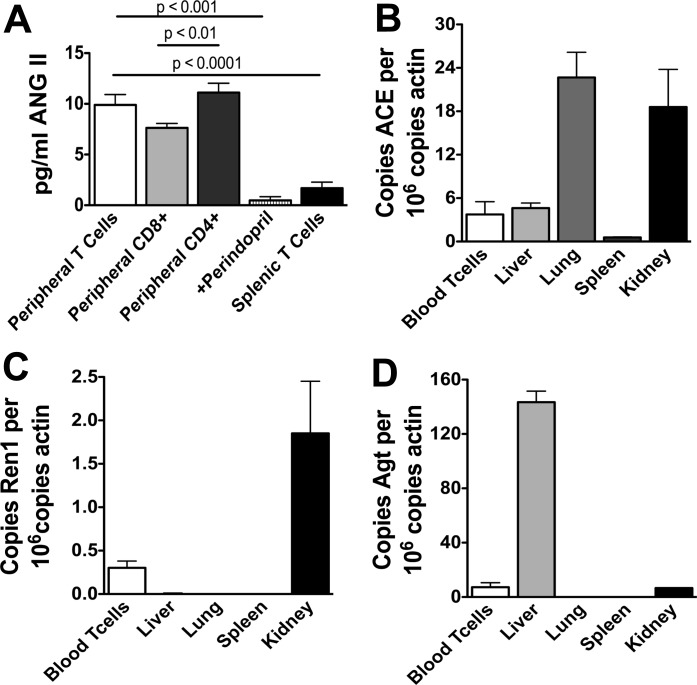
To confirm that T cells produce ANG II, we used ELISA to detect this octapeptide in the media of cultured T cells. Following 48 h of exposure to anti-CD3, blood-derived T cells released 10 ± 1.02 pg/ml/106 cells (Fig. 3A). Media alone contained no detectable ANG II. Moreover, T cell production of ANG II was completely prevented by perindopril, confirming specificity of this assay. Among blood-derived T cells, the CD4+ subset produced slightly more ANG II than CD8+ cells. Interestingly, T cells from the spleen produced significantly less ANG II compared with circulating T cells. Of interest, when we added 100 nmol/l of exogenous ANG II to cultured T cells, the amount of ANG II that was detected after 48 h in culture was 30 pg/ml. This is markedly less than the calculated amount that should have been present given the amount added and volume of the culture medium (1 μg/ml), indicating that there is likely marked degradation of ANG II in the culture.
Fig. 3.
Endogenous renin-angiotensin system in T cells. T cells from blood and spleen were harvested and cultured on anti-CD3 plates for 48 h and the release of ANG II into the media by ELISA (A, n = 4–10). In other experiments, T cells and other organs were harvested, and quantitative real-time PCR was used to quantify mRNA of the ANG I-converting enzyme (ACE; B), renin-1 (ren1; C), and angiotensinogen (Agt; D). B–D: mRNA levels in the various cells or tissues is normalized to actin mRNA.
It has been previously reported that T cells produce and possess all components of the RAS. Using real-time PCR, we were able to confirm that T cells express modest quantities of the ANG I-converting enzyme, equivalent to that observed in the liver (Fig. 3B). T cells also expressed small amounts of renin mRNA, which was much less than that of the kidney but greater than that found in the liver or lung (Fig. 3C). T cells also produced angiotensinogen, which again was less than that produced by the liver but greater than that produced by the lung and equivalent to that produced by the kidney (Fig. 3D).
Angiotensin receptors in T cells.
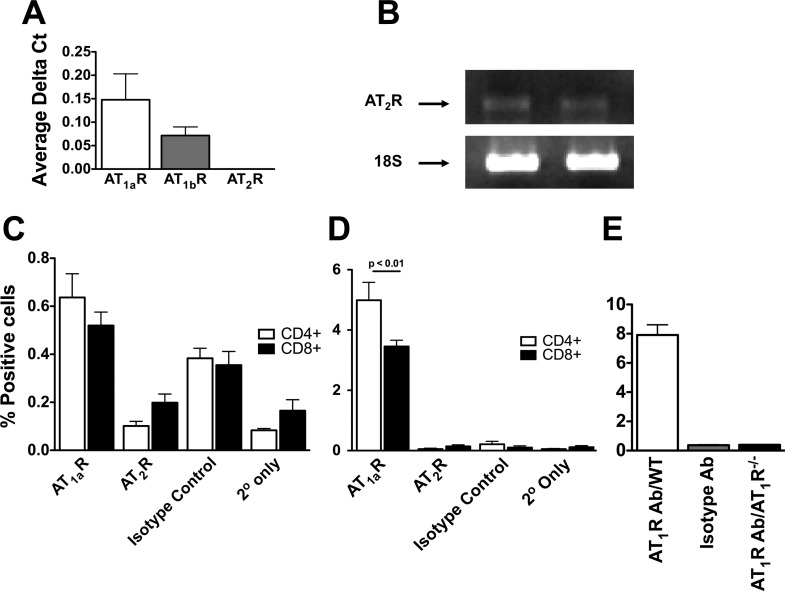
We also found that T cells express both AT1a and AT1b receptors using real-time PCR (Fig. 4A). While we were unable to detect the AT2 receptor using this approach, conventional PCR techniques identified mRNA for this receptor (Fig. 4B). We further examined the presence of AT1 and AT2 receptors using fluorescent cell sorting. Conventional surface staining resulted in barely detectable signals (∼0.06% expression of AT1R, 0.03% for isotype control, Fig. 4C). In contrast, intracellular staining revealed that within the CD4+ population of PBMCs, 5% of cells express the AT1a receptor, while 3.5% the CD8+ population expressed this receptor (Fig. 4D). The amount of AT2 receptor detected by FACS analysis using either surface or intracellular staining was minimal and barely above the staining of the isotype control. In additional control experiments, we found that AT1R−/− T cells had no intracellular staining for AT1 receptors (Fig. 4E).
Fig. 4.
ANG II receptors in T cells. Real-time PCR with Taqman primers and probe sets was used to detect AT1a, AT1b, and AT2 receptors in T cells (A). Because AT2 receptors were undetectable using Taqman primers, standard PCR was used to identify AT2 receptor and 18S mRNA in spleen-derived total T cells (B). Data shown are representative of four repeated experiments. Fluorescent cell sorting (FACS) was used to detect the AT1 receptor protein on CD4+ and CD8+ T cells (C; n = 6). Because minimal surface AT1 receptor protein was detected, additional experiments were performed using cell permeabilization to detect intracellular AT1 receptors (D; n = 3). E: comparison of intracellular staining for AT1R in WT and AT1R−/− T cells (n = 3).
Role of ANG II receptor activation on T-cell production of TNF-α.
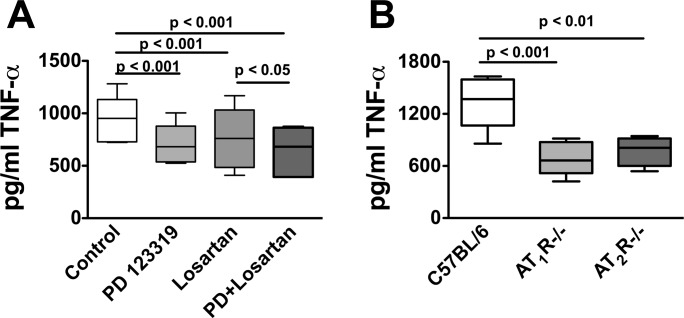
To gain further insight into the role of the AT1 receptor in T-cell function, peripheral blood T cells were cultured on anti-CD3 plates for 48 h in the presence or absence of the AT1 antagonist losartan (1 μmol/l). Losartan decreased production of TNF-α by 30% (Fig. 5A). Surprisingly, the AT2 antagonist PD123319 also decreased TNF-α production by a similar extent, and the combination of these antagonists had an additional effect compared with losartan alone (Fig. 5A). To avoid nonspecific pharmacological effects of losartan and PD123319, we performed additional experiments using T cells from both AT1R−/− and AT2R−/− mice (Fig. 5B). Cells from both of these animals produced 60% less TNF-α than cells from wild-type C57BL/6 mice. These findings confirm a role of ANG II receptors in modulating T cell production of TNF-α.
Fig. 5.
Role of AT1 and AT2 receptors in modulation of T cell TNF-α production. T cells were isolated by negative selection from blood, and 2 × 10⁵ cells were cultured on anti-CD3 plates for 48 h. Following this, TNF-α production was determined using ELISA in untreated cells, cells treated with the AT1R antagonist losartan, the AT2R antagonist PD 123319, or the combination of these antagonists (A; n = 6). Additional experiments were performed comparing the production of TNF-α between wild-type T cells, T cells from AT1R−/−, and AT2R−/− mice (B; n = 4–7).
In additional studies, we found that losartan had no effect on TNF-α production by T cells from AT1R−/− mice, and PD123319 had no effect on TNF-α production from cells of AT2R−/− mice (data not shown), indicating that the effects of these drugs on wild-type cells were unlikely nonspecific.
Role of the NADPH oxidase and ROS in modulation of T-cell production of TNF-α.
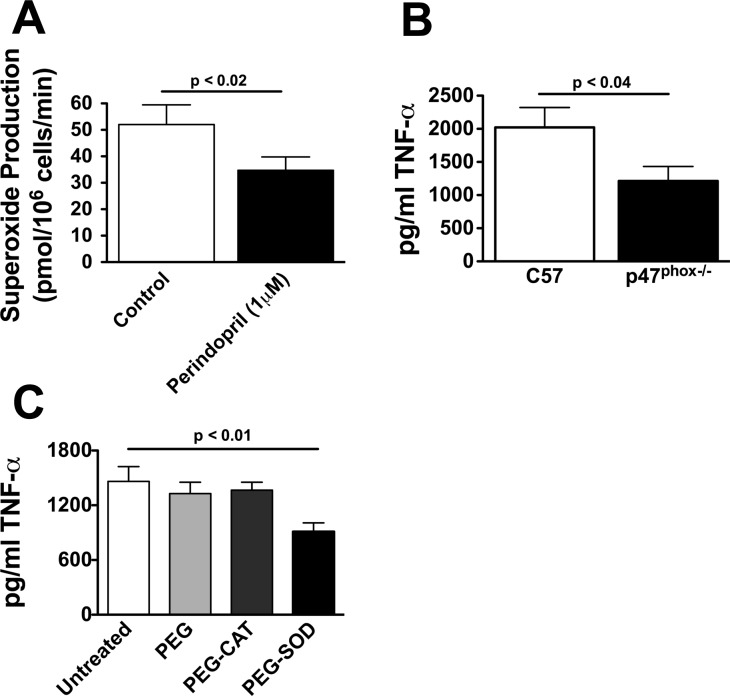
ANG II potently activates the NADPH oxidase in other cell types, and ROS from this source are known to activate inflammatory signals, in part, by activating NF-κB-mediated gene transcription. NF-κB, in turn, has been implicated in T-cell production of cytokines such as TNF-α. We, therefore, performed additional experiments to determine whether endogenously produced ANG II could modulate T-cell ROS production and whether this could impact TNF-α production. T cells were exposed to perindopril for 4 h, and superoxide production from these cells was measured using electron spin resonance and the spin probe TMH. T cell production of superoxide was reduced by 30% by perindopril (Fig. 6A). To determine whether the NADPH oxidase participates in TNF-α production, T cells from p47phox−/− mice were cultured on anti-CD3 plates for 48 h, and the release of TNF-α into the media was measured. Compared with cells from wild-type C57BL/6 mice, T cells from p47phox−/− mice produced 40% less TNF-α (Fig. 6B).
Fig. 6.
Role of the NADPH oxidase and superoxide in T-cell production of TNF-α. T cells (2 × 10⁵) were cultured on anti-CD3 plates in the presence or absence of the indicated agents. Superoxide was measured using the 1-hydroxy-4-methoxy-2,2,6,6-tetramethylpiperidine spin-probe with electron spin resonance in the absence and presence of the ANG I-converting enzyme inhibitor (A; n = 5). In other studies, T cells from wild-type and p47phox−/− mice were cultured on anti-CD3 plates for 48 h, and the release of TNF-α into the media determined by ELISA (B; n = 6–8). Studies to determine the role of hydrogen peroxide vs. superoxide production by the NADPH oxidase were also performed by treating T cells with either polyethylene glycol-linked catalase (PEG-catalase, 100 U/ml) to scavenge hydrogen peroxide or PEG-superoxide dismutase (PEG-SOD). PEG alone was used as a control (C; n = 8).
The above data strongly support a role of ANG II in activation of the T cell NADPH oxidase, which then produces ROS to stimulate T-cell TNF-α production. To gain insight into the specific ROS involved in this process, additional experiments were performed in which T cells were preincubated with either PEG-SOD or PEG-catalase (100 U/ml for each) for 4 h before adding cells to anti-CD3 plates. PEG-SOD and PEG-catalase treatment was maintained during exposure to anti-CD3. Control cells were exposed to PEG alone. PEG-SOD decreased T cell production of TNF-α by 50% compared with PEG alone, while PEG-catalase was without effect (Fig. 6C). Taken together, these data indicate that superoxide produced by the NADPH oxidase contributes to T-cell TNF-α production.
Role of the T-cell AT2 receptor in vivo regulation of blood pressure.
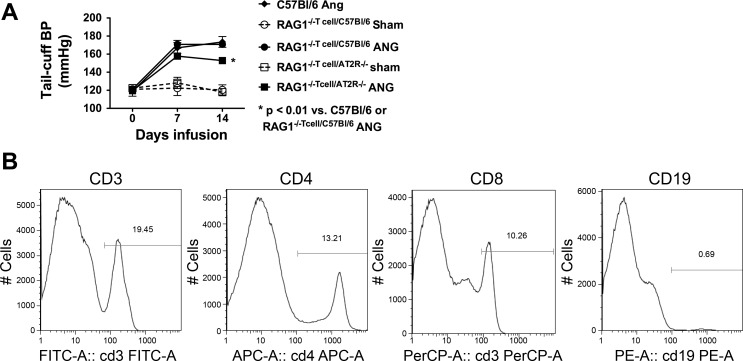
We have previously shown that the T-cell AT1 receptor is important for modulation of blood pressure, in that adoptive transfer of AT1R−/− cells to RAG-1−/− mice resulted in a blunted hypertensive response to ANG II compared with adoptive transfer of wild-type T cells. Because we observed reduced T-cell production of TNF-α in T cells from AT2R−/− mice, we sought to determine whether these cells would display reduced effectiveness in vivo. To accomplish this, mice underwent adoptive transfer of 107 T cells from either C57BL/6 or AT2R−/− mice into RAG-1−/− mice. Three weeks following adoptive transfer, baseline blood pressure was measured using tail-cuff, and osmotic minipumps were then placed for infusion of ANG II. Adoptive transfer of wild-type T cells into RAG-1−/− mice restored the hypertensive response to ANG II to a level observed in ANG II-infused C57BL/6 mice. In contrast, adoptive transfer of the AT2R−/− T cells resulted in a blunted hypertensive response to ANG II compared with that observed in either C57BL/6 mice or RAG-1−/− mice following adoptive transfer of wild-type T cells (Fig. 7A), despite achieving similar degrees of T-cell reconstitution (Fig. 7B).
Fig. 7.
Effect of adoptive transfer of wild-type and AT2R−/− T cells on the hypertensive response to ANG II. Ten million T cells were adoptively transferred from spleens of either C57BL/6 (n = 7) or AT2R−/− mice (n = 11) into RAG1−/− mice by tail vein injection. Three weeks later, either sham or ANG II infusion was initiated. A: blood pressure response over 14 days of ANG II infusion. Also shown is the hypertensive response to ANG II in C57BL/6 mice (n = 6). B: example flow cytometry plots confirming reconstitution of T cells, but not B cells.
DISCUSSION
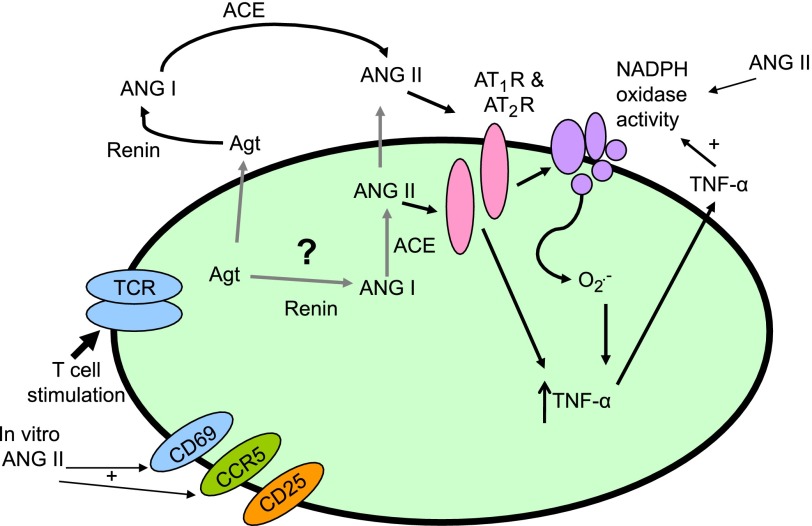
In the present study, we found that T cells produce ANG II, which then exerts an autocrine action to stimulate production of superoxide. Superoxide, in turn, promotes T cell production of the cytokine TNF-α. The NADPH oxidase is important in this process, because T cells from p47phox−/− mice demonstrated reduced production of TNF-α. These actions of endogenously produced ANG II require T cell receptor ligation with anti-CD3, suggesting that the octapeptide has a role in augmenting ongoing immune responses. Finally, the effects of ANG II on T cells seem to be mediated by both AT1 and AT2 receptors, in that both AT1 and AT2 receptor antagonists inhibited T-cell production of TNF-α, and the production of this cytokine was reduced to an equal extent in T cells from mice lacking these receptors. These data are consistent with the scheme presented in Fig. 8.
Fig. 8.
Schematic diagram showing proposed interaction of endogenously produced ANG II with the T cell NADPH oxidase contributing to T cell activation and TNF-α production. T cells contain a functional RAS, and this in turn, combined with anti-CD3 stimulation acts on AT1 and AT2 receptors leading to NADPH oxidase activation. Superoxide produced by the NADPH oxidase affects T-cell activation and production of TNF-α.
Our findings are in keeping with prior studies, demonstrating that T cells possess components of the RAS (24). The angiotensin-converting enzyme has also been colocalized with T cells in atherosclerotic lesions (7). ANG II has also been detected in the supernatant of mixed mononuclear cell preparations, although the precise contribution of T cells was not demonstrated (23). To our knowledge, therefore, the current study is the first to definitively document production of ANG II by T cells. Of interest, the amount of ANG II produced by these cells was substantial, on the order of what we could detect after the addition of 100 nM of ANG II to the tissue culture. There was also obvious degradation of ANG II in the culture, likely by cellular peptidases, because the measured amount of ANG II 2 days following addition of 100 nM (30 pg/ml) was substantially less than the calculated amount that should have been present in the absence of degradation (1 μg/ml). The circulating levels of ANG II have been estimated to be ∼60 pg/ml in humans (22) and to range from 10 to 300 pg/ml in rats based on the level of hydration (26). Thus, the levels of ANG II released in the media of these cells are clearly within a physiological range. Moreover, the media substantially diluted the values that we measured such that the intracellular levels of ANG II are clearly much higher than the values in the media.
The mRNA levels of the various components of RAS were compared with tissues known to express these proteins. Not surprisingly, T-cell expression of the ANG I-converting enzyme was substantially less than that in the lung, but as much as that in the liver. Likewise, T cells expressed substantially less renin than did the kidney, but more than the liver or lung. In preliminary studies, we found it impossible to maintain T cells in culture without serum and therefore cannot exclude a role of ACE and renin present in T-cell production of ANG II. This situation, however, is not unlike that encountered in vivo, where resident T cells in tissue could produce angiotensinogen, which could serve as a substrate for renin and subsequently ACE in the interstitial fluid. Of interest, the levels of renin, angiotensinogen, and ACE were much lower in spleen-derived cells compared with circulating T cells, in keeping with our finding that spleen-derived cells produce less ANG II than circulating T cells. This might explain the ability of exogenous ANG II to stimulate spleen-derived cells and its lack of effect in blood-derived cells. These differences in RAS components are in keeping with other properties of central lymphoid vs. blood T cells (28).
Numerous cells involved in inflammatory responses, including macrophages (14), B cells (41), neutrophils (42), and resident cells in tissues (32) can produce TNF-α. One might, therefore, question the significance of T-cell production of this cytokine in an inflammatory milieu that contains other cells. There is evidence that TNF-α has important influences on T cells, such as modulating proliferation of the human immunodeficiency virus (29) and regulation of helper activity in B cell activation (20). Effector CD8+ cells rapidly produce TNF-α in response to T cell receptor ligation, which, in turn, decreases viability of adjacent antigen-presenting cells (3). Naïve T cells produce large amounts of TNF-α upon activation, at a time when they are migrating to outer T cell zones in lymph nodes (31). TNF-α can down regulate CD4+ cells and modulate the effector phase of CD8+ cells during viral infection (36, 37). A recent elegant study compared the effects of specific deletion of T-cell TNF-α using Cre-Lox technology in macrophages and T cells and showed that T cell-derived TNF-α plays a critical role in the response to intracellular infectious agents and autoimmune hepatitis (17). In our previous study, we found that hypertension was associated with a marked infiltration of T cells in the perivascular fat, and that TNF-α inhibition with etanercept could prevent the increase in blood pressure and vascular superoxide caused by ANG II (18). It is, therefore, likely that TNF-α production by T cells plays an important role in their function and also modulates adjacent cells. In the setting of hypertension, these effects of T cell-derived TNF-α likely involve stimulation of the vascular NADPH oxidase and superoxide production.
In cell culture, ANG II can directly stimulate NADPH oxidase activity in many cell types, including vascular smooth muscle cells and endothelial cells (8, 15). Our current findings, and those of our previous studies, however, indicate that the levels of ANG II achieved during chronic infusion are insufficient to directly achieve this effect. It is likely that ANG II, TNF-α, and other cytokines act in concert to amplify the inflammatory process in hypertension. In vascular smooth muscle cells, ANG II stimulates TNF-α production via activation of the NADPH oxidase and subsequent ROS production, thereby promoting a feed-forward response (40).
A surprising finding of the present study was that both AT1R and AT2R receptor blockade reduced T-cell production of TNF-α. This conclusion was based not only on pharmacological inhibition with losartan and PD123319 but also on studies of T cells from AT1R- and AT2R-deficient mice. In keeping with a role of T cell AT2R in increasing blood pressure, we also found that the hypertensive response to ANG II was modestly blunted in RAG1−/− mice after adoptive transfer of AT2R−/− T cells. These data are similar to those we previously published showing that the hypertensive response to ANG II was blunted following adoptive transfer of AT1R−/− T cells compared with that observed following adoptive transfer of wild-type cells (18). In general, the AT1R and AT2R have been considered to signal opposite effects, such that the AT1R promotes vascular smooth muscle growth, vasoconstriction, and superoxide production, while AT2R inhibits these events (5). There are, however, instances in which the AT2R has proinflammatory roles. As an example, expression of either the AT1R or AT2R led to similar degrees of NF-κB activation in COS7 cells (45). In keeping with this, blockade of both AT1R and AT2R was required to reduce the inflammation and NF-κB activation caused by unilateral ureteral obstruction (10). In human preadipocytes, the ANG II-stimulated release of IL-6 and IL-8 is inhibited by AT1R blockade and to a lesser extent by AT2R inhibition, suggesting that both receptors signal a proinflammatory response in these cells (39). AT2R receptors are upregulated in the kidney during ANG II infusion at sites of renal inflammation and tubular cell apoptosis, suggesting a role in this pathological response (35). Our findings that both receptors promote T-cell production of TNF-α and contribute to hypertension in vivo are in accord with these prior studies.
Using fluorescent cell sorting, we were unable to demonstrate the presence of AT2 receptor protein on either the cell surface or intracellularly in T cells despite the above considerations. It is possible that the antibody that we employed does not work well for FACS. It is also likely that the AT2 receptor is present in very low levels that cannot be detected by FACS. In keeping with this, we were only able to detect AT2R mRNA using conventional PCR. The fact that PD123319 reduced TNF-α production and that T cells from AT2R−/− mice produced reduced amounts of TNF-α strongly suggests that these cells indeed contain a functioning AT2 receptor. This conclusion is further strengthened by our finding that adoptive transfer of AT2R−/− T cells in RAG-1−/− mice led to reduced hypertension compared with adoptive transfer of cells from wild-type mice.
An interesting finding in our present study is that the majority of T cell AT1R receptors are intracellular and therefore would be particularly prone to activation by endogenously produced ANG II. This result is in keeping with the concept that ANG II and its receptors can exist as an intracrine system, in which signaling occurs within cells (25, 34). A similar role of intracellular ANG II has been demonstrated in the kidney (46), myocardial cells (38), the central nervous system (12, 21), and hepatic cells (9). In the case of myocytes, intracrine ANG II has been implicated in hypertrophy (2) and is increased by hyperglycemia (38). It will be of substantial interest to study factors, such as glucose, that could modulate T cell ANG II or its receptors.
It should be emphasized that the pathway outlined in Fig. 8 only partly explains TNF-α and superoxide production by T cells. Blockade of the angiotensin-converting enzyme, angiotensin receptors, and scavenging of superoxide reduced TNF-α production by only about 30 to 60%, indicating that a substantial portion of this is independent of this pathway. Nevertheless, a potentially important portion of T-cell TNF-α production is linked to this pathway. Given these considerations, our present data support a role of T-cell production of ANG II in autocrine stimulation of this cell. Further studies are needed to understand the role of T cell endogenously produced ANG II in diseases such as these and in cardiovascular pathology.
Perspectives and Significance
The current study has defined a new pathway in T cells that involves production of ANG II, superoxide, and the inflammatory cytokine TNF-α (Fig. 8). We have previously shown that ANG II-induced hypertension is associated with accumulation of effector-like T cells in the perivascular fat (18), and T cells are also known to accumulate in and to promote atherosclerotic lesions (19). It is, therefore, likely that this pathway contributes to the progression of vascular disease in these conditions. We believe that T cells are unlikely a major source of superoxide in hypertensive vessels, but that their production of TNF-α and other cytokines promotes a pro-oxidant milieu, which together with ANG II markedly stimulates the production of ROS by adjacent vascular cells. It is also likely that T cell production of ANG II, superoxide, and TNF-α could contribute to inflammation in other settings where T cells accumulate. These findings could explain why interruption of the RAS improves T cell-mediated diseases such as arthritis (11, 27, 33), transplant rejection (1), and experimental myocarditis (13) and also provide insight into the recent observation that ANG I-converting enzyme inhibition improves endothelial function in humans with rheumatoid arthritis (11). The fact that both AT1 and AT2 receptors contribute to this pathway might also instruct pharmacological therapy and requires further study.
GRANTS
This study was supported by National Institutes of Health (NIH) Grants HL-390006, AR-42527, AI-44142, EY-11916, AR-41974, NIH Program Project Grants HL-58000 and P01075209, and a Department of Veterans Affairs Merit Grant.
The costs of publication of this article were defrayed in part by the payment of page charges. The article must therefore be hereby marked “advertisement” in accordance with 18 U.S.C. Section 1734 solely to indicate this fact.
REFERENCES
- 1.Amuchastegui SC, Azzollini N, Mister M, Pezzotta A, Perico N, Remuzzi G. Chronic allograft nephropathy in the rat is improved by angiotensin II receptor blockade but not by calcium channel antagonism. J Am Soc Nephrol 9: 1948–1955, 1998. [DOI] [PubMed] [Google Scholar]
- 2.Baker KM, Chernin MI, Schreiber T, Sanghi S, Haiderzaidi S, Booz GW, Dostal DE, Kumar R. Evidence of a novel intracrine mechanism in angiotensin II-induced cardiac hypertrophy. Regul Pept 120: 5–13, 2004. [DOI] [PubMed] [Google Scholar]
- 3.Brehm MA, Daniels KA, Welsh RM. Rapid production of TNF-α following TCR engagement of naive CD8 T cells. J Immunol 175: 5043–5049, 2005. [DOI] [PubMed] [Google Scholar]
- 4.Cai H, Griendling KK, Harrison DG. The vascular NAD(P)H oxidases as therapeutic targets in cardiovascular diseases. Trends Pharmacol Sci 24: 471–478, 2003. [DOI] [PubMed] [Google Scholar]
- 5.Carey RM Cardiovascular and renal regulation by the angiotensin type 2 receptor: the AT2 receptor comes of age. Hypertension 45: 840–844, 2005. [DOI] [PubMed] [Google Scholar]
- 6.Costerousse O, Allegrini J, Lopez M, Alhenc-Gelas F. Angiotensin I-converting enzyme in human circulating mononuclear cells: genetic polymorphism of expression in T-lymphocytes. Biochem J 290: 33–40, 1993. [DOI] [PMC free article] [PubMed] [Google Scholar]
- 7.Diet F, Pratt RE, Berry GJ, Momose N, Gibbons GH, Dzau VJ. Increased accumulation of tissue ACE in human atherosclerotic coronary artery disease. Circulation 94: 2756–2767, 1996. [DOI] [PubMed] [Google Scholar]
- 8.Doughan AK, Harrison DG, Dikalov SI. Molecular mechanisms of angiotensin II-mediated mitochondrial dysfunction: linking mitochondrial oxidative damage and vascular endothelial dysfunction. Circ Res 102: 488–496, 2008. [DOI] [PubMed] [Google Scholar]
- 9.Eggena P, Zhu JH, Sereevinyayut S, Giordani M, Clegg K, Andersen PC, Hyun P, Barrett JD. Hepatic angiotensin II nuclear receptors and transcription of growth-related factors. J Hypertens 14: 961–968, 1996. [PubMed] [Google Scholar]
- 10.Esteban V, Lorenzo O, Ruperez M, Suzuki Y, Mezzano S, Blanco J, Kretzler M, Sugaya T, Egido J, Ruiz-Ortega M. Angiotensin II, via AT1 and AT2 receptors and NF-κB pathway, regulates the inflammatory response in unilateral ureteral obstruction. J Am Soc Nephrol 15: 1514–1529, 2004. [DOI] [PubMed] [Google Scholar]
- 11.Flammer AJ, Sudano I, Hermann F, Gay S, Forster A, Neidhart M, Kunzler P, Enseleit F, Periat D, Hermann M, Nussberger J, Luscher TF, Corti R, Noll G, Ruschitzka F. Angiotensin-converting enzyme inhibition improves vascular function in rheumatoid arthritis. Circulation 117: 2262–2269, 2008. [DOI] [PubMed] [Google Scholar]
- 12.Glass MJ, Huang J, Speth RC, Iadecola C, Pickel VM. Angiotensin II AT-1A receptor immunolabeling in rat medial nucleus tractus solitarius neurons: subcellular targeting and relationships with catecholamines. Neuroscience 130: 713–723, 2005. [DOI] [PubMed] [Google Scholar]
- 13.Godsel LM, Leon JS, Wang K, Fornek JL, Molteni A, Engman DM. Captopril prevents experimental autoimmune myocarditis. J Immunol 171: 346–352, 2003. [DOI] [PubMed] [Google Scholar]
- 14.Goossens V, Grooten J, De Vos K, Fiers W. Direct evidence for tumor necrosis factor-induced mitochondrial reactive oxygen intermediates and their involvement in cytotoxicity. Proc Natl Acad Sci USA 92: 8115–8119, 1995. [DOI] [PMC free article] [PubMed] [Google Scholar]
- 15.Griendling KK, Minieri CA, Ollerenshaw JD, Alexander RW. Angiotensin II stimulates NADH and NADPH oxidase activity in cultured vascular smooth muscle cells. Circ Res 74: 1141–1148, 1994. [DOI] [PubMed] [Google Scholar]
- 16.Griendling KK, Sorescu D, Ushio-Fukai M. NAD(P)H oxidase: role in cardiovascular biology and disease. Circ Res 86: 494–501, 2000. [DOI] [PubMed] [Google Scholar]
- 17.Grivennikov SI, Tumanov AV, Liepinsh DJ, Kruglov AA, Marakusha BI, Shakhov AN, Murakami T, Drutskaya LN, Forster I, Clausen BE, Tessarollo L, Ryffel B, Kuprash DV, Nedospasov SA. Distinct and nonredundant in vivo functions of TNF produced by T cells and macrophages/neutrophils: protective and deleterious effects. Immunity 22: 93–104, 2005. [DOI] [PubMed] [Google Scholar]
- 18.Guzik TJ, Hoch NE, Brown KA, McCann LA, Rahman A, Dikalov S, Goronzy J, Weyand C, Harrison DG. Role of the T cell in the genesis of angiotensin II induced hypertension and vascular dysfunction. J Exp Med 204: 2449–2460, 2007. [DOI] [PMC free article] [PubMed] [Google Scholar]
- 19.Hansson GK Inflammation, atherosclerosis, and coronary artery disease. N Engl J Med 352: 1685–1695, 2005. [DOI] [PubMed] [Google Scholar]
- 20.Higuchi M, Nagasawa K, Horiuchi T, Oike M, Ito Y, Yasukawa M, Niho Y. Membrane tumor necrosis factor-α (TNF-α) expressed on HTLV-I-infected T cells mediates a costimulatory signal for B cell activation–characterization of membrane TNF-α. Clin Immunol Immunopathol 82: 133–140, 1997. [DOI] [PubMed] [Google Scholar]
- 21.Huang J, Hara Y, Anrather J, Speth RC, Iadecola C, Pickel VM. Angiotensin II subtype 1A (AT1A) receptors in the rat sensory vagal complex: subcellular localization and association with endogenous angiotensin. Neuroscience 122: 21–36, 2003. [DOI] [PubMed] [Google Scholar]
- 22.Jalil JE, Palomera C, Ocaranza MP, Godoy I, Roman M, Chiong M, Lavandero S. Levels of plasma angiotensin-(1–7) in patients with hypertension who have the angiotensin-I-converting enzyme deletion/deletion genotype. Am J Cardiol 92: 749–751, 2003. [DOI] [PubMed] [Google Scholar]
- 23.Jankowski V, Vanholder R, van der Giet M, Henning L, Tolle M, Schonfelder G, Krakow A, Karadogan S, Gustavsson N, Gobom J, Webb J, Lehrach H, Giebing G, Schluter H, Hilgers KF, Zidek W, Jankowski J. Detection of angiotensin II in supernatants of stimulated mononuclear leukocytes by matrix-assisted laser desorption ionization time-of-flight/time-of-flight mass analysis. Hypertension 46: 591–597, 2005. [DOI] [PubMed] [Google Scholar]
- 24.Jurewicz M, McDermott DH, Sechler JM, Tinckam K, Takakura A, Carpenter CB, Milford E, Abdi R. Human T and natural killer cells possess a functional renin-angiotensin system: further mechanisms of angiotensin II-induced inflammation. J Am Soc Nephrol 18: 1093–1102, 2007. [DOI] [PubMed] [Google Scholar]
- 25.Kumar R, Singh VP, Baker KM. The intracellular renin-angiotensin system: a new paradigm. Trends Endocrinol Metab 18: 208–214, 2007. [DOI] [PubMed] [Google Scholar]
- 26.Mann JF, Johnson AK, Ganten D. Plasma angiotensin II: dipsogenic levels and angiotensin-generating capacity of renin. Am J Physiol Regul Integr Comp Physiol 238: R372–R377, 1980. [DOI] [PubMed] [Google Scholar]
- 27.Martin MF, Surrall KE, McKenna F, Dixon JS, Bird HA, Wright V. Captopril: a new treatment for rheumatoid arthritis? Lancet 1: 1325–1328, 1984. [DOI] [PubMed] [Google Scholar]
- 28.Mora JR, and von Andrian UH. T-cell homing specificity and plasticity: new concepts and future challenges. Trends Immunol 27: 235–243, 2006. [DOI] [PubMed] [Google Scholar]
- 29.Munoz-Fernandez MA, Navarro J, Garcia A, Punzon C, Fernandez-Cruz E, Fresno M. Replication of human immunodeficiency virus-1 in primary human T cells is dependent on the autocrine secretion of tumor necrosis factor through the control of nuclear factor-κB activation. J Allergy Clin Immunol 100: 838–845, 1997. [DOI] [PubMed] [Google Scholar]
- 30.Nataraj C, Oliverio MI, Mannon RB, Mannon PJ, Audoly LP, Amuchastegui CS, Ruiz P, Smithies O, Coffman TM. Angiotensin II regulates cellular immune responses through a calcineurin-dependent pathway. J Clin Invest 104: 1693–1701, 1999. [DOI] [PMC free article] [PubMed] [Google Scholar]
- 31.Ohshima Y, Yang LP, Avice MN, Kurimoto M, Nakajima T, Sergerie M, Demeure CE, Sarfati M, Delespesse G. Naive human CD4+ T cells are a major source of lymphotoxin alpha. J Immunol 162: 3790–3794, 1999. [PubMed] [Google Scholar]
- 32.Pettipher ER, Salter ED. Resident joint tissues, rather than infiltrating neutrophils and monocytes, are the predominant sources of TNF-α in zymosan-induced arthritis. Cytokine 8: 130–133, 1996. [DOI] [PubMed] [Google Scholar]
- 33.Price A, Lockhart JC, Ferrell WR, Gsell W, McLean S, Sturrock RD. Angiotensin II type 1 receptor as a novel therapeutic target in rheumatoid arthritis: in vivo analyses in rodent models of arthritis and ex vivo analyses in human inflammatory synovitis. Arthritis Rheum 56: 441–447, 2007. [DOI] [PubMed] [Google Scholar]
- 34.Re RN, Cook JL. Mechanisms of disease: Intracrine physiology in the cardiovascular system. Nat Clin Pract Cardiovasc Med 4: 549–557, 2007. [DOI] [PubMed] [Google Scholar]
- 35.Ruiz-Ortega M, Esteban V, Suzuki Y, Ruperez M, Mezzano S, Ardiles L, Justo P, Ortiz A, Egido J. Renal expression of angiotensin type 2 (AT2) receptors during kidney damage. Kidney Int Suppl S21–S26, 2003. [DOI] [PubMed]
- 36.Singh A, Suresh M. A role for TNF in limiting the duration of CTL effector phase and magnitude of CD8 T cell memory. J Leukoc Biol 82: 1201–1211, 2007. [DOI] [PubMed] [Google Scholar]
- 37.Singh A, Wuthrich M, Klein B, Suresh M. Indirect regulation of CD4 T-cell responses by tumor necrosis factor receptors in an acute viral infection. J Virol 81: 6502–6512, 2007. [DOI] [PMC free article] [PubMed] [Google Scholar]
- 38.Singh VP, Le B, Bhat VB, Baker KM, Kumar R. High-glucose-induced regulation of intracellular ANG II synthesis and nuclear redistribution in cardiac myocytes. Am J Physiol Heart Circ Physiol 293: H939–H948, 2007. [DOI] [PubMed] [Google Scholar]
- 39.Skurk T, van Harmelen V, Hauner H. Angiotensin II stimulates the release of interleukin-6 and interleukin-8 from cultured human adipocytes by activation of NF-κB. Arterioscler Thromb Vasc Biol 24: 1199–1203, 2004. [DOI] [PubMed] [Google Scholar]
- 40.Touyz RM, Berry C. Recent advances in angiotensin II signaling. Braz J Med Biol Res 35: 1001–1015, 2002. [DOI] [PubMed] [Google Scholar]
- 41.Tsai EY, Yie J, Thanos D, Goldfeld AE. Cell-type-specific regulation of the human tumor necrosis factor alpha gene in B cells and T cells by NFATp and ATF-2/JUN. Mol Cell Biol 16: 5232–5244, 1996. [DOI] [PMC free article] [PubMed] [Google Scholar]
- 42.Vaughan JE, Walsh SW. Neutrophils from pregnant women produce thromboxane and tumor necrosis factor-alpha in response to linoleic acid and oxidative stress. Am J Obstet Gynecol 193: 830–835, 2005. [DOI] [PubMed] [Google Scholar]
- 43.Widder JD, Chen W, Li L, Dikalov S, Thony B, Hatakeyama K, Harrison DG. Regulation of tetrahydrobiopterin biosynthesis by shear stress. Circ Res 101: 830–838, 2007. [DOI] [PubMed] [Google Scholar]
- 44.Widder JD, Guzik TJ, Mueller CF, Clempus RE, Schmidt HH, Dikalov SI, Griendling KK, Jones DP, Harrison DG. Role of the multidrug resistance protein-1 in hypertension and vascular dysfunction caused by angiotensin II. Arterioscler Thromb Vasc Biol 27: 762–768, 2007. [DOI] [PubMed] [Google Scholar]
- 45.Wolf G, Wenzel U, Burns KD, Harris RC, Stahl RA, Thaiss F. Angiotensin II activates nuclear transcription factor-κB through AT1 and AT2 receptors. Kidney Int 61: 1986–1995, 2002. [DOI] [PubMed] [Google Scholar]
- 46.Zhuo JL, Li XC. Novel roles of intracrine angiotensin II and signalling mechanisms in kidney cells. J Renin Angiotensin Aldosterone Syst 8: 23–33, 2007. [DOI] [PMC free article] [PubMed] [Google Scholar]


