Abstract
Previous studies have shown that mice deficient in the tyrosine kinase domain (TK−/−) of the receptor Mst1r have an increased susceptibility to nickel (Ni)-induced acute lung injury (ALI). Mst1r TK−/− mice have decreased survival times, alterations in cytokine and nitric oxide regulation, and an earlier onset of pulmonary pathology compared with control mice, suggesting that Mst1r signaling, in part, may regulate the response to ALI. To examine the role of Mst1r in ALI in more detail, we compared the gene expression profiles of murine lung mRNA from control and Mst1r TK−/− mice at baseline and after 24 h of particulate Ni sulfate exposure. Microarray analyses showed a total of 343 transcripts that were significantly changed, either by Ni treatment, or between genotypes. Genes responsible for inflammation, edema, and lymphocyte function were altered in the Mst1r TK−/− mice. Interestingly, the genes for several granzymes were increased in Mst1r TK−/− mice before Ni exposure, compared with controls. In addition, the Mst1r TK−/− lungs showed clusters of cells near the vascular endothelium and airways. Immunohistochemistry indicates these clusters are composed of macrophages, T cells, and neutrophils, and that the clusters display granzyme protein production. These results suggest that Mst1r signaling may be involved in the regulation of macrophage and T-lymphocyte activation in vivo during injury. This assessment of gene expression indicates the importance of genetic factors in contributing to lung injury, and points to strategies for intervention in the progression of inflammatory diseases.
Keywords: acute lung injury, gene expression arrays, hepatocyte growth factor–like protein, Mst1r, Ron receptor
Acute lung injury (ALI) is an often fatal condition that is marked by progression through critical stages of changing endothelial and epithelial permeability, surfactant disruption, arterial hypoxemia, reduced pulmonary compliance, and, ultimately, death due to respiratory failure (1, 2). To identify genes responsible for the progression of ALI, this study used a mouse model system with nickel sulfate (NiSO4) as the pulmonary irritant. Within hours, NiSO4 induces alveolar damage that resembles the initial phase of ALI and that, with continued exposure, results in death (3, 4). Microarray analyses on mice exposed to NiSO4 have indicated that the overall pattern of gene expression during progression of ALI is consistent with increases in oxidant responses, hypoxia, extracellular matrix repair, and decreases in surfactant-associated proteins (5). One hypothesis to come out of these data is the suggestion that receptor tyrosine kinases may be important in regulating the response to Ni.
One tyrosine kinase receptor, macrophage-stimulating 1 receptor (Mst1r, a c-met–related tyrosine kinase, also known as the Ron receptor), has been shown to play a critical role in Ni-induced lung injury in mice (6). Mst1r is a transmembrane receptor for macrophage stimulating protein (also known as hepatocyte growth factor–like protein [HGFL]) (7–9). Stimulation of Mst1r leads to its transphosphorylation and the ultimate activation of numerous intracellular signaling pathways, such as the classical mitogen-activated protein kinase pathway, the phosphotidylinositol (PI)3-kinase pathway, and the JNK pathway (10).
To investigate Mst1r signaling during acute injury, mice lacking the catalytic tyrosine kinase domain of Mst1r have been generated, which lack the ability to activate Mst1r-dependent downstream signaling cascades (11). Using these mice, Mst1r has been shown to be important in the response to a number of murine acute injury models (11, 12). In the Ni-induced ALI model, we demonstrated that the Mst1r tyrosine kinase–deficient mice (TK−/−) have significantly decreased survival times compared with control mice (TK+/+) (6). These Mst1r TK−/− mice displayed earlier increases in IL-6, chemokine (C-C motif) ligand 2 (CCL2; also known as MCP-1) and chemokine (CXC motif) ligand 2 (CXCL2; also known as MIP-2), and had augmented serum nitrite levels and enhanced tyrosine nitration compared with Mst1r TK+/+ mice. This increased cytokine and serum nitrate production is associated with an earlier onset of pulmonary inflammation, edema, and lethality (6). To gain insight into the potential role for Mst1r in response to NiSO4, this study used several techniques to analyze the differences between Mst1r TK+/+ and Mst1r TK−/− mice. Gene expression patterns of the lung, in response to NiSO4, were generated with oligonucleotide microarrays containing probe sets for ∼ 12,000 murine genes. Changes in gene expression patterns were monitored at baseline and after 24 h NiSO4 exposure in control mice and Mst1r tyrosine kinase–deficient mice. Histologic analysis was performed on lung tissue from both control and Mst1r-deficient mice before Ni exposure. These studies revealed an accumulation of immune cells in the lungs of Mst1r TK−/− mice, which was not seen in wild-type mice.
Overall, the data obtained from our analyses suggest that genes involved in the inflammatory response may contribute to the elevation of epithelial and alveolar damage observed during Ni-induced ALI in the Mst1r TK−/− mice, possibly through enhanced lymphocyte-mediated cytotoxicity, cytokine release, and macrophage activation (3, 5). Several striking differences between the Mst1r TK+/+ and Mst1r TK−/− mice were observed. One difference was in the gene expression pattern of a family of proteins termed granzymes. Granzymes are a family of serine proteases found almost exclusively in the granules of cytotoxic T lymphocytes and natural killer (NK) cells. Another key area of difference was observed in the chemokines, cytokines, and their receptors. These changes in gene expression may result from, or be causative agents in, the accumulation of immune cells in Mst1r TK−/− mouse lungs. In either case, the functional status of the Mst1r receptor tyrosine kinase plays a significant role in regulating important immune system cells and molecules, which together lead to multiple changes in response to ALI.
MATERIALS AND METHODS
Mice and Nickel Sulfate Exposure
The mice used in this experiment contained a targeted disruption of the tyrosine kinase domain of the receptor Mst1r, and have been described previously (6, 11). Briefly, the experimental mice produce a truncated form of Mst1r, which contains only the extracellular and transmembrane domains of the protein plus five amino acids of the cytoplasmic domain, thus abolishing Mst1r intracellular signaling. These mice are designated Mst1r TK−/−, whereas their controls, designated as Mst1r TK+/+, express the wild-type Mst1r protein. Both genotypes are in a mixed 129/Black Swiss/CD-1 background.
Mice (8–12 wk) were placed into a 0.32-m3 stainless-steel inhalation chamber and continuously exposed to filtered air containing 115 ± 7 ug/m3 NiSO4 particulate aerosol (0.2 mm mass median aerodynamic diameter, 1.85 geometric standard distribution) (1, 5). Nickel aerosol was generated from 50 mM Ni sulfate hexahydrate (Ni2SO4 · 6H2O) solution as described previously (4).
Microarray Analysis
Affymetrix GeneChip oligonucleotide arrays were used for RNA expression analysis (13–17). Total RNA was extracted from total lung tissue using Trizol reagent (Life Technologies). For each genotype and treatment group, RNA was pooled from three separate animals, then first-strand cDNA synthesis was accomplished by priming with a T7-(dT24) primer. Double-stranded cDNA was prepared using Life Technology Superscript cDNA Synthesis System. From cDNA, cRNA was synthesized using Ambion's (Austin, TX) T7 MegaScript In Vitro Transcription kit. Synthesized cRNA was labeled during transcription (Megascript system; Ambion) with biotin-11–cytidine triphosphate and biotin-16–uridine triphosphate (Enzo Diagnostics, Farmingdale, NY). Biotinylated cRNA products were hybridized to Affymetrix genechip arrays (murine-U74A) for 16 h at 40°C using the manufacturer's hybridization buffer. For all analyses, two technical replicate chips were employed. After hybridization, genechip arrays were washed and stained by the fluidics station using the ProkGE-WS2 fluidics script (Affymetrix, Santa Clara, CA). Once the probe array was hybridized and washed, it was scanned using a specially designed confocal scanner (Hewlett-Packard Genearray scanner G2500A; Affymetrix) according to manufacturer's procedures. The intensity of the signals within each feature was quantified by using this epifluorescence confocal microscopy scanner, which uses an argon-ion laser to excite the fluorophores beam.
Data Analysis
To process the primary quantitative data from each hybridization experiment, probe signals in raw CEL files were summarized using MicroArray Suite 4.0 (Affymetrix) and the expression data was then analyzed in GeneSpring 4.2 (Silicon Genetics, Redwood City, CA). To determine if the RNA abundance corresponding to each gene encoded on the array was detectable, several factors were evaluated, including the number of parameters representing each gene in which the intensity of the perfect match hybridization reaction exceeded that of the mismatch hybridization signal and the perfect match/mismatch ratios for each set of the corresponding probe pairs. The raw data were then normalized on a per-chip basis to the median value of all non–Ni-treated genes, from both wild-type and Mst1r TK−/− lung samples. In this way, one is able to see differences between Mst1r TK+/+ and Mst1r TK−/− animals, even in the absence of Ni treatment. Gene induction was considered significant if the change in this normalized intensity was above 2-fold in at least one pair-wise comparison. This moderate level of stringency was chosen to optimize the number of physiologically relevant genes that were identified.
Identification of Gene Expression Patterns
To identify genes that were differentially expressed in lung tissue, either between genotypes or treatment groups, GeneSpring 4.2 software (Silicon Genetics) was utilized. A probe set had to be “present” in at least one sample to be included in this analysis. A total of 343 probe sets, corresponding to 324 unique genes and 3 expressed sequence tags, were identified based on any expression that differed by 2-fold or more between Mst1r TK+/+ and Mst1r TK−/− lung samples or within one genotype, before and after treatment. The 343 differentially expressed transcripts were clustered according to their expression profiles utilizing a K-means algorithm in the GeneSpring software. K-means analysis places gene expression profiles into a predefined number of clusters based on relative expression across the sample series.
RNA Analysis
Total RNA was isolated from homogenized tissues (as indicated in the text) utilizing Trizol reagent (Life Technologies) according to the manufacturer's instructions. RNA pellets were resuspended in nuclease-free water (Ambion). Optical densities were determined spectrophotometrically. Northern blot analysis was used to confirm the GeneChip results. For this, total RNA was isolated, denatured, separated by formaldehyde-agarose gel electrophoresis, and transferred to nylon membranes. Probes were made by PCR amplification of genomic DNA, using the following primers: GAPDH forward 5′-TGGTGCAGGATGCATTGCTG-3′, reverse 5′-ACTGGAGATTGTTGCCATCA-3′; granzyme (Gzm) C forward 5′-CCATCCAGACTATAATCCTGACCGTT-3′, reverse 5′-TGAAGACTTGCGGAGCTGATCCATCAGTT-3′; Gzm D forward 5′-AACAGGATATAGTGTGGAGGCTTCCTGAT-3′, reverse 5′-CAGATGCTTTAGTGTCATTGATGGACCTTG-3′; Gzm E forward 5′-CTTGGAGCTGGAGCAGAGGAGATCA-3′, reverse 5′-TTAGTTCTCTTGGCCTTACTCTCCAGCTT-3′; Gzm G, forward 5′-TACTTCTGCCTCTCAGAGCTGGAGCAGAGGA-3′, reverse 5′-TTAGTTCTCTTGGCCTTACTCTCCAGTT-3′; IFN-γ forward 5′-CCTAGTGATAAGGAATGCACGATGCTCC-3′, reverse 5′-TTAGTTCTCTTGGCCTTACTCTCCAGTT-3′; troponin T forward 5′-GCTTGTCATCGCTAAGATGGTCAATGTTC-3′, reverse 5′-AACTGAACAAGTTGAGGAGGAGGCC-3′; serum amyloid forward 5′-GCTACTCACCAGCCTGGTCTTCTGCTCC-3′, reverse 5′-TTGTCAGGCAGTCCAGGAGGTCTGTAGTAATT-3′; amphiregulin forward 5′-GGACCACAGTGCCGGTGGACTTCAG-3′; reverse 5′-TGTGATAACGATGCCGATGCCCAATAGCT-3′. Northern blots were hybridized at 60–68°C in PerfectHyb Plus hybridization buffer (Sigma Chemical Co., St. Louis, MO) and extensively washed at high stringency. Densitometric quantitation analysis was performed on a PhosphorImager (Storm 860; Molecular Dynamics/Amersham, Piscataway, NJ).
Diagnostic Analysis of Granzymes D–G
To perform a diagnostic RT-PCR analysis of Granzymes D-G, RNA from lung tissue was used as the template to synthesize cDNA. The resultant cDNA was then amplified by PCR and digested with restriction enzymes as indicated. Reverse transcription was performed under the following conditions: 8.0 μg total RNA, 100 nM granzyme I primer, 0.5 mM dNTPs, 10 mM DTT, 1 μl Superscript II (Life Technologies), 75 mM KCl, and 3 mM MgCl2. The reaction was allowed to proceed for 50 min at 42°C, and then the reverse transcriptase was inactivated for 15 min at 70°C. PCR was performed under the following conditions: 20 mM/μl each of granzyme I and granzyme II primers, 4.0 μl of template, and 45 μl of platinum supermix (Life Technologies). Thirty cycles were performed at 95°C for 2 min, 56°C for 1 min, and 72°C for 1 min, and 1 final cycle was performed at 72°C for 7 min. After PCR, restriction enzyme digestion was performed with BglII, BstXI, HindIII, and/or PstI, and the DNA was resolved by electrophoresis on a 1.5% agarose gel containing 0.5 μg/ml ethidium bromide. The granzyme I primer sequence was TTTAAC(T/A)CCTGTTAGAGCA and the granzyme II primer sequence was CTCT(C/T)(G/A)GAGCTGGAGCA (18).
Immunohistochemistry
Sections of paraffin-embedded lung tissue from untreated mice were mounted on glass slides. The paraffin was removed by melting at 60°C, followed by soaking in xylene substitute (Thermo Electron Corp., Pittsburgh, PA) and rehydrating through decreasing ethanol concentrations. Endogenous peroxides were blocked and, if necessary, antigen retrieval was performed by boiling slides in 0.1 M citric acid/0.1M Na citrate. Slides were blocked in 5% BSA/PBS, containing 10% serum from the same species as the secondary antibody. After incubating with primary antibody overnight at 4°C, staining was visualized with a peroxidase-based detection kit (Vectastain ABC kit; Vector Laboratories, Burlingame, CA), followed by incubation with 3,3′ diaminobenzidine (Sigma) and hematoxylin counter staining. The antibody to granzyme D was from R&D Systems (Minneapolis, MN), antineutrophil antibody was from Serotec Ltd. (Oxford, UK), and the F4/80 antibody was from Abcam Ltd. (Cambridgeshire, UK). Anti-Mst1r, and the CD4 and CD8 antibodies were all from Santa Cruz Biotechnology (Santa Cruz, CA). The CD3e-2C11 antibody was from BD Pharmingen (San Diego, CA). Pictures were taken at several different magnifications, to illustrate the consistent nature of the clusters and staining. Negative controls for the immunohistochemical reactions were performed on serial sections using an isotypic control antibody.
Myeloperoxidase Assay
A sample of lung tissue (∼ 100 mg) was homogenized in 3.4 mM KH2PO4 and 16 mM Na2HPO4, (pH 7.4), then centrifuged at 10,000 × g for 20 min (4°C). The pellet was resuspended in 10 vols of resuspension buffer (43.2 mM KH2PO4, 6.5 mM Na2HPO4, 10 mM EDTA, 0.5% hexadecyltrimethylammonium, pH 6.0) and sonicated for 10 s before being incubated at 60°C for 2 h. The samples were centrifuged as previously described here, and the supernatant was further diluted 1:10 in resuspension buffer. To this was added 5 vols of myeloperoxidase (MPO) cocktail (0.04% 3,3′,5,5′-tetramethylbenzidine, 18% N,N-dimethylformamide, 87 mM KH2PO4, 2.9 mM Na2HPO4, and 0.55% hexadecyltrimethylammonium). The MPO reaction was started by adding 50 μl of H2O2 and incubating at 37°C. After 15 min, the reaction was stopped by adding 1 N acetic acid. The optical density was determined at 655 nm and compared with known MPO standards to determine the MPO concentration in the tissue sample.
RESULTS
Due to the fact that Mst1r TK−/− mice show increased lung injury in response to NiSO4 exposure, and that this increased injury appears to be a multifactorial process, we hypothesized that changes in the expression of numerous genes may cooperate to mediate the difference between Mst1r TK−/− mice and control animals in this ALI model.
To identify differentially expressed genes, RNA was isolated from lung tissue of control (Mst1r TK+/+) and Mst1r TK−/− mice at 0 and 24 h after Ni exposure. This RNA was subjected to oligonucleotide genechip analysis using the murine U74Av2 chip from Affymetrix. The hybridization profiles from technical replicate chips were combined, and differences in genes, the expression of which differed by at least 2-fold between any two groups, were considered significant (19, 20). Using this moderate level of stringency, a total of 343 transcripts were determined to be differentially expressed. Several of these genes, particularly those for granzymes, were validated by Northern analysis.
The genes identified by the microarray experiments encompass a number of functions, from regulation of inflammation and the immune system, to genes involved in apoptosis and cell cycle progression. These analyses have provided two main types of information: the changes in gene expression that are related to Ni inhalation, regardless of the genotype of the animal; and the changes in gene expression that are different in animals with a deletion of Mst1r signaling compared with control mice.
Cluster Analysis of Gene Expression in Mst1r TK+/+ and TK−/− Mice
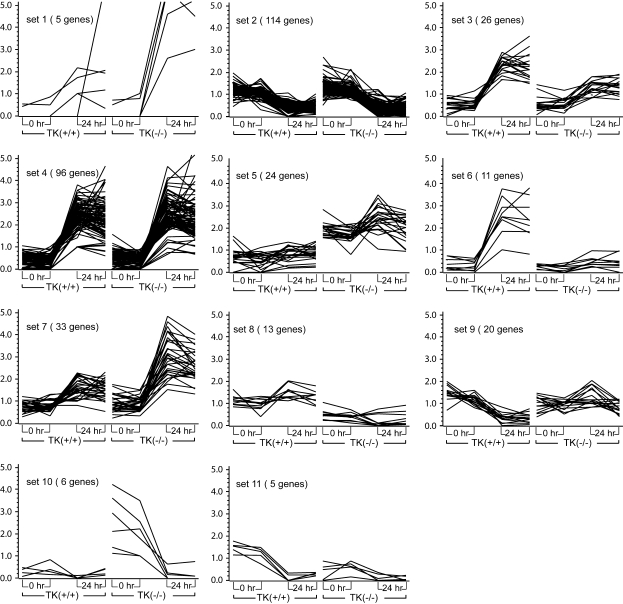
Cluster analysis was conducted to identify the patterns of gene expression in response to NiSO4 by using the normalized values of signal intensity for each gene. The temporal patterns of gene expression were grouped according to similarity of their expression pattern. Selected genes having a difference in intensity of at least 2-fold in at least one pair-wise comparison were clustered into 11 major temporal sets using a K-means algorithm (Figure 1).
Figure 1.
Cluster analysis by similarity of expression pattern. Gene expression profiles of the 343 most highly expressed genes were grouped into 11 distinct sets based on their temporal expression profiles, utilizing a K-means algorithm in the GeneSpring software. The x axis shows technical replicates at 0 and 24 h after nickel sulfate (NiSO4) treatment to Mst1r TK+/+ and Mst1r TK−/− mice. The y axis is the relative increase in gene expression, above baseline. The data represent an average of duplicate chips, which were hybridized with RNA pooled from three animals for each treatment group.
The largest number of differentially expressed genes occurred in the two clusters that are modulated during NiSO4-induced ALI, independent of genotype (Set 2 and Set 4). In Set 2, there are 114 genes with decreased transcript levels in lung tissue after NiSO4 exposure to approximately the same extent in Mst1r TK−/− mice as in TK+/+ mice. The decreased expression of many genes in this group is likely related to the epithelial and endothelial cell injury and decreased differentiated function seen in this model.
Genes whose expression is increased to the same extent after Ni exposure in both groups of mice form the next largest set, Set 4, with 96 genes. Included in this group are genes for heat shock proteins (Hspa1b, Hsp70–3), serum amyloid proteins, signaling molecules (JunB), and IL (IL-1b, ILr-2).
Another broad grouping of genes is those that increased in both genotypes after NiSO4 inhalation, but to a greater extent in one genotype than the other. Set 3 shows 26 genes that increased slightly more in Mst1r TK+/+ mice than in Mst1r TK −/− mice after Ni treatment. Similar to Set 3 is Set 6, consisting of 11 genes that were very strongly increased in wild-type mice, but which barely changed in TK−/− mice after treatment. This group has a number of contractile proteins, including actin, troponin T, and several myosin genes (Myl2, Myh1).
Two groups of genes increased more in Mst1r TK−/− animals than in control animals. Set 1 is comprised of five genes that were more strongly increased in Mst1r TK−/− mice after NiSO4 treatment than in control mice, including IL-6 (Il6), and the IL-1 receptor antagonist (Il1rn). The genes of Set 7 were similarly, though not quite as strongly increased. Several important chemokines (CXCL5, CCL9, CCL22) are in this group.
Two groups of genes were decreased in a genotype-dependent manner after Ni exposure. The 20 genes in Set 9 were decreased in Mst1r TK+/+ mice more than they decreased in Mst1r TK−/− mice after NiSO4 treatment. This group includes IFN regulatory factor 4 (Irf4) and at least 2 Ig-related genes. The genes of Set 11 also decreased more in Mst1r TK+/+ mice than in Mst1r TK−/− mice, but these genes started out with a higher baseline expression level before Ni treatment, as well. There are five genes in this group, including procollagen (Col15a1), TNF receptor–associated factor (Traf1), and the PI3-kinase regulatory subunit (Pik3r2). This is especially noteworthy, as the PI3 kinase pathway is one of the cascades used in Mst1r intracellular signaling.
The genes of Set 10 show an interesting regulation; they were highly expressed in untreated Mst1r TK−/− mice, but not in wild-type animals. After NiSO4 treatment, the expression of these transcripts in Mst1r TK−/− mice was decreased to the baseline levels seen in control mice. Four of the five genes in this group are members of the granzyme (Gzm) family (granzymes D, E, F, and G).
There were two groups of genes that were initially more highly expressed in one genotype than the other, and although there was some regulation of those genes by NiSO4 exposure, these genes always remained higher in the select genotype. Of these genes, Set 5 was higher in Mst1r TK−/− mice throughout the experiment, compared with Mst1r TK+/+ controls. This set includes several Ig genes (for both the light and heavy chains) as well as the B-cell antigen receptor gene (Igh-VJ558). Finally, Set 8 is composed of 13 genes that remained higher in Mst1r TK+/+ mice than in the Mst1r TK−/− mice, regardless of treatment.
Functional Classification of Genes
Table 1 displays a subset of genes identified in the analysis, classified by function. Although expression differences between Mst1r TK+/+ and Mst1r TK−/− mice encompass several classes of gene function, many of the differentially expressed genes correspond to mediators of the immune and inflammatory responses. Many of these immune system and inflammatory genes are increased in the Mst1r TK−/− mice. In particular, IL-6 (Il6) and the IL-1 receptor antagonist both show stronger increases after NiSO4 treatment in Mst1r TK−/− mice compared with control animals. There are also three Ig-related genes, IgG heavy chain 4, Igκ-V8, and Igκ-V28, the expression of which is higher in the Mst1r signaling–deficient mice regardless of treatment.
TABLE 1.
SELECTION OF DIFFERENTIALLY REGULATED GENES, GROUPED BY FUNCTIONAL CLASSIFICATION
|
|
|
Mst1r TK+/+
|
Mst1r TK−/−
|
||
|---|---|---|---|---|---|
| Gene | Genbank | 0 h | 24 h | 0 h | 24 h |
| Apoptosis and Cytolysis Genes | |||||
| Angptl4 | NM_020581 | 0.626 | 1.697 | 0.749 | 2.711 |
| Cdkn1a | NM_007669 | 0.391 | 2.399 | 0.469 | 2.892 |
| Gzmb | NM_013542 | 0.818 | 1.303 | 1.127 | 1.673 |
| Gzmd | NM_010373 | 0.010 | 0.010 | 1.199 | 0.010 |
| Gzmf | NM_010374 | 0.221 | 0.076 | 3.086 | 0.119 |
| Gzmg | NM_010375 | 0.193 | 0.141 | 3.871 | 0.156 |
| Gzmm | NM_008504 | 0.470 | 0.982 | 0.320 | 1.109 |
| Hc | NM_010406 | 1.320 | 0.211 | 1.166 | 0.098 |
| Cell Adhesion Molecules | |||||
| Bcar1 | NM_009954 | 1.145 | 0.034 | 0.336 | 1.059 |
| Cdh16 | NM_007663 | 1.018 | 0.326 | 1.703 | 0.128 |
| Cntn1 | NM_007727 | 1.060 | 1.228 | 0.512 | 0.211 |
| Col15a1 | NM_009928 | 1.571 | 0.253 | 0.549 | 0.163 |
| Col1a1 | NM_007742 | 1.273 | 0.424 | 1.085 | 0.484 |
| Col1a2 | NM_007743 | 1.054 | 0.580 | 1.135 | 0.565 |
| Col3a1 | NM_009930 | 1.259 | 0.411 | 1.153 | 0.563 |
| Col4a5 | NM_007736 | 1.184 | 0.409 | 1.318 | 0.399 |
| Col5a1 | NM_015734 | 1.276 | 0.378 | 1.142 | 0.577 |
| Col6a3 | NM_009935 | 1.186 | 0.503 | 1.148 | 0.544 |
| Cspg2 | NM_019389 | 0.010 | 0.665 | 0.010 | 5.625 |
| Gas6 | NM_019521 | 1.089 | 0.566 | 1.236 | 0.541 |
| Itga8 | XM_140813 | 1.088 | 0.536 | 1.324 | 0.297 |
| Nid1 | NM_010917 | 1.124 | 0.489 | 1.249 | 0.924 |
| Selp | NM_011347 | 0.014 | 1.027 | 0.010 | 1.144 |
| Tnc | NM_011607 | 0.920 | 1.276 | 0.852 | 3.960 |
| Tyro3 | NM_019392 | 1.229 | 0.406 | 1.134 | 0.347 |
| Vtn | NM_011707 | 1.122 | 0.500 | 1.394 | 0.399 |
| Immune, Inflammatory, and Acute-Phase Response Genes | |||||
| Ccl11 | NM_011330 | 0.590 | 2.170 | 0.681 | 2.665 |
| Ccl17 | NM_011332 | 0.010 | 1.048 | 0.010 | 1.240 |
| Ccl2 | NM_011333 | 0.061 | 2.759 | 0.067 | 3.844 |
| Ccl22 | NM_009137 | 0.650 | 1.973 | 0.631 | 3.349 |
| Ccl7 | NM_013654 | 0.058 | 2.444 | 0.526 | 3.668 |
| Ccl9 | NM_011338 | 0.826 | 1.485 | 0.822 | 2.414 |
| Cxcl1 | NM_008176 | 0.480 | 2.862 | 0.436 | 3.165 |
| Cxcl5 | NM_009141 | 0.737 | 1.471 | 0.779 | 3.391 |
| Gbp1 | NM_010259 | 0.937 | 1.904 | 0.188 | 0.010 |
| Hc | NM_010406 | 1.320 | 0.211 | 1.166 | 0.098 |
| Ifi202b | NM_008327 | 0.734 | 1.373 | 1.126 | 2.282 |
| Ifi205 | NM_008328 | 0.431 | 3.178 | 0.449 | 1.508 |
| Igk-V28 | L14553 | 0.273 | 0.947 | 1.618 | 2.807 |
| Igk-V8 | NM_019633 | 0.858 | 0.811 | 1.710 | 2.476 |
| Il1b | NM_008361 | 0.536 | 2.163 | 0.490 | 1.859 |
| Il1rn | NM_031167 | 0.638 | 1.895 | 0.010 | 4.917 |
| Il6 | NM_031168 | 0.010 | 1.084 | 0.010 | 2.794 |
| Mcpt6 | NM_010781 | 0.482 | 0.948 | 0.516 | 0.456 |
| Pglyrp1 | NM_009402 | 0.723 | 1.890 | 0.430 | 1.049 |
| Reg3g | NM_011260 | 0.682 | 2.070 | 0.272 | 0.333 |
| Saa2 | NM_011314 | 0.010 | 1.093 | 0.010 | 1.008 |
| Saa3 | NM_011315 | 0.016 | 3.119 | 0.025 | 2.997 |
| Selp | NM_011347 | 0.014 | 1.027 | 0.010 | 1.144 |
| Tnfsf9 | NM_009404 | 0.115 | 1.574 | 0.118 | 1.180 |
| V κ | AF045026 | 1.158 | 0.360 | 1.351 | 1.488 |
| Muscle Development | |||||
| Acta1 | NM_009606 | 0.095 | 3.620 | 0.080 | 0.442 |
| Mef2c | NM_025282 | 1.106 | 0.023 | 0.663 | 0.929 |
| Myh1 | XM_354615 | 0.163 | 3.242 | 0.068 | 0.707 |
| Myl1 | NM_021285 | 0.554 | 2.296 | 0.332 | 0.512 |
| Myl2 | NM_010861 | 0.105 | 1.837 | 0.124 | 0.138 |
| Mylpf | NM_016754 | 0.679 | 1.883 | 0.454 | 0.473 |
| Phka1 | NM_008832 | 1.156 | 0.430 | 1.074 | 0.571 |
| Pvalb | NM_013645 | 0.865 | 1.329 | 0.893 | 0.106 |
| Tnnt3 | NM_011620 | 0.193 | 2.889 | 0.256 | 0.339 |
| Cell Cycle and Proliferation Genes | |||||
| Cdkn1a | NM_007669 | 0.323 | 3.065 | 0.271 | 3.351 |
| Cxcl1 | NM_008176 | 0.480 | 2.862 | 0.436 | 3.165 |
| Il1b | NM_008361 | 0.536 | 2.163 | 0.490 | 1.859 |
| Junb | NM_008416 | 0.609 | 2.070 | 0.665 | 1.998 |
| Maff | NM_010755 | 0.550 | 2.610 | 0.423 | 2.187 |
| Myc | NM_010849 | 0.398 | 2.517 | 0.582 | 2.683 |
| Plagl1 | NM_009538 | 1.142 | 0.358 | 1.549 | 0.236 |
| Sfn | NM_018754 | 0.063 | 3.466 | 0.107 | 4.057 |
| Zfp145 | XM_134826 | 0.348 | 2.333 | 1.295 | 1.402 |
| Proteolysis- and Peptidolysis-Related Genes | |||||
| Adam19 | NM_009616 | 1.220 | 0.423 | 1.131 | 0.485 |
| Adam8 | NM_007403 | 0.699 | 2.416 | 0.720 | 2.999 |
| Anpep | NM_008486 | 1.277 | 0.341 | 1.174 | 0.281 |
| Enpep | NM_007934 | 1.073 | 0.544 | 1.296 | 0.438 |
| Gzmb | NM_013542 | 0.818 | 1.303 | 1.127 | 1.673 |
| Gzmd | NM_010373 | 0.010 | 0.010 | 1.199 | 0.010 |
| Gzmf | NM_010374 | 0.221 | 0.076 | 3.086 | 0.119 |
| Gzmg | NM_010375 | 0.193 | 0.141 | 3.871 | 0.156 |
| Gzmm | NM_008504 | 0.470 | 0.982 | 0.320 | 1.109 |
| Mcpt6 | NM_010781 | 0.482 | 0.948 | 0.516 | 0.456 |
| Mest | NM_008590 | 1.330 | 0.314 | 1.066 | 0.334 |
| Mmp12 | NM_008605 | 0.673 | 2.170 | 0.614 | 2.036 |
| Mmp15 | NM_008609 | 1.354 | 0.297 | 1.100 | 0.344 |
| Mmp3 | NM_010809 | 0.744 | 1.683 | 0.836 | 4.420 |
| Ndst1 | NM_008306 | 0.889 | 0.591 | 1.557 | 0.209 |
| Pace4 | BC037450 | 0.910 | 1.242 | 1.423 | 1.966 |
| Prss7 | NM_008941 | 1.014 | 1.273 | 0.492 | 0.832 |
| Tfrc | NM_011638 | 0.589 | 1.718 | 0.974 | 2.121 |
| Zdhhc3 | NM_026917 | 1.243 | 0.460 | 1.111 | 0.488 |
| Response to DNA Damage | |||||
| Atm | NM_007499 | 1.266 | 1.066 | 0.222 | 0.031 |
| Cdkn1a | NM_007669 | 0.391 | 2.399 | 0.469 | 2.892 |
| Rad23b | NM_009011 | 0.914 | 0.901 | 1.596 | 2.671 |
| Cell Surface Receptor–Linked Signal Transduction Genes | |||||
| Cd79a | NM_007655 | 1.219 | 0.421 | 1.212 | 0.937 |
| Fzd2 | NM_020510 | 1.293 | 0.457 | 1.035 | 0.507 |
| Il1r2 | NM_010555 | 0.492 | 2.191 | 0.713 | 2.873 |
| Il1rn | NM_031167 | 0.638 | 1.895 | 0.010 | 4.917 |
| Osmr | NM_011019 | 0.716 | 1.980 | 0.589 | 2.185 |
| Ptdsr | NM_033398 | 0.559 | 1.831 | 0.898 | 2.019 |
Data presented are the average normalized expression for each gene.
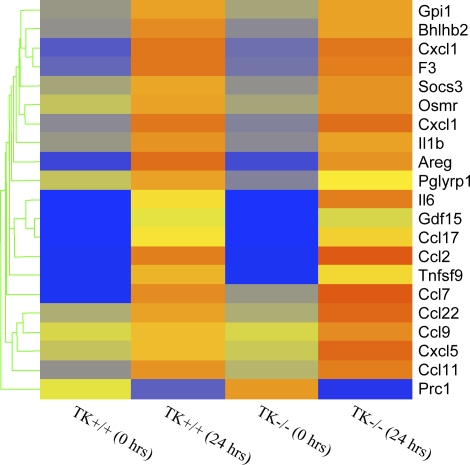
Genes controlling cytokine and chemokine production also show regulation in this model (Table 1 and Figure 2). Most of these genes were increased in both genotypes to a similar extent. However, IL-6 and three chemokine ligand genes, CCL9, CCL22, and CXCL5, were increased more in Mst1r TK−/− mice than they were in control mice (Figure 2).
Figure 2.
Cluster analysis of cytokines and chemokines. Genes that are functionally classified as either cytokines or chemokines are ordered by expression pattern. Colored bars indicate relative expression levels. Genes that are expressed at higher levels are assigned progressively brighter shades of red, whereas genes expressed at low levels are assigned shades of blue. The data represent an average of duplicate chips, which were hybridized with RNA pooled from three animals for each treatment group.
Confirmation of Gene Expression Data
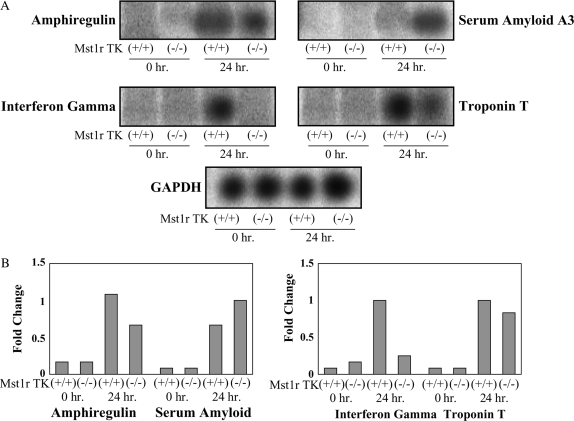
To provide an additional confirmation of the results obtained from the microarray hybridization experiments, mRNA levels for seven selected genes were assayed by Northern analysis. These genes showed a significant change after 24-h exposure in at least one genotype. This group includes amphiregulin, IFN-γ, serum amyloid, and troponin T (Figure 3), as well as granzymes D, F, and G (Figures 4, 5, and 6).
Figure 3.
Confirmation of the microarray results. Total RNA was isolated from Mst1r TK+/+ and Mst1r TK−/− mice before, and 24 h after, NiSO4 treatment. Relative levels of mRNA for serum amyloid A, amphiregulin, troponin T and IFN-γ were assessed by Northern analyses. A representative of three separate experiments, with similar results, is shown. (A) Northern blot showing hybridization of 32P-labeled probes. (B) Quantification of hybridization signal showing the fold change in expression after normalization with glyceraldehyde phosphate dehydrogenase (GAPDH) for each individual gene.
Figure 4.
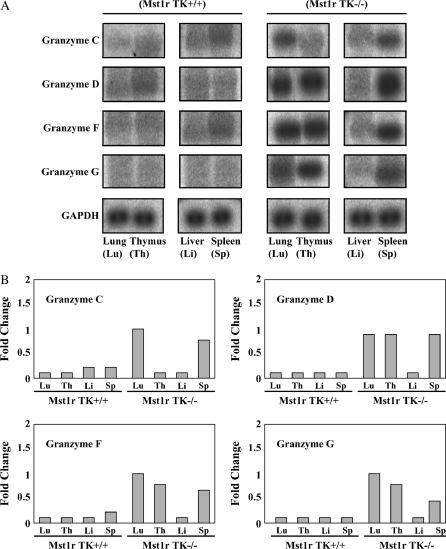
Northern analyses of granzymes C, D, F, and G. Total RNA was isolated from the lung, thymus, liver and spleen of untreated Mst1r TK+/+ and Mst1r TK−/− mice. Relative levels of mRNA for granzymes C, D, F, and G were assessed by Northern analyses. Shown is a representative analysis of three separate experiments with similar results. (A) Representative Northern blot showing hybridization of 32P-labeled probes to tissue-specific RNA. (B) Quantification of hybridization signal from (A). The degree of probe hybridization to RNA from each tissue was measured by spot densitometry. The bar graphs show the fold change in expression of each individual gene after normalization to GAPDH expression.
Figure 5.
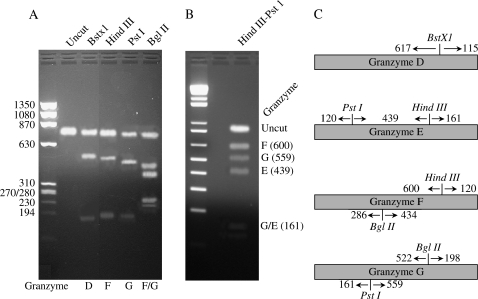
Diagnostic restriction enzyme analysis. (A) Diagram of select diagnostic restriction enzymes in granzyme D, E, F, and H. (B and C) Reverse transcriptase PCR was performed on RNA from lung tissue of untreated Mst1r TK−/− mice using one set of primers that would amplify the set of granzymes D–G. This product was then subjected to restriction enzyme digestion with BstXI ([B], lane 3), HindIII ([B], lane 4), PstI ([B], lane 5), BglIII ([B], lane 6), or a combination of HindIII and PstI ([C], lane 3). The undigested DNA is shown in (B), lane 2. Molecular weight markers are as listed.
Figure 6.
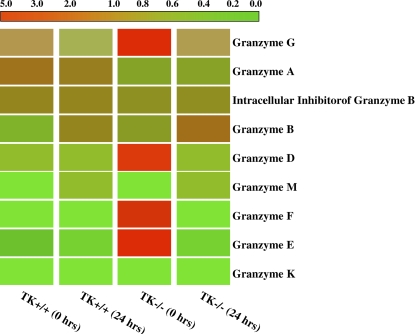
Cluster analysis of granzymes expression. Granzymes B–M are ordered by expression pattern. Colored bars indicate relative expression levels. The bright red color corresponds to high expression, and green color represents a low level of gene expression. The data represent an average of duplicate chips, which were hybridized with RNA pooled from three animals for each treatment group.
Amphiregulin is a ligand for the epidermal growth factor receptor, and the binding of amphiregulin to epidermal growth factor receptor stimulates proliferation of lung epithelial cells (21). The microarray data revealed 20- and 10-fold increases in expression of this gene in Mst1r TK+/+ and Mst1r TK−/− mice after 24 h of Ni exposure, respectively. The Northern analysis illustrates a similar pattern of expression, with amphiregulin RNA levels increasing after Ni exposure in both genotypes, but increasing to a much greater extent in Mst1r TK+/+ lungs compared with the Mst1r TK−/− lungs (Figure 3).
Expression of genes related to serum amyloids were also identified in the microarray analysis. Serum amyloid A (Saa) 3 is an acute-phase apoprotein of high-density lipoproteins found in mammals. This protein is produced in response to inflammation. The transcript level of Saa3 in both genotypes was increased after 24-h exposure to NiSO4, with the Northern blot showing slightly higher expression in Mst1r-deficient animals (Figure 3).
A similar expression pattern was observed with troponin-T, which is part of the contractile apparatus and binds other troponin subunits to tropomyosin (22, 23). Very little troponin T was detected at baseline in either genotype. By 24 h after NiSO4 treatment, troponin levels had increased to a similar extent in both TK+/+ and TK−/− mice (Figure 3).
IFN-γ is a cytotoxic factor that may contribute to cell death and apoptosis. Northern analyses show this gene was expressed in Mst1r TK+/+ animals during induction of lung injury after 24-h exposure and was not detectable in Mst1r TK−/− animals (Figure 3).
Expression Analysis of Granzymes
One of the most striking changes in gene expression seen in this study was in the class of proteins known as granzymes. Members of this large family of proteases are involved in the cytotoxic functions of T cells and NK cells (18, 24). Expression of five specific granzymes (C, D, E, F, and G) were increased strongly in Mst1r TK−/− mice before NiSO4 treatment, but not in Mst1r TK+/+ animals (granzymes C, D, F, and G are shown in Figures 4 and 6). After 24 h of Ni inhalation, granzyme gene expression in Mst1r TK−/− mice had decreased from baseline, whereas the Mst1r TK+/+ granzymes remained unaffected (Figures 4 and 6).
To confirm the increased granzyme gene expression seen on the microarray, a Northern analysis was performed using RNA isolated from the lung, liver, thymus, and spleen of unchallenged Mst1r TK+/+ and Mst1r TK−/− mice (Figure 4). The thymus and spleen were chosen because they are expected to contain a high percentage of T cells and NK cells (two cell types that are known to express high granzyme activity), whereas the liver is a representative tissue that should have relatively few of these cells. Northern analysis for lung tissue confirms the microarray finding that granzymes D, F, and G are elevated in untreated mice that are deficient in Mst1r TK signaling compared with untreated control mice (Figure 4). In addition, the Northern blot identifies granzyme C as being increased in untreated Mst1r TK−/− mice compared with untreated control mice. These four granzymes (C, D, F, and G) are also elevated in the spleen of Mst1r TK−/− animals and, except for granzyme C, in the thymus as well. In contrast, liver tissue shows similar, baseline granzyme levels in Mst1r TK+/+ and Mst1r TK −/− animals (Figure 4).
The genes that code for granzymes D through G have a very high degree of sequence homology (ranging from 84 to 94%) (25, 26). Due to this high degree of homology, a probe for any one of these granzymes genes may hybridize to the other genes in this group (18). To determine if all four of these transcripts are simultaneously expressed in the Mst1r TK−/− mice, RT-PCR was performed on lung RNA, and the amplification products were then subjected to diagnostic restriction enzyme analysis (18). One primer set was generated that would specifically amplify RNA products from granzymes D–G, but not the rest of the granzyme family members (18). After RT-PCR with these primers, restriction analysis with BstXI, BglII, or HindIII/PstI was used to distinguish between the mRNAs encoding granzymes D–G (Figure 5). The results of the RT-PCR analysis show the expected restriction digest fragments for these four granzymes, confirming that granzymes D, E, F, and G are all expressed in the same sample.
To determine the status of the granzyme genes as a family, cluster analyses were performed (Figure 6). Although a number of members of this family were upregulated in the TK−/− mice at baseline (granzymes D, E, F, and G), other members of this family increased after NiSO4 treatment. These Ni-responsive genes include granzymes M and B. The striking Mst1r-dependent impact on this gene family suggests Mst1r as an important coordinate regulator of this gene cluster in vivo.
Histology of Mst1r TK+/+ and TK−/− Mouse Lungs
Previous studies analyzing the significance of Mst1r during ALI found that the Mst1r lungs displayed an earlier onset of pulmonary pathology in response to Ni-induced ALI (6). However, changes in leukocyte infiltration were not evaluated. To examine this, changes in the infiltration of polymorphonuclear (PMN) leukocytes into the lungs were quantitated both before and 36 h after NiSO4 inhalation, as well as after the animals died (Table 2). This microscopic analysis revealed an increase in PMN infiltration after Ni treatment in the lungs of Mst1r TK−/− mice compared with Mst1r TK+/+ control mice. Furthermore, the increased PMN accumulation was present up to the point of death.
TABLE 2.
ASSESSMENT OF POLYMORPHONUCLEAR LEUKOCYTE INFILTRATION INTO THE LUNGS OF Mst1r TK+/+ AND Mst1r TK−/− MICE AFTER EXPOSURE TO NICKEL SULFATE
| Time | Mst1r TK+/+ | Mst1r TK−/− |
|---|---|---|
| 0 h | + | + |
| 36 h | ++ | +++ |
| Death | +++ | ++++ |
Infiltration was scored by the extent of polymorphonuclear coverage in the fields examined by light microscopy: +, < 25%; ++, 25–50%; +++, 50–75%; ++++, > 75%. Data represent the average of three mice per time point.
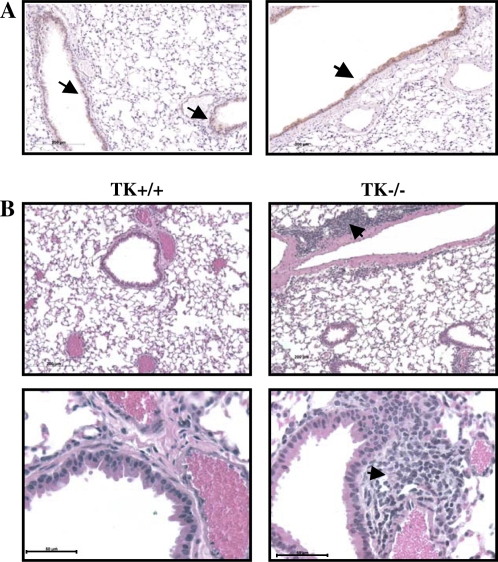
To access overall lung histology in greater detail, tissues were taken from untreated Mst1r TK+/+ or Mst1r TK−/− mice and processed for histologic analyses by hematoxylin and eosin staining (Figure 7). Microscopic analysis of these sections revealed cellular clusters in the lungs of Mst1r TK−/− mice, but not in the lungs of wild-type mice (Figure 7B). These clusters appear near larger vessels and airways in the lung. To determine if there is a potential for Mst1r signaling to influence this cellular clustering, immunohistochemistry was performed on sections taken from lungs of wild-type mice, using an anti-Mst1r antibody. Mst1r-positive staining was principally limited to airway epithelial cells (Figure 7A).
Figure 7.
Histology of lung sections from untreated mice. (A) Sections from the lungs of two different Mst1r TK+/+ mice were stained with an anti-Mst1r antibody and counterstained with hematoxylin. Arrows indicate the presence of Mst1r around the airway epithelium of the lungs. (B) Sections from the lungs of Mst1r TK+/+ and Mst1r TK−/− mice were stained with hematoxylin and eosin Y. Clusters of cells are observed in the lungs of TK−/−, but not wild-type mice. These clusters are observed in all of the TK−/− mice examined.
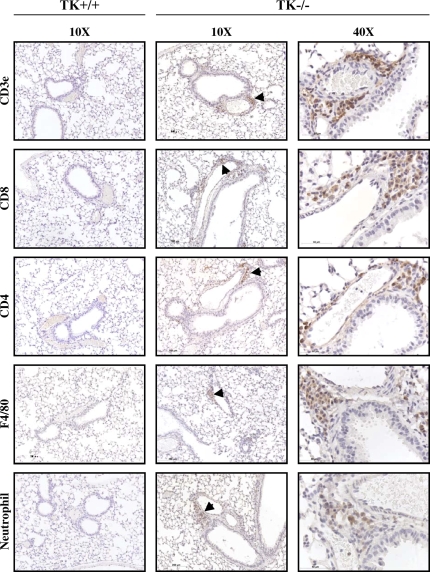
To identify the cell types that compose these clusters, additional immunohistochemistry was performed on lung tissue sections from Mst1r TK−/− mice (Figure 8). An anti-CD3e antibody, which recognizes the T-cell receptor antigen, showed strong staining of cells within the clusters, consistent with the presence of a potentially broad population of T-cell subtypes. Antibodies against CD 4 and CD 8 both showed positive staining in some cells of the clusters, indicating the presence of CD4- and CD8-positive lymphocytes. Staining for the F4/80 antigen, which is present on macrophages, was also seen in some cells of the clusters, whereas neutrophils were identified in the clusters using an antineutrophil antibody. No staining was observed in Mst1r TK+/+ lungs for any of the antibodies utilized in these analyses (Figure 8). In addition, no background staining was observed in serial sections of the Mst1r TK−/− lungs stained with isotypic control antibodies (data not shown). The staining pattern in Figure 8 indicates that the clusters of cells in lungs of untreated Mst1r TK−/− mice include cells critical to innate immunity, which are not seen in the lungs of Mst1r TK +/+ mice. Whereas the composition of cells within individual clusters varied, the clusters were made up of mainly T cells, followed by macrophages and neutrophils.
Figure 8.
Leukocytes in lung tissue of Mst1r TK−/− mice. Tissue sections from the lungs of Mst1r TK+/+ and TK−/− mice were stained for various inflammatory cell markers. No staining was observed in the TK+/+ lungs. Positive staining in the TK−/− lungs indicates the presence of T cells (CD3e, CD4, and CD8), natural killer cells (CD8), macrophages (F4/80), and neutrophils in the cell clusters.
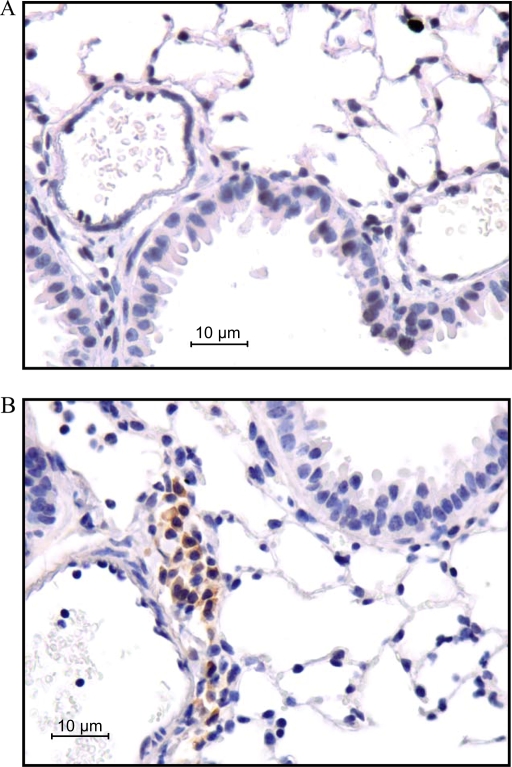
To determine if the cell clusters contributed to the differential expression of granzyme proteins observed in the Mst1R TK−/− mice, immunohistochemistry was performed. As is apparent in Figure 9, granzyme D protein expression is present in the cellular clusters of the lungs of the TK−/− mice, whereas no expression is detected in control lungs.
Figure 9.
Granzyme D staining in sections of lungs from untreated mice. Lung sections from both Mst1r TK+/+ (A) and TK −/− (B) mice were stained with an anti–granzyme D antibody. Note the presence of granzyme D reactivity in the cell clusters from the lungs of Mst1r TK−/−, but not in the lungs of wild-type mice.
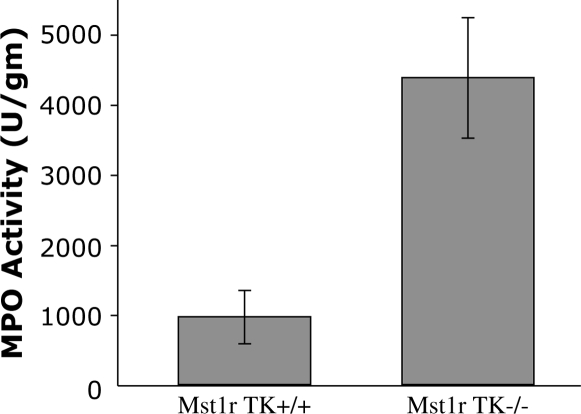
To determine if the cell clusters seen in lungs from Mst1r TK−/− mice correspond to an increased number of neutrophils, the level of MPO activity was measured in homogenates from untreated wild-type and Mst1r TK−/− lungs. MPO, a prominent enzyme contained in azurophilic granules, is an index of neutrophil infiltration. The Mst1r TK−/− lungs had about a 4.5-fold greater MPO activity than that in the Mst1r TK−/− lungs (Figure 10), a finding consistent with an increase in neutrophil numbers in the Mst1r TK−/− lungs noted with the antineutrophil staining (Figure 8).
Figure 10.
Myeloperoxidase (MPO) activity. Lung tissue from untreated Mst1r TK+/+ and TK −/− mice was homogenized and assayed for myeloperoxidase levels. Data are the average (± SEM) of four (TK−/−) or five (TK+/+) mice; P < 0.05.
DISCUSSION
The Mst1r receptor TK is the receptor for macrophage-stimulating protein (also known as HGFL). Signaling through this ligand-receptor complex influences numerous physiologic functions, including cell adhesion and motility, carcinogenesis, inflammation, and modulation of the immune system (10–12, 27). It is known that Mst1r signaling occurs through several intracellular pathways, with the potential to activate transcription of many different genes (10, 28). ALI evokes many changes in gene expression, including changes in genes involved in innate immunity. Previous work has shown that mice lacking the ability to signal through Mst1r (Mst1r TK−/−) are more susceptible to Ni-induced ALI and have a significantly decreased survival time after Ni exposure than control mice (6). This increased lethality of NiSO4 inhalation in Mst1r TK−/− mice may indicate a protective role for Mst1r signaling, whereby activity of Mst1r serves to modulate the tissue-damaging effects that can be present during acute immune system activation. Due to the potential for Mst1r to influence expression of a wide variety of genes, this study was undertaken to evaluate the contribution of Mst1r signaling to gene expression in the NiSO4-induced ALI model, and to correlate the genetic changes to differences in the biological phenotype of these mice.
Changes in gene expression after Ni-induced ALI were monitored using an Affymetrix murine microarray, which surveys more than 12,000 different DNA sequences. A comparison of the gene expression profile from control (Mst1r TK+/+) mice and Mst1r TK−/− mice, both before and after 24 h of continuous exposure to aerosolized Ni particles, revealed 343 probe sets, the level of which was changed at least two-fold in one or more pair-wise comparisons. Some of these changes may have resulted from the alveolar cellular defense against damage, whereas others may have potentiated the damage when repair became impossible. Among this set of 343 differentially expressed transcripts, 8 were further characterized by Northern analyses. The results of the microarray and Northern analyses showed similar levels of gene activation, indicating that the changes seen on the gene array reflect actual differences in mRNA expression.
Earlier work exploring the changes in gene expression profile after NiSO4 treatment in C57BL/6 mice showed both increasing and decreasing gene expression over a time course of 3–96 h (6). Many of the genes identified in that study also showed changes in expression here. Included in this group is metallothionein-1 and galectin-3, which increased strongly in both genotypes after treatment. In addition, the present study also identified metallothionein-2 as strongly increased in both genotypes after treatment. Metallothioneins are small, cysteine-rich proteins that bind a number of metals, including zinc and cadmium. Evidence indicates that they are produced by the body in response to stress, and thus may play a role in immune function.
Another gene that was identified by McDowell and colleagues as being increased after Ni exposure was elastin (6). Elastin is an extracellular matrix protein that is responsible for the elastic properties of many tissues. This macromolecule is a critical component of the lung interstitium and helps to provide the elastic recoil necessary for proper ventilation. Our study also identified elastin as being increased after Ni exposure, but only in the Mst1r TK+/+ animals, not in the Mst1r TK−/−. This lack of elastin induction in Mst1r TK−/− mice indicates that Mst1r signaling is likely needed for expression of this gene after severe lung insult. The inability of Mst1r TK−/− mice to increase production of this elastic macromolecule after lung injury may lead to decreased ventilation, which could contribute to the decreased survival seen in Mst1r TK−/− mice.
One particularly interesting grouping of genes to emerge from this study was the genes in Set 6 of Figure 1. These genes were increased in control animals after 24 h of Ni exposure, but were not increased in Mst1r TK−/− mice. Included in this grouping were three genes for myosin, one for troponin, and one for actin; all are important for muscle function (23). If the changes in gene expression seen in these samples reflects the changes seen in airway or vascular smooth muscle, this finding may point to a functional mechanism for the previously observed decrease in survival seen in Mst1r TK−/− mice after Ni-injury (6). The inability of Mst1r TK−/− mice to increase these muscle protein mRNAs may correlate with decreased survival of Mst1r TK−/− mice after NiSO4 exposure. This suggests a novel role for Mst1r during an acute challenge.
Another novel finding of this study is that granzymes C, D, E, F, and G were dramatically overexpressed in Mst1r TK−/− mice before injury. After 24-h exposure to NiSO4, transcript levels for granzymes D–G were significantly decreased in Mst1r TK−/− mice (to the levels observed in control animals). Termed “Orphans” (24), the function of granzymes D–G in mice is unknown, although their related family members, granzymes A–C are important in cytolytic cell killing. Grossman and colleagues have suggested that granzymes C–H may be a “fail-safe” mechanism for murine innate immune function (24). Such redundancy would allow cytotoxic T and NK cells (where granzymes are produced) to clear a multitude of infectious agents. However, our data suggest that granzymes C, D, E, F, and G, at least, may also have a functional role in noninfectious models of ALI. One possible role of NK cells may be recognition and removal of apoptotic and necrotic epithelial cells, which may be a critical event in wound healing. On this note, the increase in Amphiregulin may have worked in consort to improve healing in the wild-type mice, because it was increased more in these mice than in Mst1r TK−/− mice.
The coordinated regulation of granzymes D–G is potentially significant, as these genes cluster together on mouse chromosome 14 (24). Expression of these four genes in unchallenged mice that are devoid of Mst1r signaling may indicate that Mst1r serves to downregulate expression of this group of granzymes under normal conditions. In addition, because differences were noted more in the lung, thymus, and spleen than in the liver, these changes in granzymes may reflect a shifting in T cell and NK cell lineage under control of Msp/HGFL and Mst1r.
The present study also provides information on Saa, which is increased in the lung during ALI. A large increase in the level of Saa3 was observed in both mouse genotypes after NiSO4 exposure, and may possibly be linked to the pathophysiology of acute inflammatory diseases. Serum amyloids have a role in the maintenance of the epithelial cells, similar to other epithelium-specific genes, such as keratins or junction proteins (29). Because epithelium-specific gene expression is fundamental to the maintenance and function of lung tissue, the induction of serum amyloid family members in mice after the lung airway epithelia was exposed to NiSO4 may be part of the host defense mechanism that protects these tissues from potential injuries.
Earlier studies indicated that an important feature of this ALI model is the increase of endothelial nitric oxide synthase activity and nitric oxide production after Ni treatment, which, in part, contributes to the pathogenesis of ALI (1, 4–6). In the context of the Ni-induced ALI, the pathogenesis of this disease may involve multiple signaling pathways; one that directs an insult on epithelial and alveolar cells, and others that involve activation of alveolar macrophages in the lung. Leukocyte recruitment requires intercellular signaling between infiltrating leukocytes and the endothelial cells. These events are mediated via the generation of molecules such as chemokines. For instance, the present study showed a number of chemokines and cytokines, such as IL-1b, CXCL1, and CCL7, CCL9, CCL11, CCL17, and CCL22, that all increased after NiSO4 challenge. The changes seen in these chemokines and cytokines may, in fact, be causative agents in the increased PMN infiltration seen in Mst1r TK−/− mice after 36 h of Ni treatment.
Before any treatment, clusters of cells were clearly seen in the lungs of all of the Mst1r TK−/− mice examined, but were not found in wild-type mice. These clusters form near larger blood vessels and around the airway epithelium of the lungs, where Mst1r immunostaining is normally found. An analysis of the clusters shows cells with markers for several immune system subtypes, including T cells, neutrophils, and macrophages. The presence of clusters of immune cells in mice that are deficient in Mst1r signaling may indicate that this TK receptor is responsible for regulating immune cell infiltration, possibly through changes in cytokine production. With these cells already accumulating in Mst1r TK−/− mice, the potential exists for them to cause cytotoxic damage as soon as they are activated after insult, such as occurs in this model of ALI. The various consequences of increased cytotoxic damage during ALI may be a factor in the decreased survival time of Mst1r TK−/− mice during NiSO4 inhalation.
The data presented here indicate a role for the Mst1r signaling pathway in the regulation of macrophage and lymphocyte activation and provide an in vivo model with which to examine the biochemical mechanism beyond the action of cytokines and chemokines. Current data point to a broad role for the Mst1r pathway in regulating macrophage and lymphocyte activation and the resulting proinflammatory signals. The mice described here are a valuable tool with which to define the Mst1r signaling pathway and its regulation of cytokine/chemokine signaling in a biologically relevant system. Future work will be required to identify the mechanisms by which Mst1r mediates suppression of regulators of cytokine-inducible gene expression, and to determine whether the Mst1r signaling pathway affects other signals implicated in macrophage activation.
In summary, this study revealed the expression patterns of genes associated with ALI in relation to the lack of the TK domain of the receptor Mst1r. It also points to relationships initiated from the temporal and functional analyses of differential gene expression during Ni-induced ALI. The most obvious genetic changes were increases in the expression of genes involved in inflammation. In addition, untreated Mst1r TK−/− mice display perivascular and peribronchial clustering of cells within the lung. These cells stain positive for markers found on a variety of lymphocytes, as well as for granzyme D, which is potentially important in cytotoxic T-cell function. The important suggestions that arise from these data are that a variety of lymphocytes may contribute to alveolar injury in mice lacking the TK domain of Mst1r. Activation of these lymphocytes may contribute to the alterations observed in these animals after Ni exposure, and may provide insights into a novel pathway that can influence ALI.
Acknowledgments
The authors acknowledge Kenya Toney for expert technical support.
This work was supported by Public Health Services grants DK073552 (S.E.W.), ES10562 (G.D.L.), HL-65612 (G.D.L.), ES06096 (G.D.L.), National Institutes of Health Training Grant T32 GM08478–10 (L.W.K.), by Cincinnati Shriner's Hospital for Children Project No. 8950 (S.E.W.). S.A.M. was a recipient of the U.S. Environmental Protection Agency Science to Achieve Results Graduate Fellowship and the Albert J. Ryan Fellowship.
Originally Published in Press as DOI: 10.1165/rcmb.2005-0093OC on September 15, 2005
Conflict of Interest Statement: None of the authors has a financial relationship with a commercial entity that has an interest in the subject of this manuscript.
References
- 1.Prows DR, Leikauf GD. Quantitative trait analysis of nickel-induced acute lung injury in mice. Am J Respir Cell Mol Biol 2001;24:740–746. [DOI] [PubMed] [Google Scholar]
- 2.Brower RG. Ventilation in acute lung injury and ARDS 6 ml/kg. End of the story? Minerva Anestesiol 2001;67:248–251. [PubMed] [Google Scholar]
- 3.Ingenito EP, Mora R, Cullivan M, Marzan Y, Haley K, Mark L, Sonna LA. Decreased surfactant protein-B expression and surfactant dysfunction in a murine model of acute lung injury. Am J Respir Cell Mol Biol 2001;25:35–44. [DOI] [PubMed] [Google Scholar]
- 4.Wesselkamper SC, Prows DR, Biswas P, Willeke K, Bingham E, Leikauf GD. Genetic susceptibility to irritant-induced acute lung injury in mice. Am J Physiol Lung Cell Mol Physiol 2000;279:L575–L582. [DOI] [PubMed] [Google Scholar]
- 5.McDowell SA, Gammon K, Bachurski CJ, Wiest JS, Leikauf JE, Prows DR, Leikauf GD. Differential gene expression in the initiation and progression of nickel-induced acute lung injury. Am J Respir Cell Mol Biol 2000;23:466–474. [DOI] [PubMed] [Google Scholar]
- 6.McDowell SA, Mallakin A, Bachurski CJ, Toney-Earley K, Prows DR, Bruno T, Kaestner KH, Witte DP, Melin-Aldana H, Degen SJ, et al. The role of the receptor tyrosine kinase Ron in nickel-induced acute lung injury. Am J Respir Cell Mol Biol 2002;26:99–104. [DOI] [PubMed] [Google Scholar]
- 7.Gaudino G, Follenzi A, Naldini L, Collesi C, Santoro M, Gallo KA, Godowski PJ, Comoglio PM. RON is a heterodimeric tyrosine kinase receptor activated by the HGF homologue MSP. EMBO J 1994;13: 3524–3532. [DOI] [PMC free article] [PubMed] [Google Scholar]
- 8.Han S, Stuart LA, Degen SJ. Characterization of the DNF15S2 locus on human chromosome 3: identification of a gene coding for four kringle domains with homology to hepatocyte growth factor. Biochemistry 1991;30:9768–9780. [DOI] [PubMed] [Google Scholar]
- 9.Ronsin C, Muscatelli F, Mattei MG, Breathnach R. A novel putative receptor protein tyrosine kinase of the met family. Oncogene 1993;8:1195–1202. [PubMed] [Google Scholar]
- 10.Leonard EJ, Danilkovitch A. Macrophage stimulating protein. Adv Cancer Res 2000;77:139–167. [DOI] [PubMed] [Google Scholar]
- 11.Waltz SE, Eaton L, Toney-Earley K, Hess KA, Peace BE, Ihlendorf JR, Wang MH, Kaestner KH, Degen SJ. Ron-mediated cytoplasmic signaling is dispensable for viability but is required to limit inflammatory responses. J Clin Invest 2001;108:567–576. [DOI] [PMC free article] [PubMed] [Google Scholar]
- 12.Leonis MA, Toney-Earley K, Degen SJ, Waltz SE. Deletion of the Ron receptor tyrosine kinase domain in mice provides protection from endotoxin-induced acute liver failure. Hepatology 2002;36:1053–1060. [DOI] [PubMed] [Google Scholar]
- 13.Chee M, Yang R, Hubbell E, Berno A, Huang XC, Stern D, Winkler J, Lockhart DJ, Morris MS, Fodor SP. Accessing genetic information with high-density DNA arrays. Science 1996;274:610–614. [DOI] [PubMed] [Google Scholar]
- 14.Alon U, Barkai N, Notterman DA, Gish K, Ybarra S, Mack D, Levine AJ. Broad patterns of gene expression revealed by clustering analysis of tumor and normal colon tissues probed by oligonucleotide arrays. Proc Natl Acad Sci USA 1999;96:6745–6750. [DOI] [PMC free article] [PubMed] [Google Scholar]
- 15.Lipshutz RJ, Fodor SP, Gingeras TR, Lockhart DJ. High density synthetic oligonucleotide arrays. Nat Genet 1999;21:20–24. [DOI] [PubMed] [Google Scholar]
- 16.Teague TK, Hildeman D, Kedl RM, Mitchell T, Rees W, Schaefer BC, Bender J, Kappler J, Marrack P. Activation changes the spectrum but not the diversity of genes expressed by T cells. Proc Natl Acad Sci USA 1999;96:12691–12696. [DOI] [PMC free article] [PubMed] [Google Scholar]
- 17.Lu SC, Alvarez L, Huang ZZ, Chen L, An W, Corrales FJ, Avila MA, Kanel G, Mato JM. Methionine adenosyltransferase 1A knockout mice are predisposed to liver injury and exhibit increased expression of genes involved in proliferation. Proc Natl Acad Sci USA 2001;98: 5560–5565. [DOI] [PMC free article] [PubMed] [Google Scholar]
- 18.Allen MP, Nilsen-Hamilton M. Granzymes D, E, F, and G are regulated through pregnancy and by IL-2 and IL-15 in granulated metrial gland cells. J Immunol 1998;161:2772–2779. [PubMed] [Google Scholar]
- 19.Bonaldo MF, Lennon G, Soares MB. Normalization and subtraction: two approaches to facilitate gene discovery. Genome Res 1996;6:791–806. [DOI] [PubMed] [Google Scholar]
- 20.Eisen MB, Brown PO. DNA arrays for analysis of gene expression. Methods Enzymol 1999;303:179–205. [DOI] [PubMed] [Google Scholar]
- 21.Lemjabbar H, Li D, Gallup M, Sidhu S, Drori E, Basbaum C. Tobacco smoke–induced lung cell proliferation mediated by tumor necrosis factor alpha–converting enzyme and amphiregulin. J Biol Chem 2003;278:26202–26207. [DOI] [PubMed] [Google Scholar]
- 22.Wang J, Jin JP. Primary structure and developmental acidic to basic transition of 13 alternatively spliced mouse fast skeletal muscle troponin T isoforms. Gene 1997;193:105–114. [DOI] [PubMed] [Google Scholar]
- 23.Roongsritong C, Warraich I, Bradley C. Common causes of troponin elevations in the absence of acute myocardial infarction: incidence and clinical significance. Chest 2004;125:1877–1884. [DOI] [PubMed] [Google Scholar]
- 24.Grossman WJ, Revell PA, Lu ZH, Johnson H, Bredemeyer AJ, Ley TJ. The orphan granzymes of humans and mice. Curr Opin Immunol 2003;15:544–552. [DOI] [PubMed] [Google Scholar]
- 25.Jenne DE, Tschopp J. Granzymes: a family of serine proteases in granules of cytolytic T lymphocytes. Curr Top Microbiol Immunol 1989;140:33–47. [DOI] [PubMed] [Google Scholar]
- 26.Jenne DE, Tschopp J. Granzymes, a family of serine proteases released from granules of cytolytic T lymphocytes upon T cell receptor stimulation. Immunol Rev 1988;103:53–71. [DOI] [PubMed] [Google Scholar]
- 27.Morrison AC, Wilson CB, Ray M, Correll PH. Macrophage-stimulating protein, the ligand for the stem cell–derived tyrosine kinase/RON receptor tyrosine kinase, inhibits IL-12 production by primary peritoneal macrophages stimulated with IFN-gamma and lipopolysaccharide. J Immunol 2004;172:1825–1832. [DOI] [PubMed] [Google Scholar]
- 28.Peace BE, Hill KJ, Degen SJ, Waltz SE. Cross-talk between the receptor tyrosine kinases Ron and epidermal growth factor receptor. Exp Cell Res 2003;289:317–325. [DOI] [PubMed] [Google Scholar]
- 29.Hashimoto K. Regulation of keratinocyte function by growth factors. J Dermatol Sci 2000;24:S46–S50. [DOI] [PubMed] [Google Scholar]


