

Abstract
In this article, we studied how meditation affects the characteristics of the cardiovascular system, mainly based on blood pressure waveforms (BPW). Four parameters derived from BPW include the rising slope (h1/t1), normalized height of T wave (h3/h1), normalized height of V3 valley (h4/h1) and normalized height of D wave (h5/h1), where t1 and hi, i = 1, … ,5 are quantitative features of the BPW waveform pattern. A larger value of h1/t1 reflects better heart ejection ability and aorta compliance. A larger value of h3/h1 may infer an arterial system with good elasticity. The decrease (increase) of h4/h1 parameter indicates the decrease (increase) of peripheral resistance of vessels. A larger value of h5/h1 indicates better artery elasticity and aortic valve function. In comparison with the control group, Zen-meditation practitioners have more after-meditation h1/t1, h3/h1 and h5/h1 increase, with more h4/h1 decrease, with statistical significance (P < 0.05). The observation allows us to infer that Zen meditation may effectively improve relevant characteristics of the cardiovascular system.
Keywords: blood pressure waveform, cardiovascular system, meditation, sphygmogram
Introduction
The blood pressure waveform (BPW) of the systemic arterial tree is an important determinative of cardiovascular system performance. This signal originates in the systole and diastole of the heart and conveys such information as blood ejection ability of the heart, elasticity of the artery wall and peripheral resistance, etc. (1). In examinations of the clinical value of BPW, Han explored possible biophysical and pathologic mechanisms of BPW from the viewpoint of hemodynamics (2). Research showed that BPW analysis is a highly reproducible method and easy to apply to clinical studies. This measure provides important information about arterial stiffness and cardio-vascular interactions (3,4). Abnormality in the BPW is linked to various physiologic or pathologic states such as aging and hypertension (5,6). Actually, the BPW of the radial artery detected at the wrist is the sphygmographic signal used in Traditional Chinese Medicine (TCM) (7). According to theory of the sphygmographic signal, the TCM clinician can identify the status of the human body and treat the patient.
As more clinical evidence supported the benefits of meditation for health, about fifty years ago researchers began investigating the physiologic phenomena of the human body under meditation. Dillbeck et al. (8) compared the physiologic differences in two groups of subjects, one under transcendental meditation and the other at rest. Some research found that the training of transcendental meditation could significantly lower the systolic and diastolic blood pressure of hypertensive persons (9–12). Meditation hereafter became a feasible method to improve hypertension. Hankey, (13) compared Tibetan Buddhist meditation with Transcendental Meditation. He summarized how practicing different meditation techniques influenced hypertension and other physiologic changes. Barnes et al. (14) found that, under meditation, total peripheral resistance decreased and they suggested that was why meditation could decrease or control hypertension. To assess how meditation affects the cardiovascular system, this paper presents a quantitative approach to evaluate variations in BPW before and after meditation sessions.
We measured the blood pressure waveforms of twenty Zen-meditation participants and twenty normal, healthy subjects in the same age range as the participants. According to the clinical experience of TCM professionals, we designed a set of parameters that quantify the waveform patterns of BPW.
Methods
Recording Procedure
Figure 1 displays the instrument for recording BPW from the wrist with a piezoelectric sensor. The sensor was manufactured by Skylark Company, with 3dB cutoff frequency at 10 KHz. The output is linearly dependent on the input when BP is below 1000 mmHg. The subject sat with one forearm on the desk. The angle between upper arm and desk is about 120°. Pressure of the piezoelectric sensor on the wrist was adjusted for sufficient sensitivity of the BPW activity. The range of amplitude depends on the measuring position. In this study, we measured the BPW at the ‘chun’ position (Fig. 2). A well experienced TCM expert assisted us in the experimental setup and recording. He searched the ‘chun’ position by palpating the wrist of the subject. The piezoelectric sensor was then attached to the proper position carefully identified by the expert. The pressure was adjusted until the output amplitude reached maximum, from which the amplitude recorded was in the range of 15–27 mmHg (15).
Figure 1.

The acquiring instrument of blood pressure waveform.
Figure 2.

The measuring position on the wrist.
BPW Mechanism
The BPW prototype of a healthy subject is shown in Fig. 3. The heart pumping mechanism correlating with BPW is illustrated as follows (Fig. 4). The ejection of blood from the left ventricle into the aorta results in the first peak in BPW that is called the Percussion wave (P wave). The height of P wave, h1 and the fast ejection time of the left ventricle, t1 is related to the ejection ability of heart and the compliance index of aorta. We define the rising slope of P wave as h1/t1. A larger slope indicates a better performance of the heart ejection function and aorta compliance (15). Thus it is used as a quantitative feature to evaluate the cardiovascular system.
Figure 3.

Prototype of a normal blood pressure waveform.
Figure 4.

(a). When the ventricle contracts, the semilunar valve opens. Blood ejects into the aorta and arteries and makes them expanded. At the same time, the pressure stores in the elastic walls. This percussion produces the P wave. (b). Isovolumic ventricular relaxation makes the semilunar valve shut. Elastic recoil of arteries sends blood forward into the rest of circulatory system. This rebound makes the T wave and the closing of valve makes the D wave.
The second peak, called the Tidal wave (T wave), appears when blood hits the artery wall and rebounds. As a result, T wave is manifest if the artery possesses excellent elasticity that reflects low peripheral resistance of the circulatory system. On the other hand, an artery with a stiff wall makes the T wave propagate fast according to the Moens–Korteweg equation of wave velocity (16,17). Accordingly, the T wave will merge with the P wave, which results in a wider P wave. The second parameter, h3/h1 where h3 represents the height of T wave, is utilized to measure the effect of T wave. We thus expect a large h3/h1 for an arterial system with better elasticity. The valley height h4 reveals the level of peripheral resistance (15,1). As the peripheral resistance increases (decreases), parameter h4 increases (decreases) as well. The normalized parameter, h4/h1 is employed to measure the drift of peripheral resistance. Finally, when the aortic valve is closed, the Dicrotic wave (D wave) is generated. h5 is the magnitude of D wave and the normalized parameter, h5/h1 represents the effect of D wave on arterial system. h5 will decrease due to a stiff aorta or aortic regurgitation.
Parameters
The peak or valley positions in Fig. 3 demonstrated by crosses are determined by the Matlab program for searching the local maximum or minimum. We first identify the P wave that is the most distinctive one. The starting point V1 of the whole period is about 0.1 s prior to the P wave. The next step is to find the local minimum V3 at about 0.35 s afterward from V1. Then the T wave between P wave and V3 is ready to be extracted. D wave comes after V3, which is identified by finding the null of waveform differentiation between V3 and the end of the BPW period. The time values of these specific points depend on the blood speed and the conditions of blood vessels. We referred to the paper by Xie (18) to check the standard time values of these parameters.
In this research, the above four parameters, h1/t1, h3/h1, h4/h1 and h5/h1 are used to assess the status of cardiovascular system and corresponding parameters are defined as follows:
| (1) |
| (2) |
| (3) |
| (4) |
| (5) |
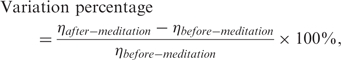 |
(6) |
where η denotes one of the four parameters, h1/t1, h3/h1, h4/h1 or h5/h1. Note that, due to the variations in recording system characteristics and physiologic conditions of each subject, heights h3–h5 were normalized to within the range of 0–1. Normalization ensures an even comparison of BPW features in various recording sessions. To avoid null denominator caused by the disappearance of before-meditation T wave (in the case, h3 = 0), the variation percentage of h3/h1 is defined to be zero if T wave is absent before and after meditation. On the other hand, if T wave exists only after meditation, the variation percentage of h3/h1 will be assigned to 100% to avoid infinity.
Experiment and Results
Processing the Signal
The blood pressure waveforms of radial artery non-invasively detected at wrist by piezoelectric transducer were recorded for 10 s and digitized at a sampling rate of 100 Hz. To reduce high frequency noise, a low-pass filter is designed with a 3 dB cutoff frequency of 50 Hz. Since null baseline was required in the analysis, we removed the mean value of each BPW period in pre-processing. Accordingly, negative waveforms might appear. Note that non-constant, linear baseline drift sometimes interfered in the BPW (Fig. 5) (15). The sources of interference include the body movement, heavy respiration, etc. The resulting artifacts might be false amplitude or position shift of peaks/valleys. Although removal of the baseline drift may help, we found it necessary to further correct the interference patterns. In that case, baseline removal involved a linear-regression method for baseline-drift detection.
Figure 5.

The linear baseline drift in the BPW (upper) and the result after removing it (lower).
The BPW recording instrument can only continuously trace for up to 10 s. BPW is a quasi-periodic signal with 10–16 complete cycles in a 10 s term. Here we averaged out the 10–16 cycles to get the final BPW for further quantification of embedded features. We thus can obtain triple to quadruple SNR (signal-to-noise ratio) that is linearly dependent of the square root of the number of measurements. The SNR level could fulfill our research requirements.
Subjects
The participants were divided into two groups—20 meditation practitioners and 20 normal, healthy people without any experience in meditation. In the experimental group, 13 females and 7 males with a mean age of 26.6 ± 2.2 years participated. Their experiences in Zen-Buddhist practice span 6.9 ± 3.3 years. The control group comprised 9 females and 11 males with a mean age of 25.2 ± 1.8 years. All the meditation practitioners learned Zen-Buddhist meditation in the Taiwan Zen-Buddhist Association. Only experienced practitioners with more than 3 years of meditation experience were invited. The controls were graduate students of National Chiao-Tung University. No subjects had any cardiovascular disease in their medical histories.
Recording
Participants sat in an isolated space during the experiments. Blood pressure waves were recorded before and after the 40 min main session (meditation or relaxation). In the main session, experimental group practiced Zen meditation, while controls sat in normal relaxed position with eyes closed.
BPW Before and After Meditation
Figure 6 illustrates an example of the BPW of a meditation practitioner. The solid curve shows the before-meditation BPW and the dashed one shows that after meditation. In Fig. 6, after-meditation P wave rises more steeply than the before-meditation one. For this particular subject, poor arterial elasticity makes the before-meditation T wave occur earlier and merge with P wave, resulting in a broadened P wave. In after-meditation BPW, the T wave becomes evident and distinguishable from the P wave, inferring that enhanced arterial elasticity is a consequence of meditation practice. Moreover, the V3 valley descends (i.e. h4 decreases) after meditation, indicating a decrease in peripheral resistance. The D wave magnitude is also strengthened after meditation. A typical example of 10 s BPW is shown in Fig. 7. Note that the pulse rate is slower after meditation, resulting in a phase difference between the two waves. In summary, the after-meditation BPW reflects a more robust cardiovascular system that could have been tuned up by the Zen meditation.
Figure 6.

The before-meditation (solid curve) and after-meditation (dashed curve) BPW for an experimental subject.
Figure 7.

The 10s typical BPW of one meditation practitioner.
Comparison Between Groups
Table 1 shows the results of the four parameters measured in both groups. The variation percentage of each parameter in each group is calculated by the formula (6). The P-values in Table 1 are evaluated using t-test, which is used to check whether the variation percentages show statistical differences between the groups. In this preliminary investigation, we concentrated on intra-subject differences between various experimental sessions because the inter-subject variations in BPW were too complicated to manipulate.
Table 1.
The statistical results of four parameters (h1/t1, h3/h1, h4/h1, h5/h1) and their variation percentages; P values are evaluated to show the statistical significance of discrimination between two groups
| h1/t1 | h3/h1 | h4/h1 | h5/h1 | ||
|---|---|---|---|---|---|
| Control group | Before Relaxation (Mean ± Std.) | 380.6 ± 26.0 | 0.21 ± 0.19 | 0.27 ± 0.08 | 0.13 ± 0.04 |
| After Relaxation (Mean ± Std.) | 405.7 ± 25.3 | 0.25 ± 0.19 | 0.24 ± 0.07 | 0.15 ± 0.07 | |
| Variation percentage | 6.7% | 13.0% | −9.3% | 14.2% | |
| Experimental group | Before Meditation (Mean ± Std.) | 390.8 ± 28.0 | 0.20 ± 0.19 | 0.25 ± 0.09 | 0.13 ± 0.04 |
| After Meditation (Mean ± Std.) | 435.1 ± 18.9 | 0.36 ± 0.13 | 0.22 ± 0.08 | 0.16 ± 0.03 | |
| Variation percentage | 11.7% | 41.2% | −13.5% | 27.9% | |
| P-value | 0.005 (<0.05) | 0.026 (<0.05) | 0.032 (<0.05) | 0.029 (<0.05) |
In comparison with the control group, Zen-meditation practitioners have higher ranges of variation percentages in all four parameters. The performance details of each parameter are as follows: When considering the rising slope of P wave, h1/t1, that reflects the ejection ability of left ventricle or aorta elasticity, the experimental group had a mean increase from 390.8 to 435.1, a variation percentage of 11.7%, that was 5% higher than the variation percentage of control group. The second parameter h3/h1, measuring the effect of T wave, demonstrated distinct enhancement of arterial elasticity in the experimental group (three times the increasing rate of the control group). We discovered that even though some experimental subjects had vague T wave before meditation, it was often boosted after meditation. On the other hand, T wave variation was not as obvious in the control group. We observed that some control subjects did not even have a T wave before and after relaxation. If T waves merged with P waves, the parameter h3/h1 was considered to be zero. Next, the high decreasing rate of h4/h1 revealed reduced peripheral resistance after meditation. Finally, the increasing h5/h1 infers that Zen meditation significantly improves the quality of semi-lunar valves and arterial elasticity. The t-test results showed that all P-values were <0.05, further corroborating the significance of the improvement in the meditation group. In comparison with normal relaxation, Zen meditation may effectively improve the characteristics of cardiovascular system according to parameters extracted from blood pressure waves.
Discussion
Why does meditation improve the cardiovascular system? It is possible that in meditation, the meditator devotes attention to breathing, thus reducing dispersive thoughts, brain activity, muscle stress and the influence of the sympathetic system on blood vessels. Consequently, the artery wall becomes more relaxed and elastic. In other words, the blood flow encounters less peripheral resistance and can be more easily transported into organ, tissue, cell, etc. With such a high-efficiency blood transporting system, human health improves.
Recently, complementary and alternative medicine has sparked researchers to investigate their scientific evidence. No doubt, meditation plays an important role in these corresponding fields. Here we report the immediate effect of Zen meditation on cardiovascular characteristics, with a control group containing the same number of normal, healthy subjects of a similar age range. We analyzed the immediate variations because of the difficulty of controlling open-system experimental conditions for human subjects.
In modern society, cardiovascular related diseases have become a dominant cause of death for a long time. Meditation provides an alternative mode of healthcare for conditions that are challenging conventional treatment. At the same time, scientists are urged to develop a scientific approach to the underlying mechanism and how it affects the human life system. More scientific and clinical evidence may inject innovative ideas into mainstream medicine and popular healthcare practices. According to preliminary results analyzing BPWs, Zen meditation is more effective in improving cardiovascular characteristics than normal relaxation.
Acknowledgement
The invaluable assistance of the Taiwan Zen-Buddhist Association is greatly appreciated. This work has been supported in part by the National Science Council of Taiwan (grant NSC 94-2213-E009-136).
References
- 1.Milnor WR. Hemodynamics. Baltimore: Williams & Wilkins; 1989. [Google Scholar]
- 2.Han Y, Huan YW, Sun J. Spectral analysis of arterial pulse wave in patients with hypertension. Chinese Heart Journal. 2000;12:178–192. (in Chinese) [Google Scholar]
- 3.O'Rourke1 MF, Pauca A, Jiang XJ. Pulse wave analysis. Br J Clin Pharmacol. 2001;51:507–22. doi: 10.1046/j.0306-5251.2001.01400.x. [DOI] [PMC free article] [PubMed] [Google Scholar]
- 4.Wilkinson IB, Cockcroft JR, Webb DJ. Pulse wave analysis and arterial stiffness. J Cardiovasc Pharmacol. 1998;32([Suppl 3]):S33–7. [PubMed] [Google Scholar]
- 5.Cohn JN, Finkelstein S, Mcveigh G, Morgan D, Lemay L, Robinson J, et al. Noninvasive pulse wave analysis for the early detection of vascular disease. Hypertension. 1995;26:503–8. doi: 10.1161/01.hyp.26.3.503. [DOI] [PubMed] [Google Scholar]
- 6.Mcveigh GE, Bratteli CW, Morgan DJ, Alinder CM, Glasser SP, Finkelstein SM, et al. Age-related abnormality in arterial compliance identified by pressure contour analysis. Hypertension. 1999;33:1392–8. doi: 10.1161/01.hyp.33.6.1392. [DOI] [PubMed] [Google Scholar]
- 7.Tan S, Tillisch K, Mayer E. Functional somatic syndromes: emerging biomedical models and Traditional Chinese Medicine. Evid Based Compliment Alternat Med. 2004;1:35–40. doi: 10.1093/ecam/neh016. [DOI] [PMC free article] [PubMed] [Google Scholar]
- 8.Dillbeck MC, Orme-Johnson DW. Physiological differences between Transcendental Meditation and rest. American Psychologist. 1987;42:879–81. [Google Scholar]
- 9.Alexander CN, Schneider RH, Sheppard W, Clayborne BM, Rainforth M, Salerno J, et al. Trial of stress reduction for hypertension in older African Americans. Hypertension. 1996;28:228–37. doi: 10.1161/01.hyp.28.2.228. [DOI] [PubMed] [Google Scholar]
- 10.Barnes VA, Davis HC, Murzynowski JB, Treiber FA. Impact of meditation on resting and ambulatory blood pressure and heart rate in youth. Psychosom Med. 2004;66:909–14. doi: 10.1097/01.psy.0000145902.91749.35. [DOI] [PubMed] [Google Scholar]
- 11.Castillo-Richmond A, Schneider RH, Alexander CN, Cook R, Myers H, Nidich S, et al. Effects of stress reduction on carotid atherosclerosis in hypertensive African Americans. Stroke. 2000;31:568–73. doi: 10.1161/01.str.31.3.568. [DOI] [PMC free article] [PubMed] [Google Scholar]
- 12.Schneider RH, Staggers F, Alexander CN, Sheppard W, Rainforth M, Kondwani K, et al. A randomized controlled trial of stress reduction for hypertension in older African Americans. Hypertension. 1995;26:820–7. doi: 10.1161/01.hyp.26.5.820. [DOI] [PubMed] [Google Scholar]
- 13.Hankey A. Studies of Advanced Stages of Meditation in the Tibetan Buddhist and Vedic Traditions. I: A Comparison of General Changes. Evid Based Compliment Alternat Med. 2006;3:513–21. doi: 10.1093/ecam/nel040. [DOI] [PMC free article] [PubMed] [Google Scholar]
- 14.Barnes VA, Treiber FA, Turner JR, Davis H, Strong WB. Acute effects of Transcendental Meditation on hemodynamic functioning in middle-aged adults. Psychosom Med. 1999;61:525–31. doi: 10.1097/00006842-199907000-00017. [DOI] [PMC free article] [PubMed] [Google Scholar]
- 15.Fey JF. Contemporary Sphygmology in Traditional Chinese Medicine. Beijing: People's Medical Publishing House; 2003. (in Chinese) [Google Scholar]
- 16.Nichols WW, O'Rourke MF. McDonald's Blood Flow in Arteries. Philadelphia, PA: Lea & Febiger; 1990. [Google Scholar]
- 17.Khir AW, Parker KH. Measurements of wave speed and reflected waves in elastic tubes and bifurcations. J Biomech. 2002;35:775–83. doi: 10.1016/s0021-9290(02)00025-8. [DOI] [PubMed] [Google Scholar]
- 18.Xie MZ, Li SZ, Li BX. Observation on ordinary person's parameter of pulse condition and pulse map. Hunan Guiding Journal of TCMP. 2000;6:9–11. (in Chinese) [Google Scholar]