Abstract
Two independent multidisciplinary studies of climatic change during the glacial–Holocene transition (ca. 14,000–9,000 calendar yr B.P.) from Norway and Switzerland have assessed organism responses to the rapid climatic changes and made quantitative temperature reconstructions with modern calibration data sets (transfer functions). Chronology at Kråkenes, western Norway, was derived from calibration of a high-resolution series of 14C dates. Chronologies at Gerzensee and Leysin, Switzerland, were derived by comparison of δ18O in lake carbonates with the δ18O record from the Greenland Ice Core Project. Both studies demonstrate the sensitivity of terrestrial and aquatic organisms to rapid temperature changes and their value for quantitative reconstruction of the magnitudes and rates of the climatic changes. The rates in these two terrestrial records are comparable to those in Greenland ice cores, but the actual temperatures inferred apply to the terrestrial environments of the two regions.
Terrestrial plants and animals respond directly to climatic change when large changes cross their tolerance thresholds. However, organisms are not isolated like physical measurements but interact in an ecosystem where feedbacks apply according to the organisms' individual biology and their environmental and physiological tolerances. Ecosystem stability or change is ultimately controlled by climate, and thus organisms will still show a climatic signal, even though they are part of an integrated ecosystem. Their responses can be quantified by relating modern assemblages to climate (or any measured environmental variable) as a calibration (transfer) function. This function can then be used to reconstruct quantitatively past environmental parameters from fossil assemblages, illustrated herein by summer temperature. At present in Europe, there are calibration functions for pollen, chironomids, Cladocera, diatoms, and Coleoptera. Quantitative paleoclimatic reconstructions can also be made by using indicator species and analogue (assemblage) approaches (e.g., plant macrofossils and Trichoptera). For assessment of the rates of climatic change, multiproxy studies from high-resolution sequences with calendar chronologies are needed. Two such studies have been recently completed at Kråkenes, Norway (Kråkenes Project; ref. 1) and in Switzerland (Gerzensee–Leysin Project; ref. 2). This paper presents briefly the approaches and climatic conclusions from these two similar but independent projects to demonstrate how, by using the sensitivity of organisms to climate at terrestrial sites, multiproxy biotic responses can be used to reconstruct late-glacial temperature values and the amounts and rates of temperature change. We hope to extend awareness of the potential of terrestrial sites and organisms for paleoclimatic reconstruction and thus illustrate the value of modern paleoclimatic approaches with fossil organisms.
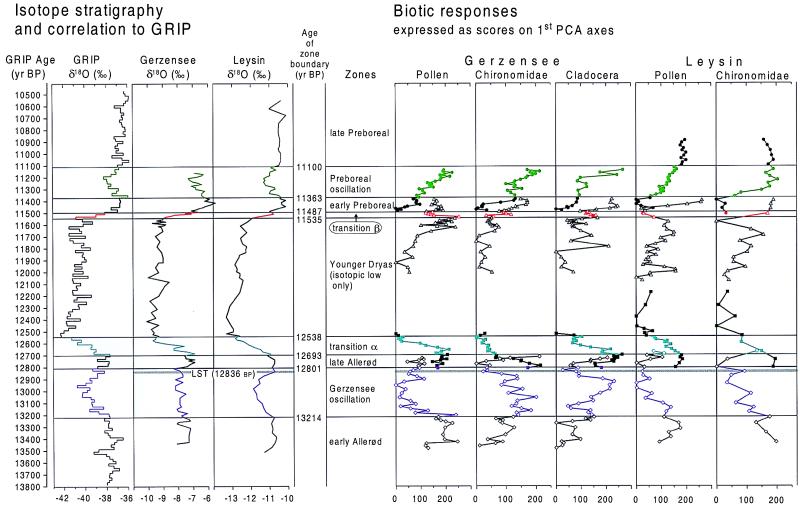
The Norwegian Kråkenes Project mostly used a single core from the sediments of Kråkenes Lake, western Norway, covering the late-glacial and early-Holocene periods (3, 4). A high-resolution 14C date series on terrestrial plant macrofossils and early-Holocene lake sediment (12,300–8,000 14C yr B.P.) has been calibrated to produce a calendar-yr chronology (14,000–9,000 calendar yr B.P.; refs. 5 and 6). In contrast, the Swiss Gerzensee–Leysin Project used high-resolution δ18O stratigraphy from two late-glacial sediment sequences to derive a chronology by assuming that global or hemispheric temperature changes were recorded without lag in the oxygen-isotope ratios of both the precipitated carbonates in lake marl and Greenland ice (GRIP; ref. 7; see also Fig. 3). Both projects are multidisciplinary and use pollen, plant macrofossils, chironomids, Cladocera, and Coleoptera, with the addition at Kråkenes of oribatid mites, diatoms, and Trichoptera. The studies have common aims in the reconstruction of the magnitudes and rates of temperature changes and biotic responses round the Younger Dryas but are independent projects whose approaches and contexts are described more fully elsewhere (2–4). The present paper summarizes the main climatic conclusions of both projects.
Figure 3.
Gerzensee (603 m above sea level) and Leysin (1,230 m above sea level), Switzerland. (A) The δ18O records of the lake marls and their correlation to the GRIP ice core chronology. (B) The sample scores on principal components analysis axis 1 of the biostratigraphies of pollen, Cladocera, and Chironomidae summarize the amount of compositional change between adjacent samples (2). Principal components analyses were run on four time windows separately (four symbols), such that the series scores depend on the core sections used and therefore do not exactly match at the overlaps. LST, Laachersee tephra.
At Kråkenes, the late-glacial lacustrine sequence was strongly influenced by the development of a Younger Dryas cirque glacier above the lake. Temperature rather than precipitation was the overriding driving force behind the glacier changes. The initial rapid warming at the start of the Holocene is tracked by organisms' responses, but as temperature continued to increase, feedbacks also influenced ecosystem development (6). In Switzerland, glaciers retreated earlier (16,000–15,000 calendar yr B.P.) and did not influence the lakes during the late-glacial period. The late-glacial temperature changes were as large as they were in western Norway but at a level about 4°C warmer. Organisms tracked the changes, each responding at its own speed according to the prevailing climatic conditions. Besides the rapid responses, leads and lags corresponding to the different sensitivities of the various groups can also be detected (2).
Kråkenes Project (Norway).
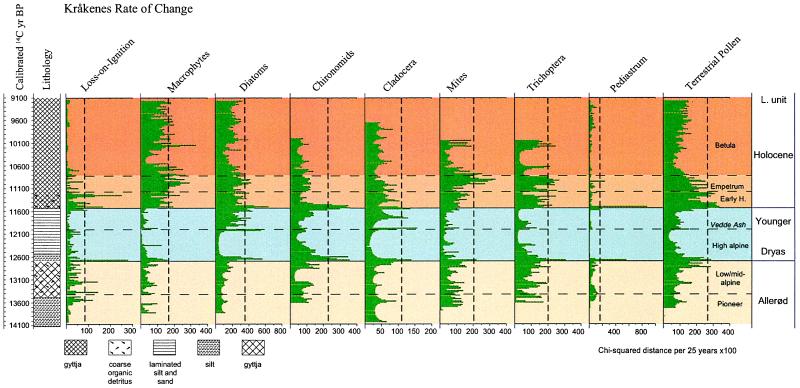
We illustrate herein how organisms responded to the climatic changes around the Younger Dryas by comparing the rates of change (biotic responses) in each group. By using the calibrated 14C age of every sample, the data from the fossil groups were interpolated to 25-yr intervals. Rates of change (amount of compositional change per unit of time) were estimated and plotted against calibrated age (ref. 6; Fig. 1). Spectacularly high rates of change across the Younger Dryas boundaries correspond to the formation and melting of the cirque glacier. Lesser peaks for different taxa tend to coincide during the late-glacial period. After the initial rapid response at the start of the Holocene, changes occurred as biotic temperature thresholds were passed and as immigration and ecosystem processes became influential. High rates of change usually coincided with major terrestrial habitat and soil changes, namely the development of Empetrum (crowberry)-dominated heath followed by open birch woodland, or with changes in the aquatic ecosystem related to catchment processes and vegetation, reduction in the duration of ice cover, increasing organic-sediment deposition, hydroseral succession, depletion of base cations, and natural lake acidification (6).
Figure 1.
Rates of change at Kråkenes Lake, Norway, over 25-calendar-yr intervals for the fossil groups and percentage loss-on-ignition at 550°C. The approximate 95% significance levels for the rates of change estimates based on permutation tests are shown by the vertical broken lines. Rates of change greater than these are unlikely to have arisen by chance (see ref. 6). Vegetation changes are indicated at the right side of the diagram. Redrawn from ref. 6. L. unit, lithological unit.
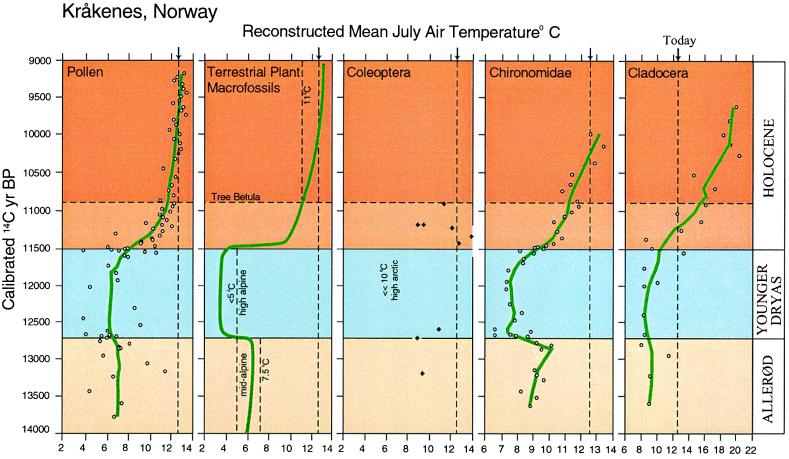
Quantitative temperature reconstructions made by using different groups and methods are illustrated and compared in Fig. 2. Mean July temperatures inferred numerically (8) from the fossil groups are plotted against the calibrated chronology. This first attempt at such a comparison shows remarkable synchroneity and consistency among the groups. The Allerød was too cool for tree growth (6–9°C) but not cold enough for local glacier formation. The decrease to the Younger Dryas was about 2°C. The strongest registration of the Younger Dryas cooling is shown by chironomids and plant macrofossils, but all organisms responded rapidly (Fig. 1). The rate of temperature decrease calculated from the chironomid and pollen reconstructions is 0.7°C per 25 yr for both. Warming started in the late Younger Dryas, culminating in the melting of the glacier, taken as the lithostratigraphic onset of the Holocene at Kråkenes (Fig. 1). All groups show a steep temperature rise during the first 500 yr of the Holocene of ≈6°C (3.5°C chironomids), with calculated rates of 0.3°C per 25 yr (Cladocera), 0.2°C per 25 yr (chironomids), and 0.25°C per 25 yr (pollen). The rates then slowed down gradually until the modern temperature was reached and exceeded between 10,000 and 9,500 calendar yr B.P. (6). The higher temperatures reconstructed from Cladocera probably result from the use of a Swiss calibration set (6), and Coleoptera remains were too few to reconstruct temperatures from each sample (9).
Figure 2.
Comparison of mean July air temperature reconstructions at Kråkenes Lake, Norway, plotted against calibrated 14C yr. The Allerød interstadial ends at ca. 12,700 calibrated 14C yr B.P. (6), and the Younger Dryas ends at 11,530 ± 50 calibrated 14C yr B.P. (5). The first macrofossils of tree birch appear at 10,900 calibrated 14C yr B.P. Temperatures from pollen, Chironomidae, and Cladocera were reconstructed by modern calibration training sets. The lines are loess scatter plot smoothers [spans 0.35 (pollen) and 0.25 (Chironomidae and Cladocera)]. Coleoptera temperatures were reconstructed by the Mutual Climate Range method. Only a few points are available; thus, they are not joined. Macrofossil temperatures were inferred by modern vegetation analogues. The temperatures indicated are at the boundaries of the mid- and high-alpine vegetation zones and the lower limit of Betula pubescens in western Norway today. The present mean July temperature at Kråkenes (12.6°C) is indicated by a dotted line across the sections. Data are from various investigators working on the Kråkenes Project (see refs. 1 and 9).
Gerzensee–Leysin Project (Switzerland).
Again, two groups of questions were asked. (i) How fast and by what mechanisms did different groups of organisms respond to the rapid climatic changes around the Younger Dryas? (ii) How do quantitative temperature reconstructions that use different organisms compare?
To assess biotic responses (question i), multiproxy analyses were made along a 900-m altitudinal transect of four lakes, two of which have a record of oxygen isotopes measured in lake marl and are presented here: Gerzensee at 603 m and Leysin at 1,230 m above sea level. Sampling resolution for isotope stratigraphies and biostratigraphies at the two sites was ca. 8 yr and 30 yr, respectively, around the end of the Younger Dryas and coarser for other periods (15–60 yr). Three lines of evidence indicate that the oxygen-isotope record (Fig. 3) registers climatic change immediately and with minimal distortion by erosional input or hydrological changes: the similarity of the bulk-sediment trends in amplitude and timing to those in ostracod and Pisidium shells (10), and the smooth curves of both the δ13C and the carbonate concentrations through the Late Allerød, Younger Dryas, and Preboreal (7). Biostratigraphies are complex, with quantitative changes shown by up to 150 taxa per sample; thus they are each summarized by sample scores on the first principal component axis (ref. 2; Fig. 3). Each time period was treated separately, such that small changes were not obscured by the major changes at the Younger Dryas boundaries. The courses of the principal components analysis curves reflect compositional changes resulting from environmental changes.
The main conclusions are as follows. (i) Speed of biotic response: lags to the δ18O record are absent or surprisingly short (within 0–2 samples, i.e., <10–60 yr) for locally present organisms. (ii) Effects of different life histories: generation time is unimportant if biotic responses other than immigration and expansion of populations are important. (iii) Altitudinal differences: the large-amplitude changes of the Younger Dryas are recorded at all altitudes, but minor oscillations are detectable only at sensitive altitudes (usually at higher altitudes, i.e., near the species range limits, particularly the timber–line).
The nature of the biotic responses and inferred processes are as follows. (i) There are short altitudinal migrational lags, e.g., from the valley bottom up 800 m to the site at Leysin. Latitudinal migration from glacial refugia is negligible in these data. (ii) Expansion of populations was important for short-lived taxa such as chironomids and other insects. Small populations probably survived through the Younger Dryas and expanded rapidly (possibly in one or two seasons) when critical thresholds of summer temperatures were crossed. (iii) Productivity of individuals may play a role in the responses of long-lived organisms, e.g., increases in the annual production of pollen and fruits of trees.
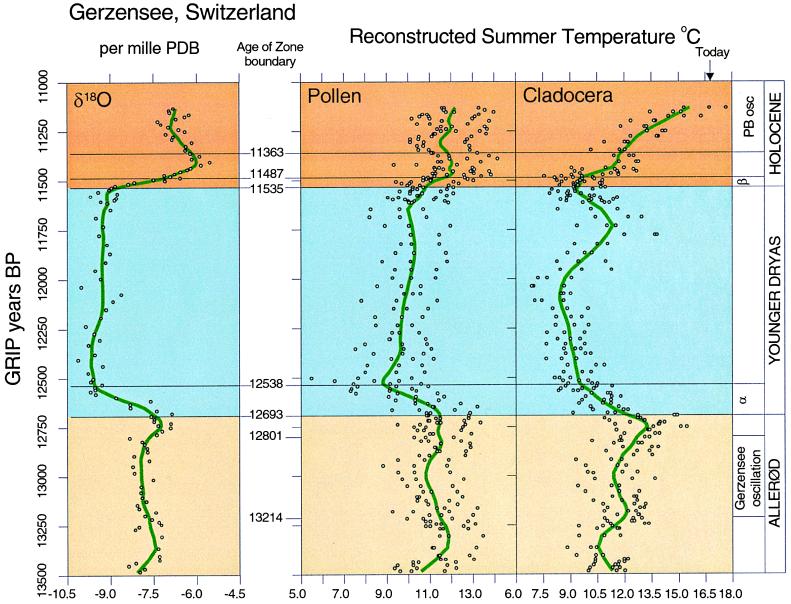
To reconstruct summer temperatures at Gerzensee (question ii), Lotter et al. (11) applied calibration functions (12) to the pollen and Cladocera stratigraphies. The reconstructions gave generally consistent results (Fig. 4). The mean summer (June, July, and August) temperatures dropped 2–3°C over ca. 135 yr (pollen) or 2–4°C over ca. 225 yr (Cladocera) at the beginning of Younger Dryas, giving rates of temperature change of ≈0.6°C per 25 yr, slightly less than the rates at Kråkenes. At the start of the Holocene, summer temperatures warmed by 2–3°C over ca. 160 yr (pollen) or 5–6°C over ca. 400 yr (Cladocera), giving rates of temperature change of ≈0.3°C per 25 yr, comparable to the rates at Kråkenes.
Figure 4.
Gerzensee, Switzerland. Consensus reconstruction of mean summer temperatures (June, July, and August) derived from the application of linear- and unimodal-based inference models (ref. 12) to Cladocera and pollen data. The fitted curves are loess smoothers (span 0.1; ref. 11). Today's summer temperature at Gerzensee is 16.6°C. Redrawn from ref. 11. Zones and time scale are the same as those shown in Fig. 3. PDB, pee dee belemnite; PB osc, preboreal oscillation.
Conclusions.
Both terrestrial and aquatic organisms reacted rapidly to the large late-glacial climatic changes (at least as fast as the changes registered in ice cores), showing that they are sensitive climatic indicators. Biotic responses to climatic change involve all organizational levels from the physiology and ecology of an organism to populations (including their biogeography) and ecosystems. Species respond individualistically; however, in periods when climatic changes are strong and fast, the responses are telescoped together, and the whole ecosystem changes rapidly. During more gradual climatic changes (Holocene warming), the individualistic responses were expressed, leading to variable rates of change related to major ecosystem changes linked to environmental and catchment developments and climatic thresholds.
Quantitative paleoclimatic estimates and changes were numerically reconstructed from a range of organisms. Calibration data sets and reconstruction methods are improving all the time (8), and future reconstructions may reveal other short climatic oscillations, e.g., in the early Holocene. The two projects have been successful in comparing quantitative late-glacial temperature reconstructions from a range of organisms and have shown how the magnitudes and rates of temperature changes and biotic responses can be calculated. Regional late-glacial differences have been demonstrated. The Allerød in Switzerland was 4–4.5°C warmer than western Norway, and trees were present. The Younger Dryas was between 1 and 4°C colder in western Norway than in Switzerland, allowing cirque glaciers to develop. In contrast, the values and ranges of the Holocene temperature rise are very similar in both areas (≈8–10 to ≈12–13°C during the first 500 yr). More climate reconstructions in the future will yield geographical patterns of climate values that can be used as boundary conditions to constrain climate models during the glacial–Holocene transition.
Hypotheses about the causes of late-glacial climatic change need global and regional climate syntheses from all available sources (ice sheet, ice core, marine, and terrestrial records). Quantitative estimates of past climates are badly needed from terrestrial ecosystems. Such estimates are a major aim of the new Norwegian national project NORPAST (Past Climates of the Norwegian Region). Paleoclimatic data are also needed for hindcast validation of climate models predicting future climate changes. In this perspective, it is the ultimate effects of future change on terrestrial ecosystems that are of most relevance to society.
Acknowledgments
This paper is Kråkenes Project contribution 26.
Abbreviation
- GRIP
Greenland Ice Core Project
Footnotes
This paper was submitted directly (Track II) to the PNAS office.
References
- 1.Kråkenes Project (2000) J. Paleolim., in press.
- 2.Gerzensee–Leysin Project (2000) Palaeogeogr. Palaeoclim. Palaeoecol., in press.
- 3.Birks H H, Battarbee R W, Beerling D J, Birks H J B, Brooks S J, Duigen C A, Gulliksen S, Haflidason H, Hauge F, Jones V J, et al. J Paleolim. 1996;15:281–286. [Google Scholar]
- 4.Birks H H, Wright H E. J Paleolim. 2000;23:1–5. [Google Scholar]
- 5.Gulliksen S, Birks H H, Possnert G, Mangerud J. The Holocene. 1998;8:249–259. [Google Scholar]
- 6.Birks H H, Battarbee R W, Birks H J B. J Paleolim. 2000;23:91–114. [Google Scholar]
- 7.Schwander, J., Eicher, U. & Ammann, B. (2000) Palaeogeogr. Palaeoclim. Palaeoecol., in press.
- 8.Birks H J B. J Paleolim. 1998;20:307–332. [Google Scholar]
- 9.Battarbee R W. Quat Sci Rev. 2000;19:107–124. [Google Scholar]
- 10.von Grafenstein, U., Eicher, U., Erlenkeuser, H., Ruch, P., Schwander, J. & Ammann, B. (2000) Palaeogeogr. Palaeoclim. Palaeoecol., in press.
- 11.Lotter, A. F., Birks, H. J. B., Eicher, U., Hofmann, W., Schwander, J. & Wick, L. (2000) Palaeogeogr. Palaeoclim. Palaeoecol., in press.
- 12.Lotter A F, Birks H J B, Hofmann W, Marchetto A. J Paleolim. 1997;18:395–420. [Google Scholar]


