

Abstract
Preterm birth results in significant cognitive and motor disabilities, but recent evidence suggests that there is variable recovery over time. One possibility that may explain this variable recovery entails variable neurogenic responses in the subventricular zone (SVZ) following the period of chronic hypoxia experienced by these neonates. In this report, we have characterized the responses to chronic hypoxia of two mouse strains that represent a wide range of susceptibility to chronic hypoxia. We determined that C57BL/6 pups and neural progenitor cells (NPCs) derived from them exhibit a blunted response to hypoxic insult compared with CD-1 pups and NPCs. Specifically, C57BL/6 pups and NPCs exhibited blunted in vivo and in vitro proliferative and increased apoptotic responses to hypoxic insult. Additionally, C57BL/6 NPCs exhibited lower baseline levels and hypoxia-induced levels of selected transcription factors, growth factors, and receptors (including HIF-1α, PHD2, BDNF, VEGF, SDF-1, TrkB, Nrp-1, CXCR4, and NO) that determine, in part, the responsiveness to chronic hypoxic insult compared with CD-1 pups and NPCs, providing insight into this important and timely problem in perinatology.
Keywords: brain ischemia and reperfusion, brain-derived neurotrophic factor, cell death, embryonic stem cells, neuronal survival
Although preterm birth results in significant cognitive and motor disabilities, recent evidence suggests that there can be some recovery over time (Hack et al., 2002; Tyson and Saigal, 2005; Wilson-Costello et al., 2005; Saigal et al., 2006). Analysis of recent data indicates that over 1% of the offspring of all live births in the United States weigh under 1,000 g at birth, and the survival rate for these often critically ill individuals ranges from approximately 60% to 85% (Bassan et al., 2006). Although survival rates of these infants have improved, there has been an increase in neonatal illness, mortality, and/or severe intraventricular hemorrhage (IVH) over time, representing a shift of severely compromised patients that now survive the fetal time period and are presented for care in the neonatal unit (Cooke, 2006; Paul et al., 2006). Over two-thirds of very-low-birth-weight preterm infants suffer from both apnea and respiratory distress syndromes that result in cerebral hypoxemia. Among this cohort, almost one-fourth are functioning in the mentally retarded or borderline ranges at school; approximately 10% have cerebral palsy; and, at 8 years of age, approximately one-half of these neonates require special assistance in school, resulting in estimated annual life time care costs in excess of 4 billion dollars. The deleterious effects of low O2 in the perinatal period are thought to be the consequences of altered neuronal differentiation and synaptogenesis and loss of neurons, glia, and their progenitor cells resulting from excessive apoptosis (Curristin et al., 2002). Recently, several studies have reported significant improvement in academic functioning over time in this population, which correlated with increases in brain volumes (Wilson-Costello et al., 2005). Although encouraging, the cognitive improvement is variable, and the repair/recovery mechanisms involved are undefined.
One possibility that may explain this variable recovery would entail variable neurogenic responses in the subventricular zone (SVZ; a known area of neurogenesis; Doetsch, 2003; Shen et al., 2004; Ward et al., 2004; Li et al., 2006) following the period of chronic sublethal hypoxia experienced by these neonates. Indeed, in a murine model mimicking the chronic hypoxia associated with premature birth, Fagel et al. (2005) demonstrated that twice as many bromodeoxyuridine (BrdU)-labeled cells expressed neuronal markers in the neocortex in mice recovering from hypoxia compared with controls. In both hypoxic-reared infant and juvenile mice, putative neuroblasts could be seen detaching from the fore-brain SVZ, migrating through the subcortical white matter and entering the lower cortical layers 5–11 days after their last mitotic division (Fagel et al., 2005). These and other data suggest that cortical neurogenesis may play a significant role in repairing neuronal losses after hypoxic neonatal injury (Felling et al., 2006; Yang and Levison, 2006). These findings are consistent with observations made on adult mice that demonstrated cortical, striatal, and hippocampal neurogenesis following a variety of injuries and responses to several treatment modalities (Warner-Schmidt and Duman, 2006). Thus, the induction of neurogenesis following the insult of chronic sublethal hypoxia in the premature newborn may explain the cognitive improvement observed over time (Fagel et al., 2005). However, the variability of this improvement warrants a more complete understanding of the mechanisms involved in modulating neurogenesis occurring in the SVZ so that more vulnerable subpopulations of premature infants can be identified and treatment modalities can be investigated to elicit a greater and more complete recovery. In this study, we have utilized two mouse strains that represent a wide range of susceptibility to chronic hypoxia to elucidate potential growth factors and receptors that may determine, in part, the responsiveness to chronic hypoxic insult, thus providing insight into this important and timely problem in perinatology.
MATERIALS AND METHODS
Mice
CD-1 and C57BL/6 male and female breeders were obtained from Charles River Laboratories (CRL, Wilmington, MA) or laboratory stock derived from CRL breeders. All neural progenitor cells (NPCs) were derived from postnatal day 1 (P1) pups acquired from synchronized time-dated pregnancies of CD-1 or C57BL/6 matings.
Hypoxia Protocol
At P3, a cohort of mothers and pups was subjected to hypoxic (9.5% O2) treatment; control mice remained under normoxic conditions as described by Fagel et al. (2005). An additional CD-1 foster mother was placed with the C57BL/6 hypoxic litters to improve the survival of the C57BL/6 pups. All hypoxic mice were returned to normoxic conditions after 8 days, at P11. Pups were sacrificed at P11. This particular protocol was instituted following our finding that, in contrast to CD-1 pups, C57BL/6 pups exhibited a very high morality rate at day P13 under hypoxic conditions. Thus, a time point (P11) at which both strains of pups would be viable was chosen.
NPC Collection and Culture
NPCs were isolated from the brains of P1 C57BL/6 and CD-1 pups as described elsewhere (Mizumoto et al., 2003; Li et al., 2006) and cultured in NPC medium [DMEM/F12 supplemented with N-2 (Gibco, Carlsbad, CA), 20 ng/ml of epidermal growth factor (EGF), 10 ng/ml basic fibroblast growth factor (bFGF), 1% L-glutamine, 1% penicillin/streptomycin (P/S), and Fungizone] and incubated in 5% CO2 at 37°C (Mizumoto et al., 2003; Li et al., 2006). Primary cultures were incubated for 15–20 days, at which time neurospheres form. The neurospheres were then dissociated using 0.1% trypsin, and the NPCs were plated at 1.00 × 10⁴ or 1.00 × 10⁵ cells/ml and plated into either 24- or six-well cluster plates and cultured under either normoxic or hypoxic (10% O2) conditions for 6 days. To test the effects of SDF-1α, vascular endothelial growth factor (VEGF), and brain-derived neurotrophic factor (BDNF) on NPCs, NPCs isolated from P1 C57BL/6 and CD-1 mice were treated with recombinant SDF-1 (2–50 ng/ml; PeproTech Inc, Rocky Hill, NJ), recombinant murine VEGF, and recombinant murine BDNF (2–50 ng/ml; R&D Systems, Minneapolis, MN) for 6 days. Additionally, to assess the effects of VEGF and BDNF on NPC proliferation, we utilized 10 ng/ml of recombinant soluble Flt-1 [Flt-(1–3)-IgG, a truncated Flt-1–3 Fc fusion protein; generous gift of Dr. Napoleon Ferrara (Genentech, San Francisco, CA; Chow et al., 2001; Ogunshola et al., 2002; Kim et al., 2004)] and 10 ng/ml of recombinant soluble TrKB (R&D Systems; Kim et al., 2004; Li et al., 2006) to sequester VEGF and BDNF, respectively.
To test the effects of nitric oxide (NO) on NPC behaviors, we utilized the NO scavenger carboxy-2-phenyl-4,4,5,5-tetramethylimidazoline-1-oxyl 3-oxide at 100 μM (C-PTIO; Cayman Chemical Co., Ann Arbor, MI) and the slow-release NO donor NOC-18 at 50 μM (Calbiochem, San Diego, CA) in 3-day cultures.
Bromodeoxyuridine Labeling and Detection
Brain tissues
CD-1 and C57BL/6 pups were delivered from synchronized time-dated matings. Thirty minutes prior to sacrifice, mice were injected with BrdU (Sigma, St. Louis, MO; 120 mg/kg, i.p., dissolved in 0.007% NaOH in phosphate buffer). Five minutes prior to sacrifice, mice were injected with ketamine (100 mg/kg) and xylazine (10 mg/kg). Brains were postfixed in 10% buffered formalin overnight at 4°C, then cryoprotected for at least 24 hr in 30% sucrose in PBS and embedded in Tissue Tek O.C.T. compound (Sakura Finetek, Torrance, CA). Afterward, they were cut into 10-μm sections using a cryostat. Tissues were treated with 0.1% Triton X-100, 2 N HCl for 30 min at 37°C to denature cellular DNA. Prior to immunohistochemistry, sections were washed with PBS, and permeabilized with 0.5% Triton X-100 on ice for 10 min. Sections were then incubated in primary antibody overnight at 4°C (rat monoclonal anti-BrdU, 1:100; Novus Biological, Littleton, CO; mouse monoclonal antinestin, 1:200; BD Biosciences Pharmingen, San Diego, CA) diluted in 0.3% Triton X-100/4% normal goat serum in PBS. Tissues were then washed and incubated in secondary antibody (goat anti-rat 594 and goat anti-mouse 488, 1:200; Molecular Probes, Eugene, OR) in 1× PBS for 1 hour at room temperature. Coverslips were mounted with Vectashield (with DAPI) and viewed and photographed with a Olympus IX71 fluorescence microscope using an Optronics Microfire C camera, Pictureframe software, and an Apple G4 computer. At least nine micrographs were taken from three sections, and the numbers of BrdU-positive, nestin-positive, and double-positive cells were counted by using NIH Image J, and the data sets were then transferred to Excel and Statview programs and percentages and standard deviations were determined and statistical analyses performed.
NPCs
C57BL/6 and CD-1 NPCs were cultured under normoxic and hypoxic conditions for 5 days followed by the addition of 10 μM of the thymidine analog 5′bromo-2′-deoxyuridine (BrdU; Sigma) into each culture dish for 24 hr. After incubation, the NPCs were affixed to glass coverslips by cytospin for 20 min at 100 rpm. Cells were fixed for 10 min in 4% paraformaldehyde in PBS, pH 7.2. Incorporation of BrdU in the nuclei was detected by denaturing cellular DNA using 0.1% Triton X-100, 2 N HCl for 30 min at 37°C, followed by incubation in primary antibody for 1 hr at room temperature (FITC-conjugated mouse anti-BrdU monoclonal antibody, 1:500; BD Pharmingen). Cells were imaged as described above, and BrdU-positive, nestin-positive, and double-positive cells were counted in NIH Image J (Fagel et al., 2005) and the data analyzed as described above.
NPC Proliferation Assay
NPC proliferation was analyzed using the CyQuant Cell Proliferation Assay Kit. This assay uses a proprietary green fluorescent dye, CyQuant GR dye (Molecular Probes), which exhibits strong fluorescence enhancement when bound to cellular nucleic acids. Absorbance was read on the Wallec model 1420 multilabel counter. Data from three independent experiments were analyzed by using Excel 2000 and Statview. NPC proliferation was also evaluated by Western blot quantitation of proliferating cell nuclear antigen (PCNA), which is a cofactor of DNA polymerase in the nucleus. PCNA helps increase the processivity of leading strand synthesis during DNA replication. Statistical significance was assumed at P < 0.05.
Neurosphere Assay
Cells were cultured in the NPC colony-forming assay called the neurosphere assay. Briefly, cells from P1 brain of C57BL/6 and CD1 mice were plated at density 1 × 10⁴ cells/ml in 24-well plates. After culture under normoxic or hypoxic (10% O2, 5% CO2, 85% N2) conditions in NPC medium for 6 days, the primary neurospheres were observed and counted. To ascertain the capacity of the NPCs to self-renew and expand in vitro, the free-floating primary neurospheres were dissociated into a single cell suspension with 0.25% trypsin in EDTA 1× PBS buffer, then replated in NPC medium under normoxic or hypoxic conditions for 6 days, at which time secondary neurosphere formation was observed and counted.
Immunohistochemistry
Animals were sacrificed by anesthetic overdose (in accordance with approved Yale University policy) and transcardially perfused with 4% paraformaldehyde in PBS, pH 7.2. Brains were postfixed, cryoprotected, and cryosectioned as described above. Prior to immunohistochemistry, 10-μm cryosections were washed with PBS, permeabilized with 0.5% Triton X-100 on ice for 10 min, and incubated with 4% normal goat serum overnight at 4°C. After this, the sections were incubated overnight at 4°C in primary antibody [mouse monoclonal antinestin and rabbit anticleaved caspase 3, 1:100; Cell Signaling Technology, Beverly, MA; diluted in 0.3% Triton X-100-PBS containing 4% normal goat serum or an affinity-purified rabbit polyclonal anti-murine PECAM-1 produced as described (Pinter et al., 1999), used to detect blood vessels]. Sections were washed three times in PBS and incubated with secondary antibodies (goat anti-mouse Alexa Fluor 488, 1:200, or rhodamine conjugated goat anti-rabbit, 1:200; Molecular Probes) for 1 hr at room temperature. Coverslips were mounted with Vectashield (with DAPI) and imaged as described above. The numbers of cleaved caspase-3-positive, nestin-positive, and double-positive cells were counted in NIH Image J and the data sets were then transferred to Excel and Statview programs where percentages and standard deviations were determined and statistical analyses performed. Quantitations of vascular densities were determined by measuring tube lengths (PECAM-1-positive vessel segments in pixels) using Image J. After this, the data sets were then transferred to Excel and Statview programs, and relative vascular densities and standard deviations were determined and statistical analyses performed.
Immunoprecipitation and Western Blot Analysis
Cell lysates were generated from both mouse brain (without cerebellum) and NPC and subsequent immunoprecipitation with anti-TrkB (C-13; Santa Cruz Biotechnology, Santa Cruz, CA); then, immunoblotting with anti-PY (PY99; Santa Cruz Biotechnology) to assess phospho-TrkB was performed as described previously (Kim et al., 2004; Li et al., 2006). For Western blotting, whole-brain tissue and NPC cells were homogenized in lysis buffer comprising 50 mM Tris-HCl, pH 7.4, 150 mM NaCl, 1% NP-40, 10% glycerol, 1 mM sodium orthovanadate, 1 mM PMSF, and protease inhibitor cocktail (Boehringer Mannheim GmbH). Equal amounts of total protein (20 μg or 50 μg) were run on 10% or 12% SDS-polyacrylamide gels, transferred to polyvinylidene difluoride membranes, and immunoblotted with antibodies according to the manufacturer’s instructions. Antibodies used included anti-BDNF (N-20), anti-TrkB (C-13), anti-eNOS (C-2), anti-PY (PY99), and anti-β-actin (1:1,000; Santa Cruz Biotechnology); mouse anti-PCNA (1:1,000; Upstate Biotechnology, Lake Placid, NY); rabbit anticleaved caspase 3 (1:1,000; Cell Signaling Technology); rabbit antineuropilin 1 (1:500; Oncogene, La Jolla, CA); anti-SDF1α (1:500; eBioscience, www.ebioscience.com); rat anti-CXCR4 (1:1,000; BD Biosciences Pharmingen); and rabbit anti-HIF-1α (1:200) and anti-PHD2 (HIF prolyl hydroxylase 2; 1:1,000; Novus Biological). Bound antibodies were detected by using horseradish peroxidase conjugated anti-IgG (Cell Signaling Technology) and a chemiluminescence detection system as described elsewhere (Li et al., 2006). Quantitation was performed on scanned densitometric images (Agfa Arcus II Scanner with Adobe Photoshop CS; Adobe Systems, Beaverton, OR) using the Quantity One software (Bio-Rad Laboratories, Inc., Hercules, CA). Western blot data are expressed as histograms of averages of relative levels (in arbitrary units) of at least three independent determinations for each protein examined.
ELISA Analysis
To determine the expression of VEGF in whole-brain tissue lysates and NPC cell media and cell layer fractions, ELISA analysis was performed on the whole-brain tissue lysates, NPC cell lysates, and medium using the VEGF ELISA kit (Quantikine; R&D Systems).
NO Detection
NO localization was performed with 4-amino-5-methylamino-2′,7′-difluorofluorescein (DAF-FM) diacetate (Molecular Probes), which is the most sensitive reagent currently available for the detection of low concentrations of NO (detection limit is ~3 nM NO). DAF-FM is cell permeable and nonfluorescent until it combines with NO to form a fluorescent benzotriazole (Nath et al., 2004).
Statistical Analysis
All experiments were repeated at least three times. The statistical significance of differences was evaluated by Statview 5.0 using N-way ANOVA (SAS Institute), and significance was taken as P < 0.05. Statistical significance is denoted by the horizontal lines and associated P values above pairs of individual columns in the figures.
RESULTS
In Vivo Studies
Previous publications documenting a wide range of behavioral, morphological, metabolic, physiological, and biochemical differences between C57BL/6 and several mouse strains including the CD-1 mouse strain (Krisle and Ershler, 1988; Miller and O’Callaghan, 1996; Beckmann, 2000; MacDonald, 2002; Banno et al., 2004; Chan et al., 2004; Zwemer et al., 2006; Chalothorn et al., 2007) and the widespread use of the C57BL/6 strain in the generation of transgenic and knockout mice prompted us to compare the hypoxic responses of the C57BL/6 strain with those of the CD-1 mouse strain. As described in Materials and Methods, although CD-1 P3 pups were found to survive a 30-day exposure to hypoxia (at 9.5% O2), C57BL/6 pups expire at day 13 under similar conditions.
CD-1 and C57BL/6 mice exhibit differential hepatic extramedullary hematopoiesis in response to chronic hypoxia
Since induction of hepatic extramedullary hematopoiesis (EMH) is a known response to hypoxia, we assessed strain responsiveness using this parameter. Whereas CD-1 and C57BL/6 P11 pups exhibit similar modest levels of hepatic extramedullary hematopoiesis (EMH) under normoxic conditions (clusters of deep-blue-staining cells) when placed in a hypoxia chamber for 8 days (P3–P11) at 9.5% O2, the CD-1 pups exhibited a 3.4-fold induction in hepatic EMH in contrast to no appreciable induction in the C57BL/6 pup livers (Fig. 1A–I). This difference in hematological precursor responsiveness to hypoxia prompted us to examine the neural progenitor cell (NPC) responsiveness to hypoxia in these two mouse strains.
Fig. 1.
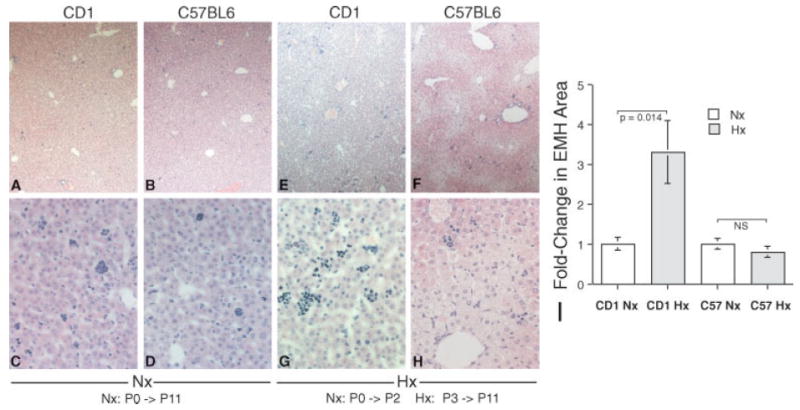
C57BL/6 mice exhibit a blunted induction of extramedullary hematopoiesis in response to hypoxia compared with CD-1 mice. Although CD-1 and C57BL/6 P11 mouse exhibit similar levels of hepatic extramedullary hematopoiesis (EMH), identified as the clusters of deep-blue-staining cells randomly distributed in the hepatic sinusoids (A–D), after a chronic hypoxic insult (9.5% O2) the C57BL/6 pups exhibit essentially no induction of hepatic EMH, whereas the CD-1 pups exhibit a 3.4-fold induction in hepatic EMH (E–I; vertical bars represent standard deviations; n = 6).
CD-1 and C57BL/6 mice exhibit differential SVZ NPC proliferation
P11 pups, reared under either normoxic conditions from P0 to P11 or hypoxic conditions from P3 to P11 were injected with BrdU and perfusion fixed. Immunohistochemical analysis revealed that CD-1 pups exhibited increased SVZ proliferation of nestin-positive cells (determined by dividing the number of nestin-positive and BrdU-positive double-labeled cells by the total number of nestin-positive cells) compared with C57BL/6 P11 pups under normoxic conditions (30.2% vs. 20.6% respectively). Additionally, although somewhat blunted compared with normoxic conditions, CD-1 pups also exhibited substantially increased proliferation compared with C57BL/6 P11 pups under hypoxic conditions (21.2% vs. 8.2% respectively; Fig. 2A–E), consistent with CD-1 pups being less sensitive to hypoxia. Representative low-power micrographs illustrating the areas of the SVZ that were quantitated are shown in Supplemental Figure 1.
Fig. 2.
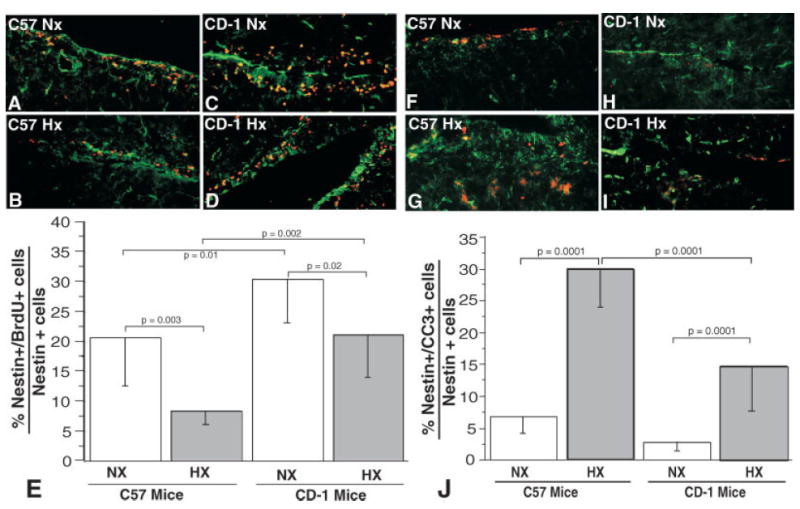
P11 C57BL/6 SVZ NPCs exhibit decreased baseline normoxic and hypoxic proliferative responses compared with CD-1 pups (A–E). Immunohistochemical staining of P11 C57BL/6 and CD-1 brains illustrating differential proliferating NPCs in the SVZ (BrdU staining, red fluorescence; nestin, green fluorescence). A: C57BL/6 in normoxia = C57 NX. B: C57BL/6 in hypoxia = C-57 HX. C: CD-1 in normoxia = CD1 NX. D: CD-1 in hypoxia = CD1 HX. E: Quantitation of the percentages of nestin-positive cells that are also BrdU positive (vertical bars represent standard deviations; n = 6). P11 C57BL/6 SVZ NPCs exhibit increased baseline normoxic and hypoxic apoptosis compared with CD-1 pups (F–J). Immunohistochemical staining of P11 C57BL/6 and CD-1 brains illustrating differential apoptosis of NPCs in the SVZ (cleaved caspase 3 staining, red fluorescence; nestin, green fluorescence). F: C57BL/6 in normoxia = C57 NX. G: C57BL/6 in hypoxia = C-57 HX. H: CD-1 in normoxia = CD1 NX. I: CD-1 in hypoxia = CD1 HX. J: Quantitation of the percentages of nestin-positive cells that are also cleaved caspase 3 (CC3) positive (vertical bars represent standard deviations; n = 6).
CD-1 and C57BL/6 mice exhibit differential SVZ NPC apoptosis
Immunohistochemical analysis of similarly treated pups stained with antinestin and anticleaved caspase 3 to assess apoptosis revealed that CD-1 and C57BL/6 pups exhibited similar low levels of apoptosis (determined by dividing the number of nestin-positive and CC3-positive double-labeled cells by the total number of nestin-positive cells) under normoxic conditions (2.8% vs. 6.7% respectively). However, under hypoxic conditions, the CD-1 pups exhibited reduced apoptosis compared with C57BL/6 P3 pups (14.7% vs. 30.0% respectively; Fig. 2A–J).
CD-1 and C57BL/6 mice exhibit differential SVZ microvascular densities
Staining with anti-PECAM-1 to assess vascular density revealed that CD-1 pups exhibited higher microvascular densities (40.6% increase) in their SVZ areas compared with C57BL/6 P3 pups. Under hypoxic conditions from P3 to P11, anti-PECAM-1 staining revealed that CD-1 pups also exhibited higher microvascular densities (35.5% increase) in their SVZ areas compared with C57BL/6 P3 pups. However, both C57BL/6 and CD-1 pups exhibited decreased vascular densities (49.4% and 50.6% respectively) when exposed to hypoxic conditions from P3 to P11 compared with normoxic conditions (Fig. 3A–E).
Fig. 3.

CD-1 mice exhibit increased SVZ microvascular densities. Immunohistochemical staining of representative normoxic and hypoxic P11 C57BL/6 and CD-1 brains with anti-PECAM-1, illustrating increased CD-1 vascular density in SVZ areas under both normoxic and hypoxic conditions. Quantitation of vascular densities was expressed as relative aggregate tube lengths in pixels. A: Normoxic (Nx) C57BL/6 SVZ. B: Hypoxic (HX) C57BL/6 SVZ. C: Normoxic (Nx) CD-1 SVZ. D: Hypoxic (HX) CD-1 SVZ. E: Quantitation of vessels densities in the two mouse strains under normoxic and hypoxic conditions (n = 6).
CD-1 and C57BL/6 mice exhibit differential expression of HIF1α, BDNF, TrkB, fraction of phospho-TrkB, VEGF-A165, Nrp-1, CXCR4, and SDF-1
In light of the differences in animal survivability as well as hepatic extramedullary hematopoietic precursor induction and proliferative and apoptotic profiles of SVZ NPCs of these two mouse strains in response to chronic hypoxic insult, we determined the HIF1α protein levels in their brain lysates. HIF-1a, a subunit of HIF1 (composed of HIF-1a and HIF-1b subunits) is a basic-helix-loop-helix transcription factor that activates the transcription of erythropoietin, glucose transporters, glycolytic enzymes, VEGF, and other genes whose protein products are involved in the adaptation to hypoxia (Semenza, 1999, 2000). As illustrated in Figure 4A, CD1 pup brains exhibited significantly higher levels of HIF1α compared with C57BL/6 pups under normoxic conditions. Although both strains were noted to exhibit a nonstatistically significant trend of decreased HIF-1α expression following hypoxic insult (possibly resulting from increased apoptosis; Fig. 2F–J), the C57BL/6 pup brains exhibited decreased levels of HIF1α under hypoxic conditions compared with CD-1 pups.
Fig. 4.
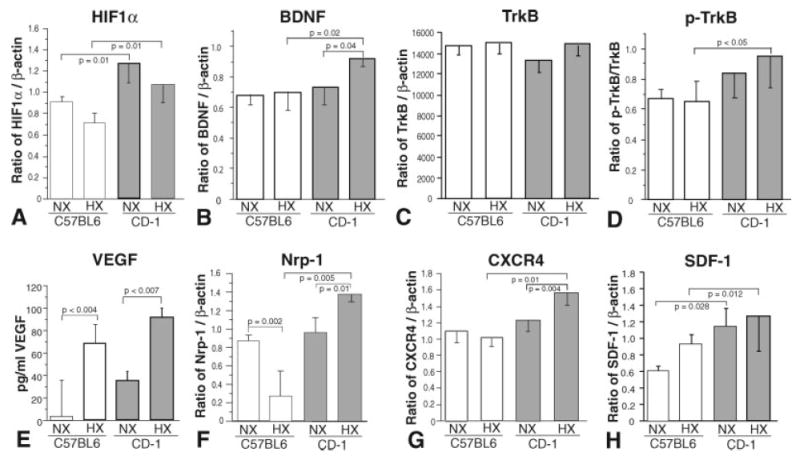
P11 C57BL/6 brain homogenates exhibit distinct normoxic and hypoxic selected transcription factor, growth factor, and receptor protein expression levels compared with CD-1 pups. Western blot (A–C,E–H) and ELISA (D) analyses of expression levels of HIF1α (A), BDNF (B), TrkB (C), p-TrkB (D), VEGF (E), Nrp-1 (F), CXCR4 (G), and SDF-1 (H) in C57BL/6 (open boxes) and CD-1 (shaded boxes) brain homogenates under normoxic (NX) and hypoxic (HX) conditions (vertical bars represent standard deviations; n = 3).
In addition, the levels of several other proteins known to be modulated by HIF-1α including VEGF, SDF-1, BDNF and their cognate receptors (neuropilin-1 [Nrp-1], CXCR4, and TrkB) were assessed. As determined by Western blotting, BDNF levels in CD-1 brain lysates were increased compared with C57BL/6 pups in hypoxic conditions (Fig. 4B), which is consistent with BDNF being upstream of HIF1α (Nakamura et al., 2006) in that BDNF is known to induce HIF1α, which in turn induces VEGF expression, which has been shown to induce BDNF, completing this activation loop. Although levels of TrkB (the cognate receptor for BDNF) in brain lysates from both strains were similar under normoxic and hypoxic conditions (Fig. 4C), the fraction of phsophorylated (activated) TrkB, determined by immunoprecipitation followed by Western blotting for phosphotyrosine (PY), was increased in CD-1 lysates under hypoxic conditions (Fig. 4D).
We also determined that VEGF-A165 levels, assayed by ELISA, in CD-1 brain lysates were increased compared with C57BL/6 pups under hypoxic conditions compared with their normoxic controls, which is consistent with VEGF being downstream of HIF1α (Nordal et al., 2004; Jensen et al., 2006; Fig. 4E).
Levels of Nrp-1, a protein that regulates signal transduction by the tyrosine kinase receptors of VEGF through formation of complexes with these receptors (Neufeld et al., 2002), were measured by Western blot. Although we found that levels in C57BL/6 and CD-1 brain lysates were similar under normoxic conditions, after hypoxic treatment Nrp-1 levels in C57BL/6 lysates were markedly decreased, whereas levels in CD-1 lysates were elevated (Fig. 4F) consistent with enhanced VEGF signaling in CD-1 NPCs.
With Western blotting, we also found that expression of CXCR4, the cognate receptor for SDF-1, was significantly increased in CD-1 brain lysates following hypoxic insult, whereas C57BL/6 lysate levels remained unchanged (Fig. 4G). In light of our finding of differential CXCR4 expression levels, we determined SDF-1 levels in the brain lysates. As illustrated in Figure 4H, under normoxic conditions, CD-1 SDF-1 brain lysate levels, assayed by Western blotting, were found to be higher than levels found in C57BL/6 brain lysates. The same was found under hypoxic conditions, with higher SDF-1 levels found in CD-1 lysates.
In Vitro Studies
To assess potential differences in NPC populations suggested in the above-described brain tissue morphological/immunohistochemical studies (Figs. 2, 3), we isolated, cultured, and analyzed the proliferative and apoptotic behaviors and the expression levels of the same selected ligands and receptors in paired CD-1 and C57BL/6 NPC cultures under normoxic and hypoxic conditions.
NPCs harvested from CD-1 and C57BL/6 P1 pups exhibit differential proliferative and apoptotic behaviors under normoxic and hypoxic conditions
Percentage increases in cell numbers of paired NPCs harvested from P1 C57BL/6 and CD-1 pups were assessed under normoxic conditions by using cell counting (Fig. 5A), BrdU incorporation (Fig. 5B,C), and primary neurosphere counting (Fig. 5D,E) techniques (Yang and Levison, 2006). As illustrated in Figure 5A–E, CD-1 NPCs exhibited significantly greater increases in cell numbers compared with C57BL/6 NPCs in all assays. In addition, when secondary (s°) neurosphere cultures were similarly assessed (Fig. 5F), CD-1 2° neurospheres were observed to be increased in number and to be larger than C57BL/6 2° neurospheres, consistent with a greater proliferative rate and/or a decreased apoptotic rate (Fig. 5G) as noted in the SVZ immunohistochemistry data (Figs. 2, 3). Specifically, Figure 5G illustrates a 54% reduction in C57BL/6 2° neurosphere number under hypoxic culture conditions compared with normoxic cultures, whereas CD-1 neurosphere number is only modestly affected (8% decrease) compared with normoxic cultures under identical conditions. Western blots of C57BL/6 and CD-1 NPC lysates revealed increased levels of CC3 in C57BL/6 NPCs cultured under hypoxic conditions compared with normoxic cultures, whereas hypoxic CD-1 NPCs exhibited a modest, nonstatistically significant increase (Fig. 5G) compared with normoxic cultures.
Fig. 5.

Primary cultured C57BL/6 neurospheres exhibit reduced proliferation and increased apoptosis compared with similarly cultured CD-1 neurospheres. A: Cell counting revealed increased numbers of CD-1 NPCs (1.00 × 10⁵ at day 0 to 2.49 × 10⁵ ± 7.9 × 10⁴ at day 3) compared with similarly cultured C57BL/6 NPCs (1.00 × 10⁵ at day 0 to 1.46 × 10⁵ ± 3.2 × 10⁴ at day 3). B: This was confirmed by using BrdU incorporation and staining. C: Representative CD-1 and C57BL/6 neurospheres illustrating BrdU incorporation (green fluorescence). D: Counting the numbers of primary neurospheres also illustrated the increased proliferative rate of CD-1 NPCs compared with C57BL/6 NPCs. E,F: Representative CD-1 and C57BL/6 primary (1° NS) and secondary (2° NS) neurosphere cultures illustrating the differences in proliferation. G: Counting the numbers of secondary neurospheres illustrated the increased proliferative rate of CD-1 NPCs (shaded boxes) compared with C57BL/6 NPCs (open boxes) under normoxic and hypoxic conditions. Comparisons of the normoxic and hypoxic 2° neurosphere counts revealed a greater than 50% decrease in numbers of C57BL/6 neurospheres cultured under hypoxic conditions compared with normoxic cultures, only a modest 8% decrease in similarly cultured CD-1 neurospheres compared with normoxic cultures. H: Cleaved caspase 3 Western blots of C57BL/6 (open boxes) and CD-1 (shaded boxes) lysates, illustrating increased apoptosis in C57BL/6 NPCs cultured under hypoxic conditions (vertical bars represent standard deviations; n = 3).
CD-1 and C57BL/6 NPCs exhibit differential protein expression of HIF1α, PHD2, VEGF-A165, Nrp-1, BDNF, CXCR4, and SDF-1
Although NPCs harvested from P1 C57BL/6 and CD-1 pups exhibited similar levels of HIF1α expression under normoxic conditions, CD-1 NPCs were found to exhibit an increased expression level of HIF1α under hypoxic culture conditions (Fig. 6A), consistent with CD-1’s increased survival and proliferation under hypoxic conditions in vivo as demonstrated above. Consistent with the increase in HIF1α expression levels in CD-1 NPCs cultured under hypoxic conditions, expression levels of PHD2, the enzyme known to mediate proline hydroxylation of HIF1α, targeting it to the proteosome for degradation (Jaakkola et al., 2001), were found to be decreased in CD-1 NPCs cultured under hypoxic conditions (Fig. 6B).
Fig. 6.

C57BL/6 NPC culture homogenates exhibit distinct normoxic and hypoxic selected transcription factor, growth factor, and receptor protein expression levels compared with CD-1 NPCs. Western blot (A,B,E–H) and ELISA (C,D) analyses of expression levels of HIF1α (A), PHD2 (B), VEGF (C,D), Nrp-1 (E), BDNF (F) CXCR4 (G), and SDF-1 (H) in C57BL/6 (open boxes) and CD-1 (shaded boxes) NPC homogenates under normoxic (NX) and hypoxic (HX) conditions (vertical bars represent standard deviations; n = 3).
VEGF ELISA quantitative analysis of C57BL/6 and CD-1 NPC medium and lysates revealed that C57BL/6 NPCs expressed lower levels of VEGF-A165 compared with CD-1 NPCs, and, although NPCs from both strains exhibited induction of VEGF-A165 when cultured under hypoxic conditions, the CD-1 NPCs exhibited greater VEGF induction compared with C57BL/6 NPCs (Fig. 6C,D). Examination of neuropilin-1 levels in NPC lysates revealed increased levels in CD-1 lysates harvested under normoxic conditions. Under hypoxic conditions, CD-1 lysates exhibited an induction of Nrp-1, whereas the C57BL/6 NPCs exhibited no appreciable induction (Fig. 6E).
BDNF Western blot analysis of C57BL/6 and CD-1 NPC lysates revealed that C57BL/6 NPCs expressed lower levels of BDNF compared with CD-1 NPCs. However, unlike our findings for VEGF, neither strain’s NPCs exhibited induction of BDNF when cultured under hypoxic conditions (Fig. 6F).
In light of the known roles of SDF-1 as a modulator of NPC behaviors (Imitola et al., 2004; Gong et al., 2006), CXCR4 expression was assessed. Western blot analysis of C57BL/6 and CD-1 NPC lysates revealed that C57BL/6 NPCs expressed lower levels of CXCR4 compared with CD-1 NPCs under normoxic conditions, and, although CD-1-derived NPCs exhibited induction of CXCR4 when cultured under hypoxic conditions, the C57BL/6-derived NPCs exhibited no appreciable CXCR4 induction (Fig. 6G). Our finding of differential NPC CXCR4 expression levels prompted us to determine SDF-1 levels in CD-1 and C57BL/6 NPCs. As illustrated in Figure 6H, under normoxic conditions, CD-1 SDF-1 NPC lysate levels were found to be higher than levels found in C57BL/6 NPC lysates. The same was found under hypoxic conditions, with higher SDF-1 levels found in CD-1 NPC lysates.
Addition of exogenous SDF-1 and VEGF enhances C57BL/6 NPC proliferation rates to CD-1 levels and abrogates the effects of hypoxia on C57BL/6 NPC proliferation
In light of their importance in NPC survival, proliferation, homing, and differentiation, we determined the relative effects of exogenous SDF-1 and VEGF on normoxic and hypoxic C57BL/6 and CD-1 NPC 2° neurosphere culture proliferation. C57BL/6 neurosphere proliferation under both normoxic (Fig. 7A,D) and hypoxic (Fig. 7B,E) culture conditions is increased in the presence of SDF-1 and VEGF, bringing the C57BL/6 2° neurosphere proliferative rates up to or near the CD-1 2° neurosphere proliferation rate. Exogenous SDF-1 and VEGF treatments (5 ng) also abrogate the effects of hypoxia, enhancing NPC 2° neurosphere proliferation to levels observed under normoxic conditions (Fig. 7B,E). These data were confirmed using the Cyquant Cell Proliferation Assay Kit (Fig. 7H,I). Additionally, addition of anti-SDF-1 or sFlt-1 to CD-1 NPC cultures reduced CD-1 NPC proliferation to that of C57BL/6 NPCs (Fig. 7C,F).
Fig. 7.
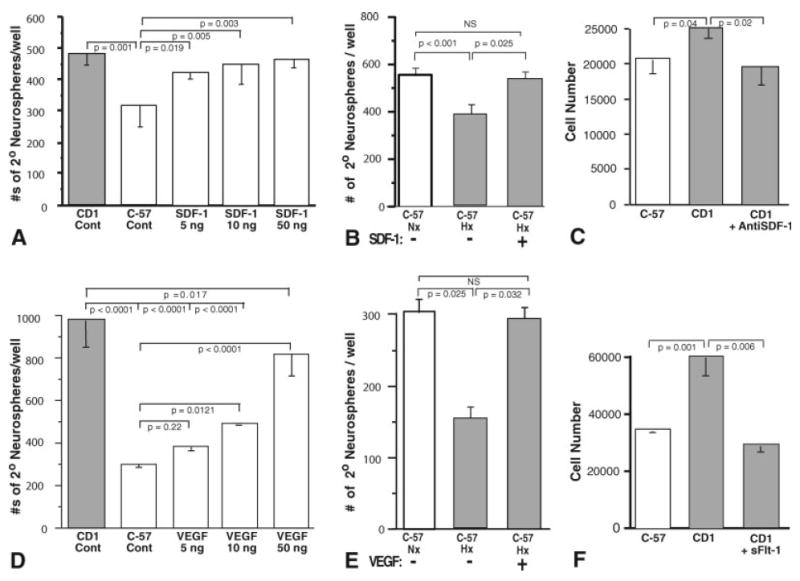

SDF-1 and VEGF enhance C57BL/6 secondary neurosphere proliferation, whereas BDNF enhances NPC adhesion and GFAP expression as well as proliferation. SDF-1 and VEGF treatment of C57BL/6 2° neurosphere cultures elicits increased proliferation under normoxic conditions to levels approximating CD-1 proliferation levels (A,D). Additionally, SDF-1 (B) and VEGF (E) treatment of hypoxic C57BL/6 2° neurosphere cultures elicits increased proliferation to levels approximating C57BL/6 normoxic proliferation levels. Furthermore, addition of anti-SDF-1 or sFlt-1 reduces CD-1 NPC proliferation to C57BL/6 NPC levels (C,F). In contrast to SDF-1 and VEGF treatments, BDNF treatment of C57BL/6 2° neurosphere cultures elicits increased differentiation as evidenced by increased neurofilament and GFAP expression and an adherent, spindle-shaped morphology compared with SDF-1- and VEGF-treated cultures (G, panels 1–20), while still inducing increased proliferation similar to that of SDF-1 and VEGF treatments (H–J). Addition of sTrkB reduced CD-1 NPC proliferation to that of C57BL/6 NPCs (K; vertical bars represent standard deviations; n = 3).
In contrast, unlike SDF-1 and VEGF, exogenous BDNF elicited a loss of NPC neurosphere formation and instead elicited an adherent phenotype, with the NPCs taking on spindled, elongated shapes and forming linear aggregates on the culture dishes (Fig. 7G, panels 4, 8, 12, 16). Immunostaining of the cultures revealed that, whereas exogenous SDF-1 and VEGF resulted in persistence of NPC neurosphere expression of nestin, with only modest glial fibrillary acidic protein (GFAP) expression and essentially no detectable neurofilament or βIII-tubulin staining (Fig. 7G, panels 1–12), exogenous BDNF resulted in adherent NPC robust expression of neurofilament, GFAP, and βIII-tubulin (not shown), consistent with the induction of radial glia/neuronal differentiation (Fig. 7G, panels 13–20). However, concurrent with the observed increased adhesion and radial glial differentiation, the NPCs exposed to exogenous BDNF also exhibited an increased proliferation, again bringing the C57BL/6 2° NPC proliferative rates up to or near the CD-1 2° NPC proliferation rate, similar to SDF-1 and VEGF treatments (Fig. 7H–J). Additionally, similarly to the effects of anti-SDF-1 and sFlt-1 (Fig. 7C,F), addition of sTrkB also reduced CD-1 NPC proliferation to that of C57BL/6 NPCs (Fig. 7K).
CD-1 and C57BL/6 NPCs exhibit differential expression of NO, and NO is a modulator of an HIF-1a/PHD2 autoregulatory loop
NO is a known autocrine and paracrine modulator of neuronal behaviors and has been shown to stabilize HIF-1α via direct S-nitrosylation and indirectly by inhibiting proyl hydroxylases (Martinez-Ruiz and Lamas, 2004; Li et al., 2007; Ozturk et al., 2007). In both normoxic (20%) and 10% O2 environments, C57BL/6 NPCs exhibit minimal NO expression (Fig. 8A,B), whereas CD-1 NPCs exhibit a robust NO expression, which is not appreciably different in either the normoxic or hypoxic environments studied (Fig. 8C,D). Quantitation of eNOS protein levels revealed that both C57BL/6 and CD-1 eNOS levels were not induced under hypoxic conditions; however, CD-1 NPCs expressed 2-fold more eNOS compared with C57BL/6 NPCs under both conditions (Fig. 8E; 2.19-fold increase, P < 0.02). Determination of NPC proliferation in C57BL/6 NPC neurospheres using proliferating cell nuclear antigen (PCNA) expression levels in the absence and presence of NOC-18, a slow-release NO donor, revealed a 2-fold increase in proliferation, whereas treatment of CD-1 NPC neurospheres with C-PTIO, an NO scavenger, revealed a 2.5-fold decrease in proliferation (Fig. 8F). Examination of HIF-1α levels in C57BL/6 NPC neurospheres in the absence and presence of NOC-18 revealed a 3-fold increase in HIF-1α in the presence of NOC-18, bringing the HIF-1α level up to that observed in CD-1 NPC neurosphere cultures; whereas treatment of CD-1 NPC neurospheres with C-PTIO reduced HIF-1α levels to those of C57BL/6 NPCs (Fig. 8G). Additionally, C-PTIO treatment of CD-1 NPCs resulted in a 2.3-fold increase in prolyl hydroxylase domain 2 (Fig. 8H). These findings are consistent with our findings of increased HIF-1α expression and a trend toward lower PHD2 levels in CD-1 brain lysates and NPCs (Figs. 4A, 6A,B) and are consistent with findings recently published by Berchner-Pfannschmidt et al. (2007), who have demonstrated NO modulation of an HIF-1a/PHD2 autoregulatory loop.
Fig. 8.
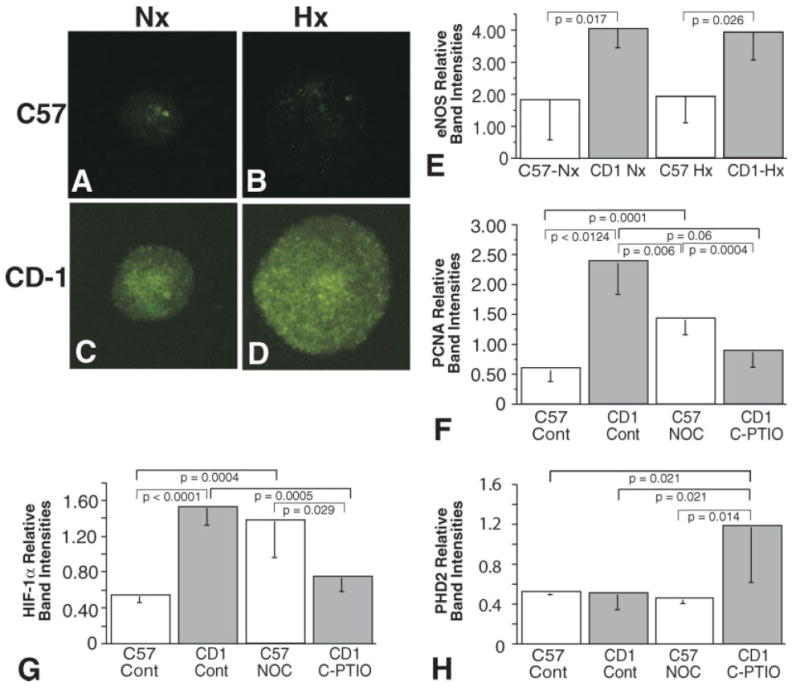
Primary cultured C57BL/6 neurospheres exhibit reduced NO expression compared with similarly cultured CD-1 neurospheres. Representative fluorescence micrographs of DAF-FM labeled normoxic (A) and hypoxic (B) C57BL/6 neurospheres and normoxic (C) and hypoxic (D) CD-1 neurospheres that had been cultured for 6 days. E: Western blot analysis of expression levels of eNOS in C57 and CD-1 NPC neurosphere cultures under normoxic and hypoxic conditions. Western blot analysis of expression levels of PCNA (F) and HIF-1α (G) in C57 NPC neurospheres in the absence (Cont) and presence of NOC-18 and CD-1 NPC neurosphere in the absence (Cont) and presence of C-PTIO. H: Western blot analysis of expression levels of PHD2 in C57 NPC neurospheres in the absence (Cont) and presence of NOC-18 and CD-1 NPC neurosphere in the absence (Cont) and presence of C-PTIO (vertical bars represent standard deviations; n = 3).
DISCUSSION
In our murine model of chronic sublethal hypoxia (Fagel et al., 2005), we observed that, in contrast to the near 100% survival of CD-1 pups for up to a 30-day exposure, C57BL/6 pups succumbed at day 13, after 10 days of hypoxia. To elucidate the underlying differences in these two mouse strains, we undertook an in vivo approach of shortening the hypoxic period to 8 days (P3–P11), which resulted in survival of both strains, allowing us to explore potential differences underlying the differing susceptibilities of these two strains to hypoxia.
In initial studies, we examined the induction of extramedullary hematopoiesis (EMH), a well-studied response to hypoxia. Although no differences between C57BL/6 and CD-1 P11 pups were observed under normoxic conditions, the CD-1 pups exhibited a 3.4-fold induction in EMH following exposure to hypoxic (9.5% O2) conditions, whereas similarly treated C57BL/6 pups exhibited no appreciable induction. These findings led us to hypothesize that other stem/progenitor cell populations may exhibit similar behavioral differences and encouraged us to investigate potential differences in the NPC populations of these two strains. Our in vivo and in vitro data revealed a higher baseline proliferation of SVZ NPCs of CD-1 mouse pups compared with those of C57BL/6 pups, indicating that CD-1 NPC self-renewal ability is appreciably greater than that observed in C57BL/6 NPCs. In contrast, the apoptosis level of C57BL/6 SVZ NPCs was found to be significantly increased compared with that of CD-1 pups. Interestingly, SVZ microvascular density in CD-1 brains was greater than that determined in matched C57BL/6 brains, consistent with the concept of neurovascular coupling (Wurmser et al., 2004). These results are consistent with the concept that C57BL/6 pups may be more sensitive to the hypoxic conditions employed in our in vivo studies and may mimic the more profound effects of chronic hypoxia experienced by a number of very-low-birth-weight premature infants, resulting in significant neurodevelopmental handicaps and a variable recovery (Hack et al., 2002; Tyson and Saigal, 2005).
To elucidate the mechanisms underlying these differences in NPC behavior, protein expression of several factors and receptors known to be modulated by hypoxia and associated with cell survival and/or proliferation were assessed in both brain lysates and cultured NPCs derived from these two mouse strains (Tomita et al., 2003; Kim et al., 2004; Tang et al., 2004; Brusselmans et al., 2005; Miller et al., 2005; Luo et al., 2006; Nakamura et al., 2006). Interestingly, significant differences in HIF1α, BDNF, VEGF, SDF-1, Nrp-1, and CXCR4 expression and TrkB activation were observed upon examination of brain lysates. In general, the levels of both the factors and the receptors analyzed were higher in CD-1 brain tissue lysates compared with the C57BL/6 lysates.
To identify expression differences in C57BL/6 and CD-1 NPC populations, we analyzed cell lysates harvested from similarly prepared and treated C57BL/6 and CD-1 NPC cultures (Li et al., 2006). When analyzed in proliferation, apoptosis, and protein expression level assays, the NPCs isolated from these two mouse strains essentially mirrored the results obtained from our immunohistochemistry and brain tissue lysate analyses. In agreement with our immunohistochemistry analyses of proliferation and apoptosis of P11 brains, NPCs derived from CD-1 pups exhibited increased proliferation and decreased apoptosis compared with C57BL/6 NPCs. Interestingly, significant differences in HIF1α, BDNF, VEGF, SDF-1, Npl-1, and CXCR4 expression were observed upon examination of NPC lysates and media fractions similar to the differences observed in the brain lysate analyses. In general, the levels of both the factors and the receptors analyzed were higher in CD-1 brain tissue lysates when assayed under normoxic conditions (VEGF, Npl-1, CXCR4, SDF-1) and/or induced to greater extents when assayed under hypoxic conditions (VEGF, SDF-1) with the exception of PHD2, which was found to be lower in CD-1 NPC lysates (which is consistent with the increased levels of HIF1α observed in the CD-1 NPCs). Similar differences in the expression levels of these factors and receptors were observed in the analyses of the CD-1 and C57BL/6 normoxic and hypoxic NPC cultures.
The functional significance of the expression levels of these factors is illustrated in Figure 7, in which low nanogram levels of exogenously added rSDF-1 and rVEGF, in addition to maintaining neurosphere formations, increased the proliferative rate of C57BL/6 NPCs under normoxic conditions to that of CD-1 NPCs and were observed to rescue the reduced proliferative rates observed in hypoxic conditions in C57BL/6 NPCs. In contrast exogenous rBDNF was noted to evoke neuronal adhesion, βIII-tubulin, and GFAP expression (consistent with radial glia differentiation of the NPCs), eliciting loss of neurosphere formation and a change in phenotype of the NPCs, albeit while stimulating NPC proliferation.
Figure 9 illustrates our current working model, in which these selected ligands and their receptors were found to be up-regulated in CD-1 brain tissue and isolated NPCs when assessed under normoxic and/or hypoxic conditions compared with C57BL/6 brain tissue and NPC cells. Thus, the differences in animal survival, hematopoietic stem cell, and neural progenitor cell proliferative, survival, and differentiation behaviors observed in these two mouse strains may, in part, be explained by differences in HIF-1α-modulated signaling pathways mediated by VEGF, SDF-1, and BDNF, all of which are known to exhibit modulation by HIF-1α (Sandau et al., 2001; Ceradini et al., 2004; Nakamura et al., 2006; Zagzag, 2006; Li et al., 2007; Sumbayev and Yasinska, 2007). Furthermore, the differential expression of eNOS and NO by C57BL/6 and CD-1 NPCs (Fig. 8) provides a potential explanation for the differential responsiveness to hypoxia of these two mouse strains via an HIF-1a/PHD2 autoregulatory loop (Berchner-Pfannschmidt et al., 2007; Brune and Zhou, 2007; Li et al., 2007). These data are consistent with recent clinical data demonstrating that premature infants treated with inhaled NO exhibited reduced risk of brain injury (Kinsella et al., 2006) and had improved neurodevelopmental outcomes at 2 years of age (Mestan et al., 2005). Additionally, these strain differences may provide insights needed to develop a better understanding of NPC behavior during the variable repair/recovery observed following chronic hypoxic injury in the very-low-birth-weight premature newborn population, as well as in adult populations following stroke and during neurode-generation (Chouthai et al., 2003). Investigations utilizing these mouse strains and cells derived from them may also allow the development of rational therapeutic modalities that might beneficially affect recovery in these at-risk populations (Wang et al., 2004; Kinsella et al., 2006).
Fig. 9.
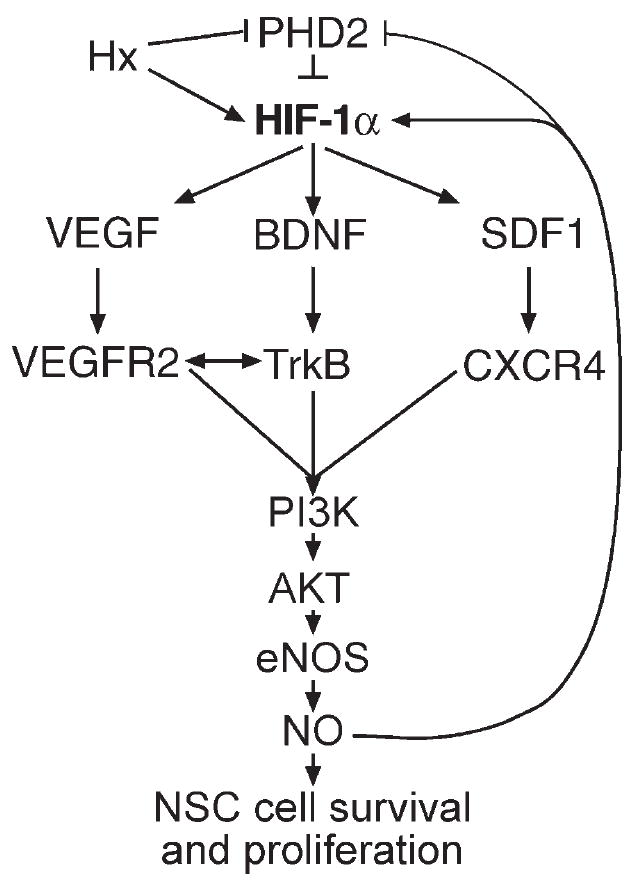
Working model of the signaling pathway components that are differentially regulated in C57BL/6 and CD-1 pup brain tissues and cultured NPCs under normoxic and hypoxic conditions.
Acknowledgments
The authors thank Dr. Laura Ment for her critical reading of the manuscript.
Contract grant sponsor: USPHS; Contract grant number: PO1-NS35476 (to J.A.M.); Contract grant number: R37-HL28373-27 (to J.A.M.); Contract grant number: RO1-HL51018 (to J.A.M.).
Footnotes
Supplementary Material for this article is available online at http://www.mrw.interscience.wiley.com/suppmat/0360-4012/suppmat/ (www.interscience.wiley.com).
Published online 18 December 2007 in Wiley InterScience (www.interscience.wiley.com).
References
- Banno F, Kaminaka K, Soejima K, Kokane K, Miyata T. Identification of strain-specific variants of mouse Adamts13 gene encoding von willebrand factor-cleaving protease. J Biol Chem. 2004;279:30896–30903. doi: 10.1074/jbc.M314184200. [DOI] [PubMed] [Google Scholar]
- Bassan H, Feldman HA, Limperopoulos C, Benson CB, Ringer SA, Veracruz E, Soul JS, Volpe JJ, du Plessis AJ. Periventricular hemorrhagic infarction: risk factors and neonatal outcome. Pediatr Neurol. 2006;35:85–92. doi: 10.1016/j.pediatrneurol.2006.03.005. [DOI] [PubMed] [Google Scholar]
- Beckmann N. Mouse strain differences in the cerebrovascular anatomy detected non-invasively by high resolution magnetic resonance angiography. Proc Int Soc Mag Reson Med. 2000;8:363. doi: 10.1002/1522-2594(200008)44:2<252::aid-mrm12>3.0.co;2-g. [DOI] [PubMed] [Google Scholar]
- Berchner-Pfannschmidt U, Yamac H, Trinidad B, Fandrey J. Nitric oxide modulates oxygen sensing by hypoxia-inducible factor 1-dependent induction of prolyl hydroxylase 2. J Biol Chem. 2007;282:1788–1796. doi: 10.1074/jbc.M607065200. [DOI] [PubMed] [Google Scholar]
- Brune B, Zhou J. Nitric oxide and superoxide: Interference with hypoxic signaling. Cardiovasc Res. 2007;75:275–282. doi: 10.1016/j.cardiores.2007.03.005. [DOI] [PubMed] [Google Scholar]
- Brusselmans K, Bono F, Collen D, Herbert JM, Carmeliet P, Dewerchin M. A novel role for vascular endothelial growth factor as an autocrine survival factor for embryonic stem cells during hypoxia. J Biol Chem. 2005;280:3493–3499. doi: 10.1074/jbc.M406613200. [DOI] [PubMed] [Google Scholar]
- Ceradini DJ, Kulkarni AR, Callaghan M, Tepper OM, Bastidas N, Kleinman ME, Capla JM, Galiano RD, Levine JP, Gurtner GC. Progenitor cell trafficking is regulated by hypoxic gradients through HIF-1 induction of SDF-1. Nat Med. 2004;10:858–864. doi: 10.1038/nm1075. [DOI] [PubMed] [Google Scholar]
- Chalothorn D, Clayton JA, Zhang H, Pomp D, Faber JE. Collateral density, remodeling and VEGF-A expression differ widely between mouse strains. Physiol Genom. 2007;30:179–191. doi: 10.1152/physiolgenomics.00047.2007. [DOI] [PubMed] [Google Scholar]
- Chan CK, Pham LN, Chinn C, Spee C, SRyan SJ, Akhurst RJ, Hinton DR. Mouse strain-dependent heterogeneity of resting limbal vasculature. Invest Ophthalmol Vis Sci. 2004;45:441–447. doi: 10.1167/iovs.03-0869. [DOI] [PubMed] [Google Scholar]
- Chouthai NS, Sampers J, Desai N, Smith GM. Changes in neurotrophin levels in umbilical cord blood from infants with different gestational ages and clinical conditions. Pediatr Res. 2003;53:965–969. doi: 10.1203/01.PDR.0000061588.39652.26. [DOI] [PubMed] [Google Scholar]
- Chow J, Ogunshola O, Fan SY, Li Y, Ment LR, Madri JA. Astrocyte-derived VEGF mediates survival and tube stabilization of hypoxic brain microvascular endothelial cells in vitro. Brain Res Dev Brain Res. 2001;130:123–132. doi: 10.1016/s0165-3806(01)00220-6. [DOI] [PubMed] [Google Scholar]
- Cooke RW. Preterm mortality and morbidity over 25 years. Arch Dis Child Fetal Neonatal Ed. 2006;91:F293–294. doi: 10.1136/adc.2005.080192. [DOI] [PMC free article] [PubMed] [Google Scholar]
- Curristin SM, Cao A, Stewart WB, Zhang H, Madri JA, Morrow JS, Ment LR. Disrupted synaptic development in the hypoxic newborn brain. Proc Natl Acad Sci U S A. 2002;99:15729–15734. doi: 10.1073/pnas.232568799. [DOI] [PMC free article] [PubMed] [Google Scholar]
- Doetsch F. A niche for adult neural stem cells. Curr Opin Genet Dev. 2003;13:543–550. doi: 10.1016/j.gde.2003.08.012. [DOI] [PubMed] [Google Scholar]
- Fagel DM, Ganat Y, Silbereis J, Ebbitt T, Stewart W, Zhang H, Ment LR, Vaccarino FM. Cortical neurogenesis enhanced by chronic perinatal hypoxia. Exp Neurol. 2005;199:77–91. doi: 10.1016/j.expneurol.2005.04.006. [DOI] [PubMed] [Google Scholar]
- Felling RJ, Snyder MJ, Romanko MJ, Rothstein RP, Ziegler AN, Yang Z, Givogri MI, Bongarzone ER, Levison SW. Neural stem/progenitor cells participate in the regenerative response to perinatal hypoxia/ischemia. J Neurosci. 2006;26:4359–4369. doi: 10.1523/JNEUROSCI.1898-05.2006. [DOI] [PMC free article] [PubMed] [Google Scholar]
- Gong X, He X, Qi L, Zuo H, Xie Z. Stromal cell derived factor-1 acutely promotes neural progenitor cell proliferation in vitro by a mechanism involving the ERK1/2 and PI-3K signal pathways. Cell Biol Int. 2006;30:466–471. doi: 10.1016/j.cellbi.2006.01.007. [DOI] [PubMed] [Google Scholar]
- Hack M, Flannery DJ, Schluchter M, Cartar L, Borawski E, Klein N. Outcomes in young adulthood for very-low-birth-weight infants. N Engl J Med. 2002;346:149–157. doi: 10.1056/NEJMoa010856. [DOI] [PubMed] [Google Scholar]
- Imitola J, Raddassi K, Park KI, Mueller FJ, Nieto M, Teng YD, Frenkel D, Li J, Sidman RL, Walsh CA, Snyder EY, Khoury SJ. Directed migration of neural stem cells to sites of CNS injury by the stromal cell-derived factor 1alpha/CXC chemokine receptor 4 pathway. Proc Natl Acad Sci U S A. 2004;101:18117–18122. doi: 10.1073/pnas.0408258102. [DOI] [PMC free article] [PubMed] [Google Scholar]
- Jaakkola P, Mole DR, Tian YM, Wilson MI, Gielbert J, Gaskell SJ, Kriegsheim AV, Hebestreit HF, Mukherji M, Schofield CJ, Maxwell PH, Pugh CW, Ratcliffe PJ. Targeting of HIF-alpha to the von Hippel-Lindau ubiquitylation complex by O2-regulated prolyl hydroxylation. Science. 2001;292:468–472. doi: 10.1126/science.1059796. [DOI] [PubMed] [Google Scholar]
- Jensen RL, Ragel BT, Whang K, Gillespie D. Inhibition of hypoxia inducible factor-1alpha (HIF-1alpha) decreases vascular endothelial growth factor (VEGF) secretion and tumor growth in malignant gliomas. J Neurooncol. 2006;78:233–247. doi: 10.1007/s11060-005-9103-z. [DOI] [PubMed] [Google Scholar]
- Kim H, LI Q, Hempstead B, Madri JA. Paracrine and autocrine functions of BDNF and NGF in brain-derived endothelial cells. J Biol Chem. 2004;279:33538–33546. doi: 10.1074/jbc.M404115200. [DOI] [PubMed] [Google Scholar]
- Kinsella JP, Cutter GR, Walsh WF, Gerstmann DR, Bose CL, Hart C, Sekar KC, Auten RL, Bhutani VK, Gerdes JS, George TN, Southgate WM, Carriedo H, Couser RJ, Mammel MC, Hall DC, Pappagallo M, Sardesai S, Strain JD, Baier M, Abman SH. Early inhaled nitric oxide therapy in premature newborns with respiratory failure. N Engl J Med. 2006;355:354–364. doi: 10.1056/NEJMoa060442. [DOI] [PubMed] [Google Scholar]
- Krisle RA, Ershler WB. Investigation of tumor angiogenesis in an id mouse model: role of host-tumor interactions. JNCI. 1988;80:849–854. doi: 10.1093/jnci/80.11.849. [DOI] [PubMed] [Google Scholar]
- Li F, Sonveaux P, Rabbani ZN, Liu S, Yan B, Huang Q, Vujaskovic Z, Dewhirst MW, Li C-Y. Regulation of HIF-1alpha stability through S-nitrosylation. Mol Cell. 2007;26:63–74. doi: 10.1016/j.molcel.2007.02.024. [DOI] [PMC free article] [PubMed] [Google Scholar]
- Li Q, Ford MC, Lavik EB, Madri JA. Modeling the neurovascular niche: VEGF- and BDNF-mediated cross-talk between neural stem cells and endothelial cells: an in vitro study. J Neurosci Res. 2006;84:1656–1668. doi: 10.1002/jnr.21087. [DOI] [PubMed] [Google Scholar]
- Luo Y, Cai J, Xue H, Mattson MP, Rao MS. SDF1alpha/CXCR4 signaling stimulates beta-catenin transcriptional activity in rat neural progenitors. Neurosci Lett. 2006;398:291–295. doi: 10.1016/j.neulet.2006.01.024. [DOI] [PubMed] [Google Scholar]
- MacDonald MJ. Differences between mouse and rat pancreatic islets: succinate responsiveness, malic enzyme, and anaplerosis. Am J Physiol Endocrinol Metab. 2002;283:32899–32904. doi: 10.1152/ajpendo.00041.2002. [DOI] [PubMed] [Google Scholar]
- Martinez-Ruiz A, Lamas S. S-nitrosylation: a potential new paradigm in signal transduction. Cardiovasc Res. 2004;62:43–52. doi: 10.1016/j.cardiores.2004.01.013. [DOI] [PubMed] [Google Scholar]
- Mestan KK, Marks JD, Hecox K, Huo D, Schreiber MD. Neurodevelopmental outcomes of premature infants treated with inhaled nitric oxide. N Engl J Med. 2005;353:23–32. doi: 10.1056/NEJMoa043514. [DOI] [PubMed] [Google Scholar]
- Miller DB, O’Callaghan JP. Neurotoxicity of d-amphetamine in the C57BL/6J and CD-1 mouse. Interactions with stress and the adrenal system. Ann N Y Acad Sci. 1996;801:148–167. doi: 10.1111/j.1749-6632.1996.tb17438.x. [DOI] [PubMed] [Google Scholar]
- Miller JT, Bartley JH, Wimborne HJ, Walker AL, Hess DC, Hill WD, Carroll JE. The neuroblast and angioblast chemotaxic factor SDF-1 (CXCL12) expression is briefly up regulated by reactive astrocytes in brain following neonatal hypoxic-ischemic injury. BMC Neurosci. 2005;6:63–74. doi: 10.1186/1471-2202-6-63. [DOI] [PMC free article] [PubMed] [Google Scholar]
- Mizumoto H, Mizumoto K, Shatos MA, Klassen H, Young MJ. Retinal transplantation of neural progenitor cells derived from the brain of GFP transgenic mice. Vis Res. 2003;43:1699–1708. doi: 10.1016/s0042-6989(03)00235-9. [DOI] [PubMed] [Google Scholar]
- Nakamura K, Martin KC, Jackson JK, Beppu K, Woo CW, Thiele CJ. Brain-derived neurotrophic factor activation of TrkB induces vascular endothelial growth factor expression via hypoxia-inducible factor-1alpha in neuroblastoma cells. Cancer Res. 2006;66:4249–4255. doi: 10.1158/0008-5472.CAN-05-2789. [DOI] [PubMed] [Google Scholar]
- Nath AK, Enciso J, Kuniyasu M, Hao X-Y, Madri JA, Pinter E. Nitric oxide modulates murine yolk sac vasculogenesis and rescues glucose induced vasculopathy. Development. 2004;131:2485–2496. doi: 10.1242/dev.01131. [DOI] [PubMed] [Google Scholar]
- Neufeld G, Cohen T, Shraga N, Lange T, Kessler O, Herzog Y. The neuropilins: multifunctional semaphorin and VEGF receptors that modulate axon guidance and angiogenesis. Trends Cardiovasc Med. 2002;12:13–19. doi: 10.1016/s1050-1738(01)00140-2. [DOI] [PubMed] [Google Scholar]
- Nordal RA, Nagy A, Pintilie M, Wong CS. Hypoxia and hypoxia-inducible factor-1 target genes in central nervous system radiation injury: a role for vascular endothelial growth factor. Clin Cancer Res. 2004;10:3342–3353. doi: 10.1158/1078-0432.CCR-03-0426. [DOI] [PubMed] [Google Scholar]
- Ogunshola OO, Antic A, Donoghue MJ, Fan SY, Kim H, Stewart WB, Madri JA, Ment LR. Paracrine and autocrine functions of neuronal vascular endothelial growth factor (VEGF) in the central nervous system. J Biol Chem. 2002;277:11410–11415. doi: 10.1074/jbc.M111085200. [DOI] [PubMed] [Google Scholar]
- Ozturk H, Tuncer MC, Ozturk H, Buyukbayram H. Nitric oxide regulates expression of sonic hedgehog and hypoxia-inducible factor-1alpha in an experimental model of kidney ischemia-reperfusion. Renal Fail. 2007;29:249–256. doi: 10.1080/08860220601166289. [DOI] [PubMed] [Google Scholar]
- Paul DA, Leef KH, Locke RG, Bartoshesky L, Walrath J, Stefano JL. Increasing illness severity in very low birth weight infants over a 9-year period. BMC Pediatr. 2006;6:2. doi: 10.1186/1471-2431-6-2. [DOI] [PMC free article] [PubMed] [Google Scholar]
- Pinter E, Mahooti S, Wang Y, Imhof BA, Madri JA. Hyperglycemia-induced vasculopathy in the murine vitelline vasculature: correlation with PECAM-1/CD31 tyrosine phosphorylation state. Am J Pathol. 1999;154:1367–1379. doi: 10.1016/S0002-9440(10)65391-6. [DOI] [PMC free article] [PubMed] [Google Scholar]
- Saigal S, Stoskopf B, Streiner D, Boyle M, Pinelli J, Paneth N, Goddeeris J. Transition of extremely low-birth-weight infants from adolescence to young adulthood: comparison with normal birth-weight controls. JAMA. 2006;295:667–675. doi: 10.1001/jama.295.6.667. [DOI] [PubMed] [Google Scholar]
- Sandau KB, Fandrey J, Brune B. Accumulation of HIF-1alpha under the influence of nitric oxide. Blood. 2001;97:1009–1015. doi: 10.1182/blood.v97.4.1009. [DOI] [PubMed] [Google Scholar]
- Semenza GL. Regulation of mammalian O2 homeostasis by hypoxia-inducible factor 1. Annu Rev Cell Dev Biol. 1999;15:551–578. doi: 10.1146/annurev.cellbio.15.1.551. [DOI] [PubMed] [Google Scholar]
- Semenza GL. Expression of hypoxia-inducible factor 1: mechanisms and consequences. Biochem Pharmacol. 2000;59:47–53. doi: 10.1016/s0006-2952(99)00292-0. [DOI] [PubMed] [Google Scholar]
- Shen Q, Goderie SK, Jin L, Karanth N, Sun Y, Abramova N, Vincent P, Pumiglia K, Temple S. Endothelial cells stimulate self-renewal and expand neurogenesis of neural stem cells. Science. 2004;304:1338–1340. doi: 10.1126/science.1095505. [DOI] [PubMed] [Google Scholar]
- Sumbayev VV, Yasinska IM. Mechanisms of hypoxic signal transduction regulated by reactive nitrogen species. Scand J Immunol. 2007;65:399–406. doi: 10.1111/j.1365-3083.2007.01919.x. [DOI] [PubMed] [Google Scholar]
- Tang N, Wang L, Esko J, Giordano FJ, Huang Y, Gerber HP, Ferrara N, Johnson RS. Loss of HIF-1alpha in endothelial cells disrupts a hypoxia-driven VEGF autocrine loop necessary for tumorigenesis. Cancer Cell. 2004;6:485–495. doi: 10.1016/j.ccr.2004.09.026. [DOI] [PubMed] [Google Scholar]
- Tomita S, Ueno M, Sakamoto M, Kitahama Y, Ueki M, Maekawa N, Sakamoto H, Gassmann M, Kageyama R, Ueda N, Gonzalez FJ, Takahama Y. Defective brain development in mice lacking the Hif-1alpha gene in neural cells. Mol Cell Biol. 2003;23:6739–6749. doi: 10.1128/MCB.23.19.6739-6749.2003. [DOI] [PMC free article] [PubMed] [Google Scholar]
- Tyson JE, Saigal S. Outcomes for extremely low-birth-weight infants: disappointing news. JAMA. 2005;294:371–373. doi: 10.1001/jama.294.3.371. [DOI] [PubMed] [Google Scholar]
- Wang L, Zhang Z, Wang Y, Zhang R, Chopp M. Treatment of stroke with erythropoietin enhances neurogenesis and angiogenesis and improves neurological function in rats. Stroke. 2004;35:1732–1737. doi: 10.1161/01.STR.0000132196.49028.a4. [DOI] [PubMed] [Google Scholar]
- Ward NL, Lamanna JC. The neurovascular unit and its growth factors: coordinated response in the vascular and nervous systems. Neurol Res. 2004;26:870–883. doi: 10.1179/016164104X3798. [DOI] [PubMed] [Google Scholar]
- Warner-Schmidt JL, Duman RS. Hippocampal neurogenesis: opposing effects of stress and antidepressant treatment. Hippocampus. 2006;16:239–249. doi: 10.1002/hipo.20156. [DOI] [PubMed] [Google Scholar]
- Wilson-Costello D, Friedman H, Minich N, Fanaroff AA, Hack M. Improved survival rates with increased neurodevelopmental disability for extremely low birth weight infants in the 1990s. Pediatrics. 2005;115:997–1003. doi: 10.1542/peds.2004-0221. [DOI] [PubMed] [Google Scholar]
- Wurmser AE, Palmer TD, Gage FH. Neuroscience. Cellular interactions in the stem cell niche. Science. 2004;304:1253–1255. doi: 10.1126/science.1099344. [DOI] [PubMed] [Google Scholar]
- Yang Z, Levison SW. Hypoxia/ischemia expands the regenerative capacity of progenitors in the perinatal subventricular zone. Neuroscience. 2006;139:555–564. doi: 10.1016/j.neuroscience.2005.12.059. [DOI] [PubMed] [Google Scholar]
- Zagzag D, Lukyanov Y, Lan L, Ali MA, Esencay M, Mendez O, Yee H, Voura EB, Newcomb EW. Hypoxia-inducible factor 1 and VEGF upregulate CXCR4 in glioblastoma: implications for angiogenesis and glioma cell invasion. Lab Invest. 2006;86:1221–1232. doi: 10.1038/labinvest.3700482. [DOI] [PubMed] [Google Scholar]
- Zwemer CF, Song MY, Carello KA, D’Alecy LG. Strain differences in response to acute hypoxia: CD-1 vs. C57BL/6J mice. J Appl Physiol. 2006;102:286–293. doi: 10.1152/japplphysiol.00536.2006. [DOI] [PubMed] [Google Scholar]