Abstract
Polychlorinated biphenyls (PCBs) have been suspected for some time of having adverse effects on neuropsychological functioning in humans. While there is evidence of slowing of cognitive function in children associated with exposure to PCBs, the evidence of comparable effects on adults is far less well understood. We report here on the neuropsychological evaluation of 277 Native American adults, ranging in age from 18 -79, who were exposed to PCBs by way of environmental contamination in the St. Lawrence region of upstate New York. PCB body burden was estimated by 101 PCB congeners and neuropsychological functioning was assessed by a battery of 18 tests. Spline regression models were fitted to the latent variables of memory, motor function, and higher-order executive functioning. After adjusting for age, gender, and education the analyses revealed a threshold effect of PCBs at approximately 2 ppb. An age-by-PCB interaction effect was also observed for several variables which suggests that the threshold effect was largely confined to the age range of 40-79 and was not observable in the 18-40 year old group. Implications of these results are discussed in comparison to previously published similar work with adults and in terms of its potential clinical meaningfulness.
Keywords: polychlorinated biphenyls, neuropsychological tests, cognition, memory, executive functioning
Negative human health effects that are predicted to derive from occupational and environmental exposure to polychlorinated biphenyls (PCBs) have been difficult to establish in a clear and replicable fashion (ATSDR, 2005; EPA, 2006; Brown, 1986; Kimbrough, 1995; Carpenter, 2006) despite the considerable laboratory evidence of their harmful effects (Seegal, 2001, Seegal et al., 1991). The failure to document pervasive negative effects of PCBs on health status has been especially notable when the targeted outcome variables have been cognitive, psychological, and neuropsychological functioning. With the exception of the impact of exposure to PCBs on developing infants and children (Jacobson & Jacobson, 1992, 1996; Jacobson et al. 1997; Fitzgerald et al., 1998; Schantz et al., 2004), which is not without its critics (Cicchetti, Kaufman & Sparrow, 2004), the evidence is mixed with respect to deleterious effects of PCBs on adult human health (ATSDR, 2000). Within the domain of adult human effects the study of neurological and neuropsychological sequelae due to exposure to PCBs has received very limited attention. In one of the few published accounts of neuropsychological functioning among adults Shantz et al. (2001) showed no differences in motor function between 50-90 year old fish eaters and non-fish eaters in the Great Lakes Fish Eaters Cohort Study after adjusting for age, gender, and other known confounds for the PCB-motor behavior relationship. In a later study of memory and learning among this same cohort of 188 participants the authors (Schantz et al., 2002) found limited evidence of the effect of PCBs on memory and learning. In that 2002 study, 3 of 48 analyses showed significant, biologically plausible relationships to PCBs or DDE. The significant results reported in that study just marginally exceed the expected number of significant relationships that might arise by chance (2.4). Replication of these suggestive findings on an independent sample of environmentally exposed adults would help to clarify the extent to which neuropsychological functioning of adults is susceptible to exposure to PCBs and certain pesticides (DDE, HCB, and Mirex).
In a recent similar study Fitzgerald et al. (2008) report on the neuropsychological status of 253 adults between the ages of 55-74 who live in the Hudson River (New York) region known to have been PCB contaminated. This group of individuals had serum PCB values ranging from 1 to 19.3 ppb with a median of 3.2 ppb. Analyses of 34 neuropsychological variables from clusters of memory, learning, motor, cognitive visual/spatial, affective, olfactory and executive functioning revealed two significant relationships to PCBs—the Trial 1 Score from the California Verbal Learning Test and the immediate visual recall subtest of the Wechsler Memory Scales. No significant relationships were detected with the remaining 32 tests of neuropsychological functioning.
In more recent work Lin et al. (2008) have shown significant neurocognitive deterioration in a heavily exposed cohort of individuals who are now over 60 years of age when compared to an age, sex, and neighborhood matched reference group. Lin et al. found statistically significant differences on the order of 1/4 to 2/3 of a standard deviation for females in the sample on a cluster of measures of memory, learning, and attention. No differences were observed on the males in the sample of 162 exposed individuals compared to the 151 reference group participants. It should be noted that the differences observed by Lin et al. are reported for a heavily exposed group of individuals with PCB/PCDF values ranging from a mean of 17.2 ppb for the lowest tertile to a mean of 194.5 ppb for the highest tertile. The Schantz et al. studies of Michigan fish eaters and the Fitzgerald et al. studies of Hudson River residents were based on PCB exposure values that were considerably lower than the Taiwanese sample of Lin et al. that resulted from dietary ingestion of contaminated cooking oil. The difference in the exposure levels may be related to the differential strength of the findings reported among these previous studies.
The present study provides an additional assessment of the relationship between PCBs and neuropsychological functioning through an extensive series of neuropsychological evaluations conducted on a Native American population of Mohawk people residing in upstate New York who have been environmentally exposed to PCBs and pesticides. The Akwesasne Mohawk are a Native American community of approximately 12,000 individuals residing on property that spans the St. Lawrence river and occupies lands in both upstate New York and the Canadian provinces of Quebec and Ontario. The Akwesasne reservation is adjacent to a U.S. federal Superfund site, and immediately downriver from two New York Superfund sites. PCBs discharged from three industrial sites contaminated the St. Lawrence River and three of its tributaries. The level of PCB contamination that resulted from these industrial sites has been thoroughly described elsewhere (Akwesasne Task Force on the Environment, 1997; DiCaprio et al., 2005; Fitzgerald et al., 1998, Hwang et al., 2001; Santiago-Rivera, Morse, Hunt & Lickers, 1998; Schell & Tarbell, 1998) and is known to have affected fish, wildlife, agricultural crops from local soil, and ambient air. The Akwesasne community has historically depended upon fish from the local rivers, waterfowl, and mammals as primary sources of protein and as a substantial part of the local economy. The production of PCBs was banned in the US in 1977, and advisories against eating locally caught fish were imposed by the New York State Health Department in the 1980s (NYSDOH, 2002). Nonetheless the Mohawk people are known to have elevated levels of serum PCBs, averaging approximately 4 ppb (ng/g) among 753 adults (range: 0.29 – 48.32 ppb (ng/g)). Among the 336 adults for whom neuropsychological and PCB data were available the median exposure was 2.25 ppb (range: .18 – 25.18 ppb) with some 5% of this group of adults having exposure levels > 10 ppb. The exposure level of this group is modest compared to occupational exposures (Gustavson & Hegstedt, 2006; Seegal et al., 1995; Safe, 1989), but still higher than background levels of 0.9 – 1.5 ppb for non-occupationally and non-environmentally exposed individuals (ATSDR, 2000). PCB levels among the Mohawk have been found to be diminishing but are still at levels of 2.8 ppb for men and 1.2 ppb for women (Fitzgerald et al., 2004). Despite these lower levels of current measured body burdens of PCBs there is still substantial concern among members of this community regarding any long term health effects that might have resulted from this contamination. What follows is the analysis of eight latent variable measures of neuropsychological functioning among the adult men and women of the Akwesasne Mohawk sample. The eight latent variables are subsumed under three domains: memory, motor, and executive functioning.
Materials and Methods
As part of a larger University at Albany Superfund Basic Research Program conducted from 1995 to 2000 (Akwesasne Task Force on the Environment, 1997), we evaluated 356 adults on a host of cognitive, emotional, psychological, and quality of life variables. Details of the assessment of the effect of PCB exposures on psychological distress and quality of life have been reported elsewhere (Santiago-Rivera et al., 2007). Briefly, PCBs were found to have virtually no relationship to 10 indicators of psychological distress or several measures of job, family and personal quality of life. From those results, we have inferred that the psychological quality of the lives of the adult members of this community has not been adversely influenced by body burdens of PCBs. On the other hand, neuropsychological functioning, which includes learning and memory, motor behavior, and higher order executive functioning are likely to be highly dependent on the integrity of brain function and the pathways by which these variables might be affected by PCBs are quite different from the social-psychological variables previously reported for this population.
Participants
The characteristics and random sampling plan of the 353 participants in this study has been described elsewhere (Santiago-Rivera et al., 2007; Schell, Hubicki, DeCaprio, et al., 2003). The sample included 113 adult male (32%) and 240 adult female participants who ranged in age from 17 to 79 with a mean age of 38 (SD = 13.3). Marital status, employment, religious affiliation, and other demographic characteristics showed no unusual patterns when compared to the larger Akwesasne community. The demographic characteristics of this sample of adults are presented in subsequent sections and are also described in detail in Santiago-Rivera et al. (2007).
Blood samples for chemical analysis were provided by each participant and analyzed by dual column gas chromatographic methods as described in greater detail in DeCaprio, et al., (2004). Briefly, 91 analytic peaks, representing a total of 100 PCB congeners, were analyzed. Method detection limits (MDL) ranged from .01 to .04. Total PCB levels were calculated as the sum of all PCB congeners that were above the MDL.
Neuropsychological Measures
The neuropsychological tests used in this study were selected by consideration of three primary factors: (1) their known functional sensitivity to changes in the dopamine system and its pathways in humans; (2) minimal cultural bias and; (3) established validity and reliability in both clinical and research settings (Lezak, Howieson, & Loring, 2004). The 18 neuropsychological measures reported here were drawn from a larger battery of instruments administered to the adult Mohawk in this sample. The 18 measures are represented by one of three theoretically defined clusters: memory, motor, and executive functioning variable groupings. Each of these clusters is represented by one or more latent variables (Bollen, 1989) in the analyses that follow.
Motor Functioning Domain
Three tests of motor functioning were utilized: (1) the Grooved Pegboard Test (Klove, 1963), the Finger Tapping Test (Reitan & Wolfson, 1979) and the Static Motor Steadiness Test (Lafayette Instruments, 2004). The Grooved Pegboard Test requires the participant to insert identically keyed pegs into a board containing an array of 25 slotted holes first with their dominant hand and then their non-dominant hand. The score is the time to completion for each hand. The Finger Tapping Test is a subtest from the Halstead-Reitan Neuropsychological Test Battery for Adults that is used to provide information regarding the functioning of the contralateral hemisphere to the hand being tested. It is also sensitive to the presence of any peripheral dysfunction (e.g., neuropathy). The Finger Tapping Test requires the participant to tap a key with the index finger beginning with their dominant hand for a total of five consecutive trails with the range of scores being no greater than 5. This procedure is then repeated with non-dominant hand. The score is the average number of taps for each hand. The Static Motor Steadiness Test requires the participant to hold a metal stylus (0.0625 inches in diameter) in each of three holes of decreasing diameters (1.125, 0.312 and 0.109 inches) for 15 seconds beginning with their dominant hand and then their non-dominant hand. The scores are the total time the stylus is in contact with the side of each of the holes and the number times the stylus comes in contact with the side of each hole for both the dominant and non-dominant hands.
Memory Domain
The Wechsler Memory Scale (WMS; Wechsler, 1945) Form I-Russell's Revision (Russell, 1975) was used to assess logical (verbal) and figural (visual) memory for both immediate and delayed recall. Two latent variables whose existence was confirmed by principal components analysis were constructed: logical and figural memory. Each of these two latent variables was defined by their respective measured indicators of immediate and delayed recall. The WMS consists of two short stories each read and recalled separately. This is followed by the presentation of three geometric designs each presented and recalled separately (Wechsler, 1945). After a 30 minute delay (Russell's Revision), the participant is asked to recall all that he/she can about the two stories and the three geometric designs The logical and figural memory subtests of the WMS (Wechsler, 1945) have routinely been utilized in the assessment of memory functioning in clinical research (Lezak, Howieson, & Loring, 2004).
Executive Functioning Domain
Executive functioning was assessed to evaluate the higher order conceptual and organizational thought processes of the participants. Measures of executive functioning are considered to be governed by the frontal lobe functional system and are considered to be good measures of planning, organization, foresight, and mental and behavioral control. Three tests of executive functioning were included: the Wisconsin Card Sorting Test (WCST: Heaton, 1981), the Stroop Color and Word Test (SCWT: Treverry et al., 1994), and the Trail Making Test – Parts A & B (TMT: Reitan & Wolfson, 1985).
The TMT consists of a set of 26 letters A-L and the numerals 1-13. In Part A of the TMT the individual is asked to connect the letters A→B→C→….L as quickly as possible. In Part B of the TMT the individual is asked to begin with the numeral 1 and to connect the numerals and letters in sequence by the pattern 1→A→2→B→ …. →13→L as quickly as possible. The TMT is the oldest of a class of tests that assess attention, speed and mental flexibility (Strauss, Sherman and Spreen, 2006).
The SCWT assesses the ease with which a subject can maintain a goal response while being able to suppress a habitual response in favor of a less familiar response (Strauss, Sherman and Spreen, 2006). First, the participant reads aloud a list of color names printed in black and white ink. This is followed by naming aloud a list of colored X's printed in red, blue or green ink. Finally, the participant is asked to name the color of ink that the word is printed on; however, the color of the ink and the name for the color do not coincide. Each list is scored for the total number of correct responses within separate 45 second trials.
The WCST is a test that requires the participant to form abstract concepts, to shift set and maintain set in response to feedback from the examiner (Strauss, Sherman and Spreen, 2006). The WCST is made up of cards which contain various shapes in various colors and numbers of shapes on each of the cards. The participant must deduce the sorting rule using the color, form and number of symbols on each card with feedback from the examiner regarding whether the participant is correct or incorrect. After the first criterion set is met, the examiner shifts the “correct” set to another category without informing the participant. Once the criteria for the second set is met the examiner then shifts to the third set. The test continues for a total of six sets or until discontinuation criteria are met. There are multiple dependent variables that can be scored from the results of the WCST. In the present study, the construct of executive functioning was represented by three latent variables, two of which (SCWT and WCST) were documented by three measured indicators and the Trail Making Test (TMT) was defined by two measured indicator variables (Bollen, 1989; Joreskog & Sorbom, 1993). The latent variable of the SCWT included the color, word, and color/word identification scores, the latent variable of the WCST was the defined by the number of errors, the number of trials to completion, and the number of perseverative errors, and the TMT was documented by Parts A and B of the test.
Statistical Analyses
Statistical analyses for this project included descriptive analysis of the demographics of the sample and of all the measured independent and dependent variables included in the project. Inferential tests of hypotheses were accomplished by multivariate regression analysis on latent variables (e.g., structural equation modeling; Bollen, 1989). A-priori theoretical knowledge about the dimensional structure of the 18 single-indicator neuropsychological variables described above suggests that three classes of latent variables would suffice to capture the variability among these 18 indicators; each class containing either two or three correlated latent variables. As such, three separate multivariate path-analytic regression models were used to test the relationship between PCBs and the latent variables of (1) memory (two latent variables), (2) motor (three latent variables), and (3) executive functioning (three latent variables). The underlying factor structure of these 18 measured indicators was initially verified by means of principal components analysis of the 18 × 18 correlation matrix of the indicators (Jolliffe, 1986). In so far as we anticipated 8 unique entities, we extracted 8 principal components followed by Varimax rotation. We initially assessed the relationships between total PCBs and each of the 8 principal components graphically by means of parametric bivariate scatterplots and by nonparametric LOESS smoother plots (Cleveland, 1979; Hastie & Tibshirani, 1990). The main inferential analyses of the relationship between PCBs and the neuropsychological status variables were conducted by fitting multivariate path analytic regression models on latent variables (structural equation models; Bollen, 1989; Joreskog & Sorbom, 1993). The latent variables for each cluster (memory, motor and executive functioning) were regressed on total PCBs and adjusted for potential confounders.
Based on the observation of certain obvious nonlinearities in the PCB-latent variable scatterplots, the multivariate structural equation models (SEM; Bollen, 1989; Joreskog and Sorbom, 1993; Muthen, 1992) were analyzed as spline regression models (Darlington, 1990; Marsh & Cormier, 2002; Smith, 1979) of PCBs to the latent variables of memory, motor behavior, and executive functioning. Spline regression models were employed to test the significance of an observed change in the slope (e.g., a threshold) of the PCB-to-latent variable relationship observed in several LOESS plots. All multivariate structural models were fitted by maximum likelihood estimation in LISREL 8.8 (Joreskog and Sorbom, 1993) in which the models are defined by an a-priori path analytic regression structure. These models were fitted separately to each of the three groups of latent variables of memory, motor, and executive functioning while adjusting for age, gender, and education.1
In addition to the main effect relationship of PCBs to these latent variables, we were also evaluated the age-by-PCB interaction that might be observed based on the hypothesis that the normal age-related deterioration of cognitive and motor function may be exacerbated by the exposure to PCBs. All statistical analyses reported herein were computed by either SPSS Version 15 (SPSS, 2006) or LISREL 8.8 (Joreskog & Sorbom, 1993).
All 18 single indicator variables were analyzed in raw score form. Log transformations were applied to achieve greater symmetry on those variables that were positively skewed (e.g., total PCBs). Because decisions regarding the sequence of statistical analyses were dependent on the outcomes at each stage, we present additional technical details of the analyses and the obtained results in that format.
Results
Descriptive Statistics
A total of 336 individuals provided data for this study. Because not all individuals provided complete responses to all variables, the effective sample sizes for each analysis reported below ranged from 275 to 283 depending on the number of cases with complete data for each of the of the latent variable analyses. Means and standard deviations of the 18 neuropsychological variables from the memory, motor, and executive functioning categories, the potential confounders of age, gender, and education, and the measure of PCBs are summarized in Table 1.
Table 1.
Descriptive Statistics of the Sample Demographic Characteristics, 18 Measured Indictors, and Total PCBs
| Variable | Mean or % | Standard Deviation (range) |
N |
|---|---|---|---|
| Age | 38 | 12.98 (18 – 79) | 283 |
| Gender (female) | 67% | -- | 283 |
| Education | 12.6 | 2.86 (12 - 22) | 283 |
| BMI | 34.7 | 7.65 (18.8 – 85.3) | 283 |
| Cholesterol | 191.4 | 39.16 (105 – 410) | 283 |
| Triglycerides | 143.8 | 89.41 (30 – 581) | 283 |
| Employed | 283 | ||
| Full Time | 41.4% | -- | |
| Part Time | 13.9% | -- | |
| Unemployed | 40.7% | -- | |
| Retired | 6.0% | -- | |
| Marital Status | |||
| Married | 46.6% | -- | 283 |
| Single | 24.8% | -- | |
| Divorced | 11.2% | -- | |
| Widowed | 3.8% | -- | |
| Other | 13.6% | -- | |
| Total PCBs | 3.56 | 3.63 | 283 |
| Stroop Word | 93.29 | 23.73 | 276 |
| Stroop Color | 70.64 | 19.65 | 276 |
| Stroop Color/Word | 40.43 | 17.38 | 276 |
| WCST Trials | 94.11 | 27.27 | 276 |
| WCST Errors | 36.67 | 24.57 | 276 |
| WCST Peseverative Errors | 16.72 | 12.33 | 276 |
| Trail Making Test – Part A | 26.40 | 11.40 | 276 |
| Trail Making Test – Part B | 63.24 | 25.79 | 276 |
| Figural Memory – Immediate | 9.96 | 3.21 | 277 |
| Figural Memory – Delayed | 8.57 | 3.56 | 277 |
| Logical Memory – Immediate | 10.78 | 4.63 | 277 |
| Logical Memory – Delayed | 8.14 | 4.34 | 277 |
| Grooved Pegboard – Dominant | 71.98 | 23.23 | 283 |
| Grooved Pegboard - Nondominant | 75.40 | 16.09 | 283 |
| Finger Tapping – Left | 49.50 | 23.71 | 283 |
| Finger Tapping – Right | 54.04 | 22.51 | 283 |
| Motor Steadiness – Dominant | 133.68 | 53.87 | 283 |
| Motor Steadiness - Nondominant | 148.58 | 57.92 | 283 |
Note: Sample sizes based on complete data vary between analyses. The sample size on which each latent variable analysis was performed is reported for the measured indicator variables. The descriptive statistics for the PCBs, age, gender, and education are reported for the largest sample size used and differ by very small amounts across the three structural models on latent variables.
The raw score value of total PCBs was log transformed to achieve greater symmetry. Examination of the distributional characteristics of the neuropsychological variables revealed that they were all in the clinically normal ranges to be expected of a population with an age range of 17-79. No unusual or outlying cases were identified on any of the study variables. Several variables were skewed and were log transformed prior to analysis—Total PCBs, grooved pegboard for dominant and nondominant hands, and finger tapping (left and right hands). The remaining variables were sufficiently symmetric and close enough to normal distributional expectations, as assessed by normal probability plots, such that they required no transformation.
The Principal Component Latent Variable Structure of the Neuropsychological Assessments
The 18 variables of this study were chosen to represent three theoretically distinct clusters of neuropsychological functioning: memory, motor behavior, and executive functioning. We performed an initial exploratory principal components analysis (PCA; Jolliffe, 1986) with Varimax rotation on these 18 neuropsychological variables. The PCA yielded 7 eigenvalues greater than 1.0 and an 8th eignevalue of .78 which was retained because it accounted for about 5% of the total variance and was clearly interpretable. The set of 8 principal components accounted for 84.1% of the variance in the 18 × 18 correlation matrix. The proportion of the rotated total variance extracted by 8 principal components ranges from a 13.7% to 7.6%. Each of the components is distinct and interpretable and the factor loadings have been summarized in Table 2.
Table 2.
Varimax Rotated Principal Components Factor Loadings of the 18 Neuropsychological Measured Variables
| Measured Variable | 1 WCST |
2 STROOP |
3 WMS-L |
5 WMS-F |
4 FTP |
6 MST |
7 GPB |
8 TMT |
|---|---|---|---|---|---|---|---|---|
| WMS Visual Immediate Recall | -.170 | .075 | .078 | .897 | .084 | .048 | -.148 | -.069 |
| WMS Visual Delayed Recall | -.112 | .132 | .213 | .887 | .008 | -.016 | -.084 | -.111 |
| WMS Verbal Immediate Recall | -.025 | .093 | .935 | .137 | -.049 | .000 | -.104 | -.081 |
| WMS Verbal Delayed Recall | -.082 | .101 | .931 | .130 | .004 | .000 | -.108 | -.093 |
| Grooved Pegboard-Dominant | -.033 | -.137 | -.154 | -.081 | -.095 | -.010 | .832 | .130 |
| Grooved Pegboard-Nondominant | .051 | -.147 | -.057 | -.143 | .011 | .006 | .825 | .181 |
| Finger Tapping-Dominant | -.048 | .163 | -.003 | .031 | .932 | .079 | -.013 | -.018 |
| Finger Tapping-Nondominant | .011 | .123 | -.039 | .050 | .943 | -.024 | -.067 | -.005 |
| Motor Steadiness-Dominant | .002 | -.004 | -.014 | .015 | .023 | .938 | -.011 | -.018 |
| Motor Steadiness-Nondominant | -.047 | -.053 | .013 | .014 | .028 | .929 | .007 | .073 |
| Trail Making Test – Part A | .088 | -.078 | -.170 | -.026 | -.042 | .065 | .190 | .891 |
| Trail Making Test – Part B | .115 | -.364 | -.010 | -.317 | .033 | -.009 | .241 | .645 |
| Stroop Word | -.053 | .820 | .107 | .078 | .111 | -.045 | -.047 | -.152 |
| Stroop Color | -.072 | .865 | .055 | .056 | .189 | -.008 | -.087 | -.139 |
| Stroop Color-Word | -.091 | .855 | .054 | .086 | .035 | -.013 | -.182 | .014 |
| WCST - # Trials | .891 | -.071 | -.073 | -.004 | -.026 | -.084 | -.079 | -.038 |
| WCST - # Errors | .894 | -.071 | -.024 | -.193 | -.027 | -.002 | -.170 | .075 |
| WCST – Perseverative Errors | .879 | -.074 | -.019 | -.105 | .011 | .036 | -.112 | .132 |
Note: WCST = Wisconsin Card Sort Test, STROOP = Stroop Color-Word Test, WMS-L = Wechlser Memory Scale-Logical (verbal), WMS-F = Wechsler Memory Scale-Figural (Visual), MST = Motor Steadiness Test; GPB = Grooved Pegboard Test; TMT = Trail Making Test
The Varimax rotated factor loadings are exceptionally clear for each of the underlying latent variables. The factor loadings for verbal memory (immediate and delayed), visual memory (immediate and delayed), grooved pegboard (dominant and nondominant hands), finger tapping (left and right hands), motor steadiness (dominant and nondominant hands), trail making test (parts A and B), Stroop Color Word Test (colors, words, and color/words), and the Wisconsin Card Sort Test (trials, errors, and perseverative errors) are all in excess of .82 with 17 of the 18 loadings in excess of .86, and 7 of the 18 loadings in excess of .90.
Theoretically, these 8 factors can be clustered into 3 groupings: motor behavior (grooved pegboard, finger tapping and motor steadiness), memory (immediate and delayed recall of both visual and verbal memory), and executive functioning (Stroop, Wisconsin, and Trail Making Test).2
Employing these higher order clusters of latent variables of memory, motor, and executive functioning, rather than focusing on individual measured indicators, provides a method that helps to control the excessive experimentwise Type I error rates (Kirk, 1992; Miller, 1986) that would result if data were analyzed separately for each of the 18 measured indicators. In addition to adding control over experimentwise error rates, the use of latent variables is advantageous in that the correlations among latent variables are disattenuated (e.g., free of measurement error and of perfect reliability) since the error structure of the measures constitutes a separate aspect of the modeling process (Muthen, 1992). Similarly, correlations and/or regression coefficients between measured indicators (e.g., age) and latent variables are partially disattenuated. As such test statistics in path analytic regression models are more sensitive and have greater statistical power (Cohen, 1988; Muthen, 1992).
LOESS Bivariate Scatterplots
We started the analyses of these data from the initial assumption that the relationship between PCBs (log transformed) and the neuropsychological outcome variables would be linear in form. In order to graphically assess this assumption, we fitted both bivariate linear regression plots (SPSS, 2006) and locally weighted error sums of squares (LOESS) smoothed plots to the data (Cleveland, 1979; Hastie & Tibshirani, 1990). To construct these plots of PCB-to-neuropsychological variable relationships we constructed factor scores from the principal components analysis for the 8 latent variables within the three clusters of memory, motor behavior, and executive functioning. We were surprised to observe that the form of the relationship between each of the 8 latent variables and PCB exposure was distinctly nonlinear. The LOESS scatterplots of PCBs to the 8 latent variables have been presented in Figure 1.
Figure 1.
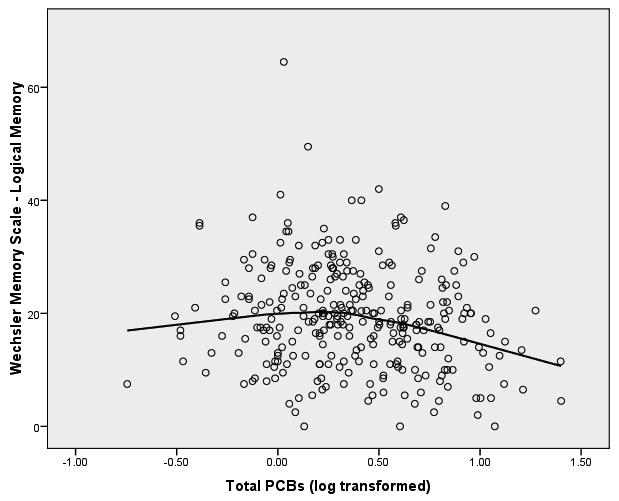
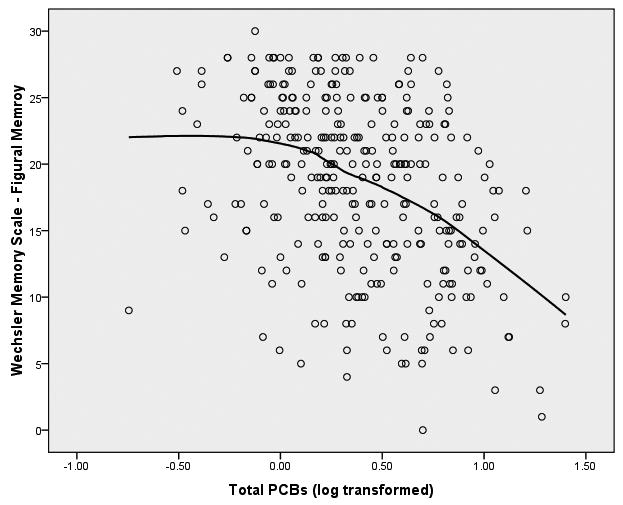
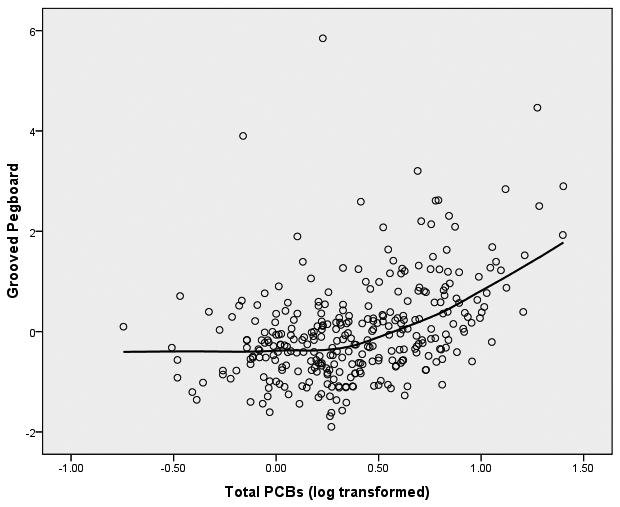
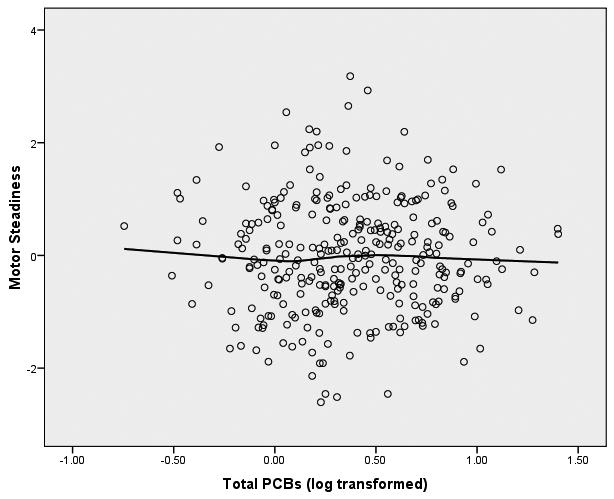
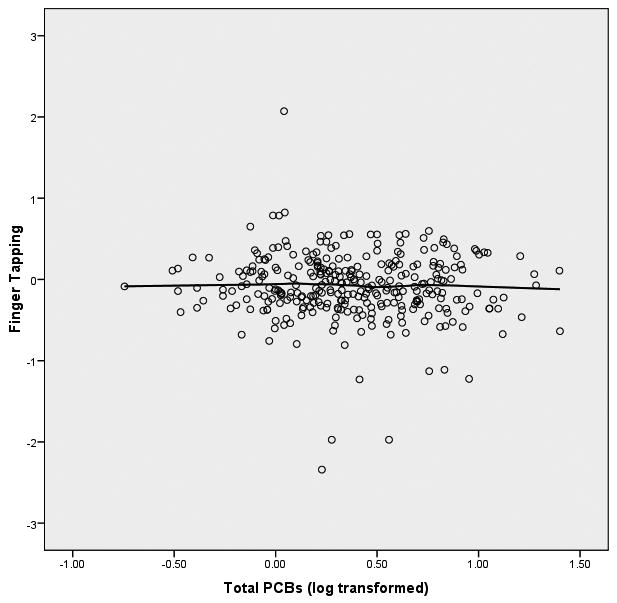
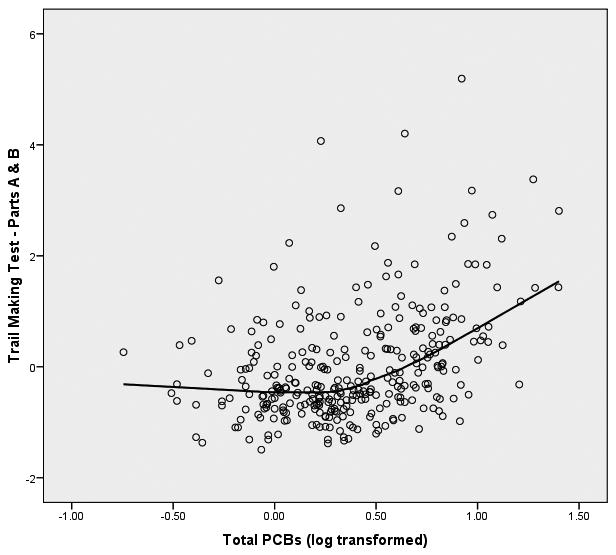
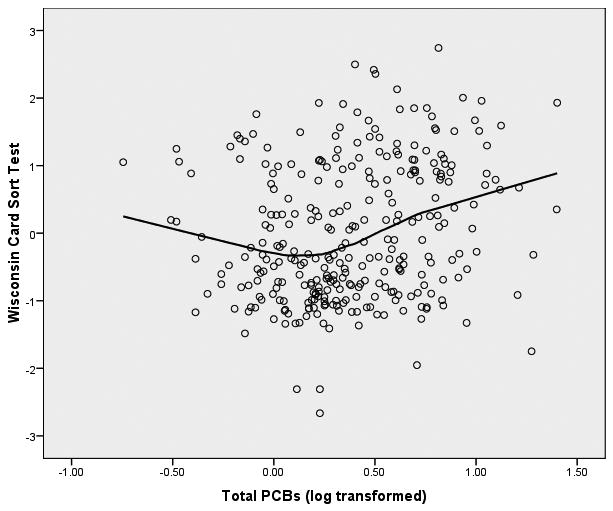
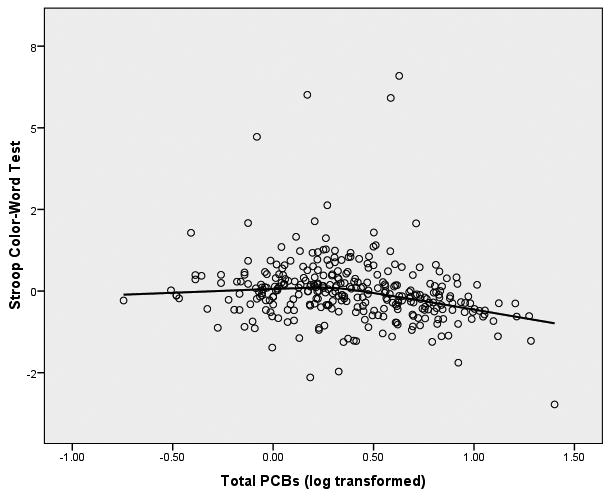
LOESS Plots of Total PCBs to 8 Latent Variables of Neuropsychological Functioning
Figure 1(a) Total PCBs and Memory
Figure 1(b) Total PCBs and Motor Behavior
Figure 1(a) Total PCBs and Executive Functioning
It is apparent from these LOESS plots that a strictly linear model would fail to capture the nature of the relationship between PCBs and most of these measures of neuropsychological functioning. Examination of the plots suggests that for most of the plots there is an inflection point that hovers around 0.3 to 0.5 on the PCB logarithm scale which is equivalent to approximately 2-3 ppb in original PCB units.3 Examination of the LOESS plots suggests that between 0 ppb and approximately 2 ppb there is little, if any, relationship between PCBs and the majority of the neuropsychological latent variables. However, between 2 ppb and the maximum of the PCB scale in this sample (25 ppb in this sample) there is a noticeable acceleration (or deceleration) in the PCB-to-neuropsychological performance relationship. It appears from these LOESS plots that there is a threshold effect of PCBs on neuropsychological status, and this pattern seems to replicate across clusters of latent variables. To test this proposition, we fitted multivariate spline regression models (Darlington, 1990; Marsh & Cormier, 2002; Smith, 1979) to the latent variables of each of the three clusters of memory, motor behavior, and executive functioning. Structural equation modeling (SEM; Bollen, 1989, Joreskog & Sorbom, 1993) was used to perform the analyses. We chose to replicate the SEM models independently for each cluster of latent variables to enhance the clarity of the presentation. In so doing we recognize the potential increase in Type I errors, but considered this risk to be tolerable to achieve the first goal.
Spline Regression Models on Latent Variables
Tests of hypotheses about a threshold effect were conducted separately for the executive functioning, memory, and motor behavior clusters of variables. Spline regression models are statistical models that can be fitted to the relationship between two variables in such a way as to allow the regression line to take different slopes at predefined points on the X-axis. Fitting a spline regression model requires setting a joint (or knot) at each of the inflection points observed on a two dimensional scatterplot, creating a quasi-dummy coded spline predictor variable at each defined joint, and then fitting two or more piecewise regression models within the full range of the predictor variables. Details of fitting spline regression models can be found in Darlington (1990), Marsh and Cormier (2002), and Smith (1979). In the present study we fitted spline regression models to latent variables executive functioning, motor functioning, and memory clusters of latent variables. The LOESS scatterplots suggested that 2 ppb is near the joint of the function for each of the latent variable models and the joint of the spline regressions were set to the log of 2 ppb (= .3 log PCB) for all of the spline analyses reported below.
In addition to the spline model fitted across the full range of the PCB predictor variable it is clear in these data that age and PCBs are significantly associated (r = .742, p < .0001) which suggests that the nonlinear threshold observed in these data may well be a function of age as well as PCBs. The case has been made elsewhere (Goncherov et al., 2008) that age should not be treated strictly as a confounder of PCBs in these analyses. Age is known to embody both chronological and biological mechanisms (Antsey & Smith, 1999; Baltes & Lindenberger, 1999). The variability in PCBs that is associated with age in this study has mostly to do with the fact that chronological age is a proxy for the passage of time, and thereby documents the length of environmental exposure to PCBs which in turn dictates an individual's body burden of PCBs. As such, age should not be adjusted (i.e., eliminated) in these analyses, but should be studied by way of its interactive, moderating, or associational influence on the effect of PCBs and the outcome variables of interest (Cohen et al., 2003; Rothman and Greenland, 1998).4 In order to test these speculations, we followed up the main effect spline models with multivariate tests (Anderson, 2001) of the age × PCB interaction effect within each cluster of latent dependent variables (i.e., executive functioning, motor functioning, and memory). If the interaction effect was statistically significant at p < .05, the simple main effects within younger and older age groups were investigated for both linear and nonlinear spline effects. LOESS plots were used to further examine the nature of any significant interaction or significant simple main effect for the linear and spline effects within age groups. The results are presented in sequence for the executive functioning, memory and motor clusters of neuropsychological functioning.
SEM Spline Model for Executive Functioning Latent Variables
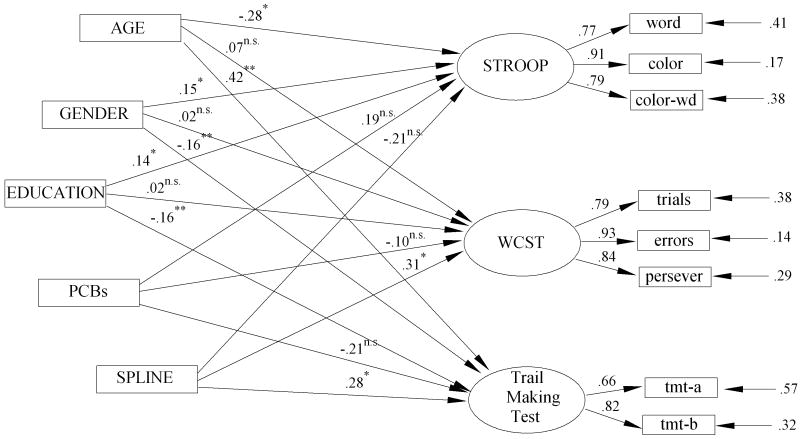
The fitted spline model to the WCST, SCWT, and TMT latent variables of the executive functioning cluster is shown in Figure 2. Three models were estimated: (a) a model that employs only the covariates (M1), (b) a model that employs the covariates plus the linear PCB predictor (M2), and (c) a spline model that employs the covariates, the linear PCB predictor, and the spline at joint of 0.3 log PCB (M3). The SEM statistics for these three models were estimated by the method of maximum likelihood implemented in LISREL 8.8 (Joreskog & Sorbom, 1993). Results are presented in Table 3 and the fitted full model is shown in Figure 2.
Figure 2.
SEM Spline Model of PCBs and Covariates to Executive Functioning Latent Variables
Table 3.
Model Fit of Three Structural Equation Models of Covariates, PCBs, and Splines for Executive Functioning Latent Variables
| Model | χ2 | df | p | CFI | NNFI | RMSEA | pclose fit | SRMSR |
|---|---|---|---|---|---|---|---|---|
| M1: Covariates Only | 128.02 | 51 | <.001 | .963 | .943 | .074 | .008 | .065 |
| M2: Covariates + PCBs | 125.54 | 48 | <.001 | .963 | .940 | .077 | .004 | .063 |
| M3: Covariates + PCBs + Spline | 111.79 | 45 | <.001 | .967 | .943 | .073 | .013 | .059 |
Note: N=276
Although it is not a goal of this research to find the best fitting theoretical model of executive functioning, the goodness of fit statistics for the covariates+PCB+spline model to the executive functioning data is reasonably good (χ2(45) = 111.79, p = .001, χ2/df = 2.5, CFI = .967, NNFI = .943, RMSEA = .073, SRMR = .059). The statistical tests of far greater interest, however, are (a) the test of the incremental fit of the linear + covariates PCB model over the model including only the covariates of age, gender, and education (M2 vs. M1), (b) the incremental fit of the linear+spline model over the fit of the covariates only (M3 vs. M1), and (3) the fit of the full spline model (i.e., linear + spline vector) over the linear model of PCBs and the covariates (M3 vs. M2). The test of hypotheses associated with these incremental χ2 difference tests are summarized in Table 4.
Table 4.
Comparative Tests of Models of the Executive Functioning Latent Variables
| Model Comparison | Δχ2 | df | p |
|---|---|---|---|
| M2 vs M1: PCBs adjusted for Covariates | 2.52 | 3 | .472 |
| M3 vs. M1: PCBs + Splines adjusted for covariates | 16.42 | 6 | .012 |
| M3 vs. M2: 2nd Spline slope > 1st Spline slope | 13.90 | 3 | .003 |
Note: M1 = covariates only, M2 = covariates + PCBs, M3 = covariates + PCBs + spline.
The simple linear predictor of exposure to PCBs does not add significantly to the prediction of executive functioning beyond what can already be accounted for by age, gender, and education (Δ χ2(3) = 2.48, p = .470)—the covariate adjusted linear effect of PCBs is not significantly related to the latent variables of executive functioning. However, the full nonlinear spline model shows a statistically significant increment over the model that includes only the covariates (Δ χ2(6) = 16.23, p = .011)—PCBs modeled as a threshold effect account for a significant proportion of variance in the executive functioning after adjusting for age, gender and education. The joint of the spline model at 0.3 log(PCB), which is about 2 ppb, also allows for a test of the differences between the slope of PC→executive functioning relationship between 0 and 2 ppb, and the slope of the PC→executive functioning relationship between 2 and 32 ppb. The chi-squared difference test between the two slopes is statistically significant (Δ χ2(3) = 13.75, p = .003). Moreover, the linear path coefficients for PCBs between 0-2 ppb on the SCWT (b = .19, T = 1.30, p > .05) and the WCST (b = -.10, T = -.67, p > .05) latent variables do not differ significantly from zero, but the path to TMT does differ from zero (b = -.21, T = -1.99, p < .05). The path coefficients for the spline (a test of the difference between the 0-2 ppb slope and the 2.01-25 slope) are significant for the WCST (b = .31, T = 2.12, p < .05) and the Trail Making (b = .31, T = 2.50, p < .05), but the spline path is not significantly different from the linear path for the SCWT (b = -.21, T = -1.45, p > .05).
The evidence of these analyses clearly suggests that there is a threshold effect of PCBs on the constructs of cognitive flexibility and perceptual/behavioral adaptability that are assessed by these measures of executive functioning. At 2 ppb there is a significant shift in the effect of PCBs on executive functioning—between 0 and 2 ppb PCBs show virtually no effect on executive functioning, but after 2 ppb the executive functioning latent variables are seen to show significant deterioration of cognitive flexibility with increasing levels of PCBs. The graphic display of this threshold for the executive functioning variables can be seen Figure 1 (c).
It is possible that the threshold effect we observed above is as much due to age as to PCBs, since the two variables are so highly associated (r = .742) and the chronological aspects of age are a proxy for exposure duration (Goncherov et al., 2008). We evaluated the hypothesis that the threshold effect observed above is modified by the age of the respondent. We performed a multivariate general linear model analysis to test the moderating effect of age on the PCB-to-outcome variable relationship the optimal linear combinations of the TMT, the SCWT and the WCST. Only the TMT yielded a significant age × PCB interaction effect adjusted for gender and education (Pillai's Trace V = .066, approximate F(2, 290) = 10.30, p < .001). A follow up multivariate analysis estimating the linear fit of PCBs-to-TMT variables between 0 and 2 ppb, and the spline fit between 2.01 ppb and 25 ppb for age groups above and below the median age (36 years) showed that the neither the linear (Pilliai's Trace V = .013; approximate F(2, 288) = 1.94, p = .15) nor the spline model (Pilliai's Trace V = .009; approximate F(2, 288) = 1.37, p = .26) differed significantly from zero within the 18-36 year old age group. Within the 37-79 year old group, however, the linear model is significant and negative (Pilliai's Trace V = .021; approximate F(2, 288) = 3.06, p = .05) and the spline model is significantly positive (Pilliai's Trace V = .023; approximate F(2, 288) = 3.46, p = .03). As illustrated in Figure 3, there is a threshold effect of PCBs on the TMT at about 2 ppb for the 37-79 year old subjects beyond which significant deterioration in performance is observed (higher TMT scores indicate longer time to completion). The threshold effect of PCBs on the WCST was not dependent on age and there was no observed spline effect on the SCWT latent variable.
Figure 3.
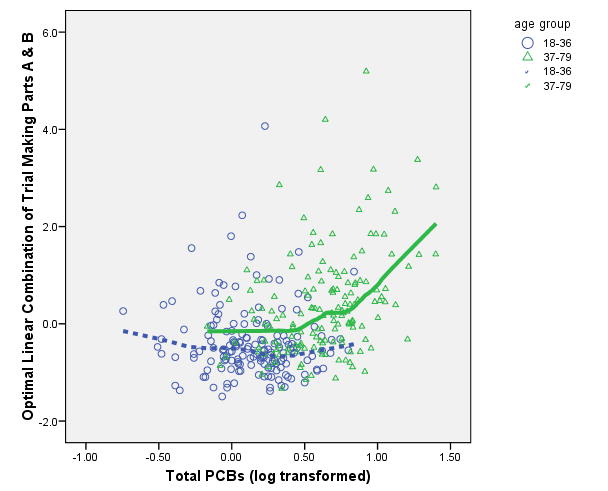
Threshold and Age × PCB Interaction for Trail Making Test
SEM Spline Model for Latent Variables of Memory
The SEM models fitted to the executive functioning variables described in previous paragraphs were duplicated for the two latent variables of memory: logical memory (documented by immediate and delayed recall of logical (verbal) material) and figural memory (as documented by immediate and delayed recall of figural (visual) material). The strategy for assessing the fit of the spline model to memory latent variables was identical to that described previously: the model with covariates only was fitted (M1), the model with the linear predictor of PCBs and the covariates was fitted (M2), followed by the full spline model that included covariates of age, gender, and education plus the linear and spline vectors required to specify the spline model. The goodness of fit statistics for the three models as well as the comparative tests of differences between models have been presented in Tables 5 and 6.
Table 5.
Model Fit of Three Structural Equation Models of Covariates, PCBs, and Splines for Memory Latent Variables
| Model | χ2 | df | p | CFI | NNFI | RMSEA | pclose fit | SRMSR |
|---|---|---|---|---|---|---|---|---|
| M1: Covariates Only | 45.33 | 17 | .0002 | .980 | .958 | .078 | .046 | .054 |
| M2: Covariates + PCBs | 39.05 | 15 | .0006 | .983 | .959 | .076 | .046 | .047 |
| M3: Covariates + PCBs + Spline | 34.16 | 13 | .0011 | .984 | .957 | .077 | .074 | .045 |
Note: N = 277
Table 6.
Comparative Tests of Models of the Memory Latent Variables
| Model Comparison | Δχ2 | df | p |
|---|---|---|---|
| M2 vs M1: PCBs adjusted for Covariates | 6.28 | 2 | .043 |
| M3 vs. M1: PCBs + Splines adjusted for covariates | 11.17 | 4 | .025 |
| M3 vs. M2: 2nd Spline slope > 1st Spline slope | 4.89 | 2 | .087 |
Note: M1 = covariates only, M2 = covariates + PCBs, M3 = covariates + PCBs + spline.
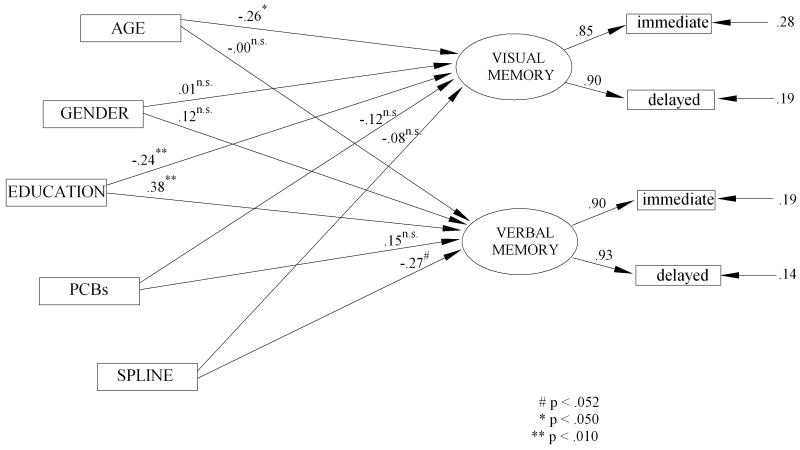
The graphic presentation of the fitted model with standardized parameter estimates is shown in Figure 4. The overall spline model fits the data quite well (χ2(13) = 34.16, p = .001, χ2/df = 2.6, CFI = .984, NNFI = .957, RMSEA = .074, p = 074, SRMR = .045). As in previous models the statistical tests of most interest are the tests of the incremental fit of the linear PCB model over the model including only the covariates of age, gender, and education (M2 vs. M1), the incremental fit of the spline model over the fit of the covariates only (M3 vs. M1), and the fit of the spline model over the linear model of PCBs and the covariates (M3 vs. M2). These incremental χ2 difference tests are summarized in Table 5. The fit of the full SEM model is displayed in Figure 4.
Figure 4.
SEM Spline Model of PCBs and Covariates to Memory Latent Variables
The simple linear model of exposure to PCBs does add significantly to the prediction of memory after adjusting for by age, gender, and education (Δ χ2(2) = 6.28, p = .043)—the covariate adjusted linear effect of PCBs is significantly related to deterioration of memory. In addition the nonlinear spline model (linear + spline) also shows a statistically significant increment over the model including only the covariates (Δ χ2(4) = 11.17, p = .025)—the threshold model of PCBs accounts for significant variance in executive functioning after adjusting for age, gender and education. As before, the joint of the spline at 0.3 log(PCB), which is about 2 ppb, allows for a test of the differences between the slope of PCB-executive functioning at 0-2 ppb, and the slope of the PCB-memory relationship at 2-25 ppb. The difference between the slopes before and after this joint is not significant at the .05 level of confidence (Δ χ2(2) = 4.89, p = .087) but does meet the more marginal criterion of p < .06. These findings can be clarified somewhat by examining the pattern of the path coefficients of the fitted model. The linear slopes between 0-2 ppb for both the logical memory (b = .15, T = 1.07, p > .05) and the figural memory (b = -.12, T = -.855, p > .05) latent variables do not differ significantly from zero. The difference between the slope at 0-2 ppb and the slope at 2.01-25 ppb is not significant for figural memory (b = -.27, T = -.61, p > .05), while the spline effect for logical memory is nearly significant at the .05 level of confidence (b = -.27, T = 1.94, p = .06). The strength of the spline model in the multivariate tests is probably due to the effect for logical memory. The net weight of the evidence suggests that there is a threshold effect of PCBs on the constructs of figural and logical memory—dominated largely by the logical memory. At 2 ppb there is a shift in the effect of PCBs on memory with memory deteriorating after the 2 ppb threshold. The analysis suggests that the effect for memory is of a lesser order of magnitude than was found for executive functioning.
To determine if the observed threshold effect might be dependent on age, a multivariate general linear model test of the age × PCB interaction, adjusting for gender and education, was conducted on the latent variables of logical and figural memory. No significant interaction effect was detected in this analysis (Pilliai's Trace V = .001; approximate F(2, 288) = .13, p = .88). The threshold effect of PCBs on logical memory is therefore not moderated by age.
SEM Spline Model for Latent Variables of Motor Functioning
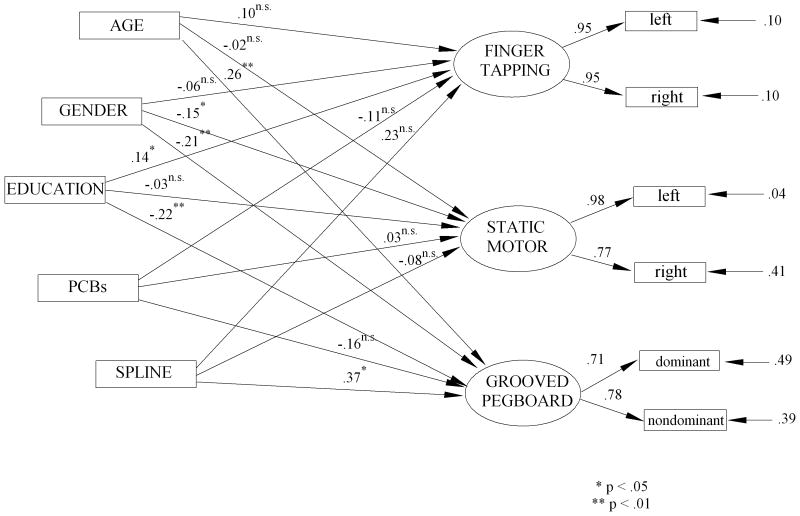
The final set of neuropsychological variables tested in this research were those of motor behavior consisting of the latent variables of performance on the grooved pegboard (GPB: dominant and nondominant hands), finger tapping (FTP: left and right hands), and Static Motor Steadiness (SMST: dominant and nondominant hands). As in previous models we evaluated three structural equation models: the model with covariates only (M1), the model with the linear predictor of PCBs and the covariates (M2), and spline model that included covariates of age, gender, and education plus the linear and spline vectors needed to define the spline model. The full spline model, whose graph with standardized path coefficients is presented in Figure 5, fits the data remarkably well (χ2(26) = 43.12, p = .019, χ2/df = 1.7, CFI = .989, NNFI = .976, RMSEA = .048, p = .513, SRMR = .031). However, the model that includes the linear effect of the PCBs and the covariates (M2 of Tables 7 and 8) is not a better fit to the data than the model (M1) of the covariates alone (Δ χ2(3) = 3.99, p = .263), nor is the full spline model (M3) a significant improvement over the covariates alone (Δ χ2(3) = 11.28, p = .080).
Figure 5.
SEM Spline Model of PCBs and Covariates to Executive Functioning Latent Variables
Table 7.
Model Fit of Three Structural Equation Models of Covariates, PCBs, and Splines for Motor Behavior Latent Variables
| Model | χ2 | df | p | CFI | NNFI | RMSEA | pclose fit | SRMSR |
|---|---|---|---|---|---|---|---|---|
| M1: Covariates Only | 54.40 | 32 | .008 | .983 | .972 | .050 | .477 | .035 |
| M2: Covariates + PCBs | 50.41 | 29 | .008 | .984 | .970 | .051 | .439 | .030 |
| M3: Covariates + PCBs + Spline | 43.12 | 26 | .019 | .989 | .976 | .048 | .513 | .031 |
Note: N=283
Table 8.
Comparative Tests of Models of the Motor Behavior Latent Variables
| Model Comparison | Δχ2 | df | p |
|---|---|---|---|
| M2 vs M1: PCBs adjusted for Covariates | 3.99 | 3 | .263 |
| M3 vs. M1: PCBs + Splines adjusted for covariates | 11.28 | 6 | .080 |
| M3 vs. M2: 2nd Spline slope > 1st Spline slope | 7.29 | 3 | .063 |
Note: M1 = covariates only, M2 = covariates + PCBs, M3 = covariates + PCBs + spline.
The difference between the linear slope between 0-2 ppb and the linear slope between 2.01-25 ppb is a marginally significant difference (Δ χ2(3) = 7.29, p = .063). This marginal effect is seen to be reflective largely of the nonlinear relationship between the PCBs and the latent variable of performance on the grooved pegboard. As can be seen in Figure 5 the covariates of age, gender, and education are all significantly related to grooved pegboard (T's = 2.79, -3.12, -3.28, respectively; p's < .01). The linear path coefficient of the PCBs, adjusted for the covariates, is essentially flat and has no significant relationship to the grooved pegboard (T = -1.06, p > .05), while the spline path coefficient reveals that the slope of the relationship between 2.01 and 25 ppb differs significantly from the slope between 0 and 2 ppb (T = 2.48, p < .02). There is an identifiable threshold effect at about 2 ppb when considering the relationship between PCBs and grooved pegboard performance. No such relationship is observed for either the finger tapping or the Static Motor Steadiness latent variables.
The multivariate test of the age × PCB interaction on the latent variables of the grooved pegboard, finger tapping, and static motor steadiness latent variables yielded a significant effect (Pilliai's Trace V = .092; approximate F(3, 293) = 9.96, p <.001). The univariate follow-up tests on this interaction revealed that the grooved pegboard latent variable is the only latent variable of the three tested to show the PCB effect to be significantly moderated by age (F(1, 295) = 28.91; p < .0001). The linear and spline tests on these three latent variables within age groups revealed no linear or spline effect on the 18-36 year old age group. Furthermore the linear effect of the PCBs between 0 and 2 ppb for the 37-79 year old group did not differ significantly from zero, but the slope of the spline was found to be significantly positive relative to the linear slope (Pilliai's Trace V = .039; approximate F(3, 271) = 3.64, p < .01). This multivariate effect was almost completely determined by the grooved pegboard latent variable alone (F(1, 273) = 10.90, p < .001); the latent variables for finger tapping and static motor steadiness showed no such spline or linear effect within either age group. The nature of the threshold effect for the grooved pegboard latent variable for younger (18-36) and older (37-79) age groups is displayed in Figure 6.
Figure 6.
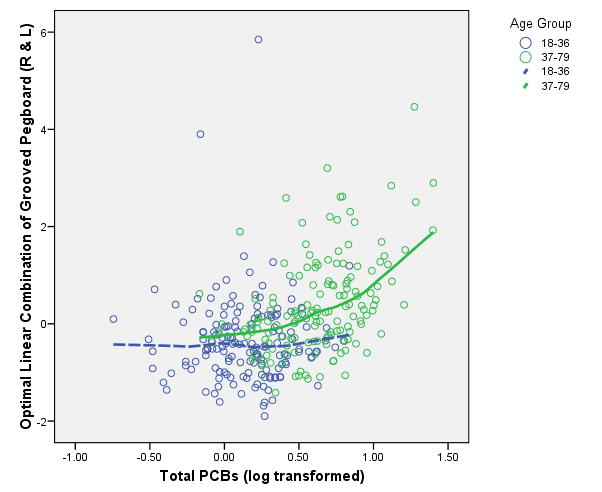
Threshold and Age × PCBs Interaction for Grooved Pegboard Latent Variable
Discussion and Conclusions
The results presented here add to a growing body of published research (Lin et al., 2008, Schantz et al., 1999, 2001, 2004) that suggests that some aspects of neuropsychological functioning in adults is significantly related to exposure to PCBs. We observed that PCBs, acquired from environmental contamination in our sample of Native Americans, are significantly related to outcome variables in the domains of executive functioning, motor functioning, and memory. One of the major features of our findings is the observation that for each of the significant effects we observed, there is clear evidence of a threshold of the effect of PCBs on the measured variables. Moreover, for a subset of these neuropsychological variables the threshold effect is effect modified by age—it appears only in the 37-79 year old group, while within the younger group of 18-36 year olds the PCBs show no discernable linear or threshold effect. The effect of a significant increment at a threshold of 2 ppb only among the older group of participants is slightly different than the effects of PCBs on cognitive functioning in an older population reported by Lin et al. (2008) who found significant effects only for females, but do not report an age-by-exposure test of interaction, nor do they report a threshold effect in their sample which was exposed well beyond most other epidemiological studies of PCBs and neurocognitive functioning (1980 male mean = 67.4 ppb, female mean = 88.7 ppb). The threshold effect identified in the current study, based on participants with far lower current exposure levels, was observed to be near an exposure level of 2 ppb, which is near the current average background body burden of the unexposed U.S. population as estimated by the EPA (ATDSR, 2000).
With respect to executive functioning we observed a clear threshold effect of PCBs on these variables at about 2 ppb. Below this level there is virtually no observable effect of PCBs on this latent variable that represents higher order cognitive functioning, planning, and behavioral organization. Between 2 ppb and 25 ppb, however, we observed significant deterioration in two of the three latent variables that make up the executive functioning cluster—the Wisconsin Card Sort Test and the Trail Making Test—two measures that constitute valid and reliable indicators of frontal lobe governed, executive functioning (Lezak et al., 1995). For the Trail Making Test, the threshold effect was seen to be age related—it occurred only within the older 37-79 year old participants. While there is a discernable effect of PCBs on the Wisconsin Card Sort and Trail Making latent variables, it should be noted even the poorest level of performance on these variables does not rise to the level of clinical concern. It must be kept in mind that we have no way of knowing if the trend of the regression line beyond the observed maximum PCB body burden (25 ppb) available in this sample would continue upward, level out, or decelerate. It would be unwise to extrapolate beyond the range of the observed data (Montgomery and Peck, 1995)—we do not know for certain what more extreme levels of exposure would bring, and we are cautious about extrapolating too far beyond the range of the data presented here. Lin et al. (2008) in their study of an elderly group of individuals ranging in age from 60 to 91 years (mean = 69.5) report significant deterioration on learning and memory (but not motor function, well being, or activities of daily living) for women only among this age group when compared to an age and education matched unexposed group. Since these comparisons are age-adjusted, they cannot inform the issue of the extent to which PCB exposure may exacerbate the already known age-related deterioration in cognitive functioning (Antsey and Smith, 1999; Baltes and Lindberger, 1997).
In addition to executive functioning, we have found a similar threshold effect for one aspect of motor functioning—the fine motor behavior and finger dexterity required to manipulate the pegs on the grooved pegboard test. And as was the case with the executive functioning variables, this threshold effect identified at about 2 ppb exposure is largely observable within the older age group. The exposure to PCBs not only is having an effect at and beyond 2 ppb, but the effect seems to accelerate the process of slowing that is typically observed in aging (Ruff and Parker, 1993; Verhaeghen and Salthouse, 1997). We found no relationships between PCB exposure and the finger tapping task or the Static Motor Steadiness task. The graph of the relationship of PCBs and the grooved pegboard of Figure 6 is illustrative of the effect for both the younger (18-36) and older (37-79 participants.
Finally, we observed a weaker, but discernable, threshold effect of PCB exposure on a measure of logical memory. While the strength of this effect on the latent variable is not of the magnitude of that observed for executive functioning, we note that this nonlinear effect, with deterioration occurring after 2 ppb, is similar to a deficiency in memory attributable to PCB exposure found by Schantz et al. (2001) among adult Great Lakes fisheaters. In that study the deteriorating effect was observed in only delayed recall version of logical memory—one of the indicators of our logical memory latent variable. Post-hoc individual tests of the models used in this paper with the immediate and delayed versions of the Wechsler logical memory scales of the present study confirms the result of Schantz et al. (2001). In the work of Schantz et al. it was also found that PCBs had an adverse effect on a measure of learning which we cannot replicate because we did not collect comparable measures. It should also be noted that Schantz et al. found no significant relationship between PCB exposure and several measures of executive functioning, including those from the Wisconsin Card Sort Test, the Stroop Color-Word Test, and the Trail Making Test. These differences in obtained results could be due to many reasons about which we can only speculate—sampling variability, differences in sample size, differences in method of exposure, differences in populations and geography, and perhaps the differences in statistical models employed. On the other hand, the failure to find any relationship between PCB exposure and the Static Motor Steadiness Test in the current work replicates a finding reported by Schantz et al. (1999) among adult Michigan fisheaters, but is not consistent with the findings of the Schantz et al. group with respect to the grooved pegboard—they were unable to detect any differences in grooved pegboard performance across levels of PCB exposure after adjusting for several confounders, whereas we observed such effects in the current study. Fitzgerald et al. (2008) also report no effect of PCB exposure on grooved pegboard performance when occupationally exposed workers are compared to an age- and neighborhood-matched sample of community residents. Again, these discrepancies between the results reported in this current study and those of previous investigators could be due to a variety of differences between the samples, sources of exposure, and statistical methodology, including the identification of nonlinear relationships between PCBs and outcomes, or the possible interaction of age and exposure. It is possible that one difference between what we report here and other published works is a function of fitting nonlinear models to the data—in many of our analyses the age-adjusted, linear model alone was insufficient to detect any significant relationships; the nonlinear spline model with joints at about 2 ppb was required to detect the effect. Similar comments would also be relevant to the tests of age-by-exposure interactions.
Further research with adults on these variables may help to clarify the pattern of possible relationships and ultimately lead to meta-analytic synthesis (Hedges and Olkin, 1985) that might shed additional light on this currently unsettled area of investigation.
Although the neuropsychological findings reported in this study reflect statistical significance for trends that are non-chance, it is very important to note that these findings do not reflect comparable clinical significance. Mean performance scores across the entire spectrum of neuropsychological variables reported in Table 1 are well within normal limits when compared to appropriate normative groups (Mitrushina, Boone, Razani & D'Elia, 2005). In addition, no individual participant's cognitive and neurological performance was unusual enough to activate notification of a primary healthcare provider due to concerns about their individual functioning (a proviso that was included in the informed consent procedure). What we cannot tell, of course, is whether the slope of the prediction line from 2 ppb to 25 ppb would continue upward at the same rate, or if there would be an asymptotic dampening of the X-Y slope as the values of exposure to PCBs would exceeded 25 ppb, or as participants continue to age (approximately 20% of our sample was over the age of 50 at the time of initial testing in 1995). There are individuals with PCB body burdens as high as 48 ppb in this Native American population (DiCaprio et al., 2006) but they were not part of the present sample. It is difficult to say just how far from “clinically meaningful” any individual in this population might be, but we can speculate about a few possible scenarios.
As discussed above, the multivariate latent variables of memory, executive functioning, and motor functioning studied here have several statistical advantages over and above separate univariate analyses performed on the 18 measured indicators. However, clinical diagnosis and evaluation is done on a scale-by-scale basis and not with latent variables. We can roughly calibrate the potential clinical significance of these findings by extrapolating the predicted values of individual scales for both increasingly severe levels of exposure to PCBs as well as to the anticipated accelerated aging process. We illustrate these predictions with the Trail Making Test – Part B for which there are published norms on normal, brain injured and demented individuals.
The Trail Making Test – Part B (TMT-B) is a widely used measure of executive functioning which is often used in the diagnosis of dementia. Several authors (Cahn et al., 1995; Rasmusson et al., 1998) have established the sensitivity and specificity of a cutoff score of 172 for the diagnosis of dementia. Among the older group of participants in our sample the regression of the time to completion of the TMT-B on PCBs, at the average of gender (65% male), age (49 years) and education (12 years) suggests a predicted value of TMT-B of 53 if PCBs = 0 and an increment of time to completion of TMT-B of approximately 9.5 seconds per unit increase in log(PCBs). The average PCB exposure level among the 37-79 year olds in our sample is 5.4 ppb which predicts a TMT-B score of 61. The highest exposed participant in this sample has a PCB level of 25 ppb which predicts a TMT-B of 66. Consequently, no one in this current sample is at risk for adverse events of executive functioning as indexed by the TMT-B. This conclusion, however, leaves unanswered the question of predictions for the future as the population of this community ages. Our data suggest that PCB exposure may exacerbate the normal aging process on certain aspects of cognitive and motor functioning. Of course we do not know what has happened to the cognitive and motor functioning of this group of individuals since these data were collected—the age-moderated regression functions fitted to these data could remain linear, accelerate, or decelerate as this population ages further, and we are reluctant to extrapolate too far beyond the range of the available data (Montgomery, Peck and Vining, 2001). Our research suggests that further research with PCB exposed adults who are also aging could be both informative and important. We have observed a significant age-by-PCB interaction among several of the variables measured in this research which also suggests that memory loss, diminished motor facility, and drops in executive functioning that are a natural part of aging (Baltes & Lindenberger, 1997; Perianez et al., 2007) may be accelerated by environmental and/or occupational exposure to PCBs. The possibility that PCB exposure may exacerbate an already age-accelerated process certainly warrants further investigation especially with exposed populations that are now transitioning into their 9th and 10th decades.
Acknowledgments
Granting Agency and IRB Approvals: This work was supported by Grant P24 ESO 4913 from the National Institute of Environmental Health Sciences. The research was conducted in compliance with national and institutional guidelines for the protection of human subjects and was reviewed and approved by the Institutional Review Board of the University at Albany, State University of New York.
Footnotes
Potential confounders of age, gender, education, employment status, marital status, mood state (depression), and general well-being were all tested for their relationship to both predictor and outcome variables. Any variable which was significantly correlated to both predictor and outcome at p < .15 was retained in the final model. The variables of age, gender and education survived this screening in almost all instances. Since one or more of the measured indicators in each latent variable was potentially confounded, all analyses were adjusted for these three potential confounders.
The validity of the 8 factor structure is also substantiated by confirmatory factor analysis (Bollen, 1989). The Root Mean Square Error of Approximation (.04), the 1978 Tucker Lewis Index (.97), the 1980 Bentler and Bonnet Comparative Fit Index (.98), the Standaridzed Root Mean Square Residual (.03), and the χ2/df ratio (1.44) all suggest an excellent fit of the 8 factor model to the data.
The EPA (ATSDR, 2000) estimates that the background level of exposure of US residents who have not been occupationally or environmental exposed is in the range of .9 – 1.5 ppb.
Regression discontinuity designs are also relevant here as a conceptual and analytic device. Such designs accommodate two highly correlated predictor variables with one predictor showing an effect at some point along the axis of the second predictor (Shadish, Cook, & Campbell, 2002). The effect is similar to that of an interaction.
Publisher's Disclaimer: This is a PDF file of an unedited manuscript that has been accepted for publication. As a service to our customers we are providing this early version of the manuscript. The manuscript will undergo copyediting, typesetting, and review of the resulting proof before it is published in its final citable form. Please note that during the production process errors may be discovered which could affect the content, and all legal disclaimers that apply to the journal pertain.
References
- Anderson TW. Introduction to multivariate statistical analysis. Wiley; New York: 2001. [Google Scholar]
- ATSDR [Agency for Toxic Substances and Disease Registry] Toxicological Profile for Polychlorinated Biphenyls (PCBs) US Department of Health and Human Services; Atlanta, GA: 2000. Retrieved 20 December 2007 from http://www.atsdr.cdc.gov/toxprofiles/tp17.pdf. [PubMed] [Google Scholar]
- Antsey KJ, Smith GA. Interrelationships among biological markers of aging, health, activity, acculturation, and cognitive performance in late adulthood. Psychol of Aging. 1999;14:605–618. doi: 10.1037//0882-7974.14.4.605. [DOI] [PubMed] [Google Scholar]
- Arbuckle JL, Wothke W. AMOS 4.0 User's Guide. Small Waters Corp.; Chicago: 1999. [Google Scholar]
- Baltes PB, Lindenberger U. Emergence of a powerful connection between sensory and cognitive functions across the adult life span: A new window to the study of cognitive aging? Psychol of Aging. 1997;12:12–21. doi: 10.1037//0882-7974.12.1.12. [DOI] [PubMed] [Google Scholar]
- Bollen KJ. Structural equations with latent variables. John Wiley & Sons, Inc.; New York: 1989. [Google Scholar]
- Bentler PM, Bonnet DG. Significance tests and goodness of fit in the analysis of covariance structures. Psychol Bull. 1980;88:588–606. [Google Scholar]
- Carpenter DO. Polychlorinated biphenyls (PCBs): Routes of Exposure and effects on human health. Rev Environ Health. 2006;21:1–23. doi: 10.1515/reveh.2006.21.1.1. [DOI] [PubMed] [Google Scholar]
- Cleveland WS. Robust locally-weighted regression and smoothing scatterplots. J Am Stat Assoc. 1979;74:829–936. [Google Scholar]
- Cicchetti DV, Kaufman AS, Sparrow SS. The relationship between prenatal and postnatal exposure to polychlorinated biphenyls (PCBs) and cognitive, neuropsychological, and behavioral deficits: A critical appraisal. Psychol Schools. 2004;41:589–624. [Google Scholar]
- Cohen J. Statistical power analysis for the behavioral sciences. Mahwah, NJ: Lawrence Erlbaum Associates; 1988. [Google Scholar]
- Cohen J, Cohen P, West SG, Aiken LS. Multiple correlation/regression analysis for the behavioral sciences. Lawrence Erlbaum Associates; Mahwah, NJ: 2003. [Google Scholar]
- Darlington RJ. Regression and linear models. McGraw-Hill; New York: 1990. [Google Scholar]
- DeCaprio AP, Johnson GW, Tarbell AM, Carpenter DO, Chiarenzelli JR, Morse GS, Santiago-Rivera A, Schymura MJ, The Akwesasne Task Force on the Environment PCB exposure assessment by multivariate statistical analysis of serum congener profiles in an adult Native American population. Environ Res. 2005;98:284–302. doi: 10.1016/j.envres.2004.09.004. [DOI] [PubMed] [Google Scholar]
- EPA [Environmental Protection Agency] Health effects of PCBs. Atlanta, GA: Department of Health and Human Services; 2006. Accessed online 20 December 2007 online at http://www.epa.gov/opptintr/pcb/pubs/effects.html. [Google Scholar]
- Fitzgerald EF, Hwang SA, Languth K, Cayo M, Yang BZ, Bush B, et al. Fish consumption and other environmental exposures and their associations with serum PCB concentrations among Mohawk women at Akwesasne. Environ Res. 2004;94:160–170. doi: 10.1016/s0013-9351(03)00133-6. [DOI] [PubMed] [Google Scholar]
- Fitzgerald EF, Belanger EE, Gomez MI, Cayo M, McCaffrey RJ, Seegal RF, Jansing RL, Hwang Syni-an, Hicks HE. Polychlorinated Biphenyl (PCB) exposure and neuropsychological status among older residents of upper Hudson River communities. Environ Health Perspect. 2008;116:209–215. doi: 10.1289/ehp.10432. [DOI] [PMC free article] [PubMed] [Google Scholar]
- Golden CJ. The Stroop Color and Word Test. Stoelting Company; Wood Dale, IL: 1978. [Google Scholar]
- Goncharov A, Haase RF, Santiago-Rivera A, Morse G, Akwesasne Task Force on the Environment. McCaffrey RJ, Rej R, Carpenter DO. High serum PCBs are associated with elevation of serum lipids and cardiovascular disease in a Native American population. Env Res. 2008;106:226–239. doi: 10.1016/j.envres.2007.10.006. [DOI] [PMC free article] [PubMed] [Google Scholar]
- Halstead RM, Wolfson D. Therapy and clinical interpretaiton. Neurolopsychological Press; Tuscon, AZ: 1985. The Halstead-Reitan neurological test battery. [Google Scholar]
- Hastie TJ, Tibshirani RJ. Generalized additive models. Chapman & Hall; London: 1990. [Google Scholar]
- Heaton RK. Wisconsin Card Sorting Test (WCST) Psychological Assessment Resources; Odessa, FL: 1981. [Google Scholar]
- Hedges LV, Olkin I. Statistical methods for meta-analysis. Academic Press; New York: 1985. [Google Scholar]
- Hummel TJ, Sligo J. Empirical comparison of univariate and multivariate analysis of variance procedures. Psychol Bull. 1971;76:49–57. [Google Scholar]
- Hwang SA, Fitzgerald EF, Bush B. Exposure to PCB's from hazardous waste among Mohawk women and infants at Akwesasne. Technology: J Franklin Inst. 1996;333A:17–23. [Google Scholar]
- Jacobson JL, Jacobson SW. Evidence for PCBS as neurodevelopmental toxicants in humans. Neurotoxicology. 1997;18:415–424. [PubMed] [Google Scholar]
- Jacobson JL, Jacobson SW. Intellectual impairment in children exposed to polychlorinated biphenyls in utero. NEJM. 1996;335:783–789. doi: 10.1056/NEJM199609123351104. [DOI] [PubMed] [Google Scholar]
- Jacobson JL, Jacobson SW, Padgett RJ, Brumitt GA, Billings RL. Effects of prenatal PCB exposure on cognitive processing efficiency and sustained attention. Dev Psychol. 1992;28:297–306. [Google Scholar]
- Jolliffe IT. Principal components analysis. Springer-Verlag; NY: 1986. [Google Scholar]
- Joreskog K, Sorbom D. LISREL 8.0. User's Reference Guide. Scientific Software International; Chicago: 1993. [Google Scholar]
- Kimbrough RD. Polychlorinated biphenyls (PCBs) and human health: An update. Crit Rev Toxicol. 1995;25:133–163. doi: 10.3109/10408449509021611. [DOI] [PubMed] [Google Scholar]
- Klove H. Clinical neuropsychology. In: Foster FM, editor. The medical clinics of North America. Saunders; New York: 1963. [PubMed] [Google Scholar]
- Lafayette Instruments. Steadiness Tester Model 32011. Author; Lafayette, IN: 2004. [Google Scholar]
- Lezak MD, Howieson DB, Loring DW. Neuropsychological Assessment. 4th. Oxford University Press; New York: 2004. [Google Scholar]
- Lin KC, Guo NW, Tsai PC, Yang CY, Guo YL. Neurocognitive changes among elderly exposed to PCBs/PCDFs in Taiwan. Environ Health Perspect. 2008;116:184–189. doi: 10.1289/ehp.10134. [DOI] [PMC free article] [PubMed] [Google Scholar]
- Marsh LC, Cormier DR. Spline regression models. Sage Publications; Thousand Oaks, CA: 2002. [Google Scholar]
- Mitrushina M, Boone KB, Razani J, D'Elia LF. Handbook of Normative Data for Neuropsychological Assessment. 2nd. Oxford University Press; New York: 2005. [Google Scholar]
- Montgomery DC, Peck EA, Vining G. Introduction to linear regression analysis. John Wiley & Sons, Inc.; New York: 2001. [Google Scholar]
- Perianez JA, Rios-Lago M, Rodriguez-Sanchez D, Adrover-Roig D, Sanchez-Cubillo I, Crespo-Facorro B, Quemada JI, Barcelo F. Trail Making Test in traumatic brain injury, schizophrenia, and normal ageing: Sample comparisons and normative data. Arch Clin Neuropsychol. 2007;22:433–447. doi: 10.1016/j.acn.2007.01.022. [DOI] [PubMed] [Google Scholar]
- Rasmusson DX, Zonderman AB, Kawas C, Resnick SM. Effects of age and dementia on the Trail Making Test. Clin Neuropsychologist. 1998;12:169–178. [Google Scholar]
- Reitan RM, Wolfson D. The Halstead-Reitan Neuropsychological Test Battery: Theory and Clinical Implications. 2nd. Neuropsychology Press; Tucson, AZ: 1979. [Google Scholar]
- Rothman KJ, Greenland S. Modern epidemiololgy. Lippincot, Williams & Wilkens; Philadelphia: 1998. [Google Scholar]
- Ruff RM, Parker SB. Gender and age-specific changes in motor speed and eye-hand coordination in adults: Normative values for the finger tapping and grooved pegboard tests. Percept Mot Skills. 1993;76:1219–1230. doi: 10.2466/pms.1993.76.3c.1219. [DOI] [PubMed] [Google Scholar]
- Russell E. A multiple scoring method for the assessment of complex memory functions. J Consult Clin Psychol. 1975;43:800–809. [Google Scholar]
- Santiago-Rivera S, Morse GS, Haase RF, McCaffrey RJ, Tarbell A. Exposure to an environmental toxin—PCBs, quality of life, and psychological distress. J Environ Psychol. 2007;27:33–43. [Google Scholar]
- Santiago-Rivera S, Morse GS, Hunt A, Lickers H. Building a partnership for community-based research: Lessons from the Mohawk Nation at Akwesasne. J Commun Psychol. 1998;20:163–174. [Google Scholar]
- SAS Institute. SAS Version 9.0.1. SAS Institute, Inc.; Cary, NC: 2006. [Google Scholar]
- Schantz SL, Gasior DB, Polverejan El, McCaffrey RJ, Sweeney AM, Humphrey HEB, et al. Impairments of memory and learning in older adults exposed to polychlorinated biphenyls via consumption of Great Lakes fish. Env Health Perspect. 2001;109:605–611. doi: 10.1289/ehp.01109605. [DOI] [PMC free article] [PubMed] [Google Scholar]
- Schantz SL, Gardiner JC, Gasior DM, Sweeney AM, Humphrey HEB, McCaffrey RJ. Motor function in aging Great Lakes fisheaters. Env Res. 1999;80:46–56. doi: 10.1006/enrs.1998.3904. [DOI] [PubMed] [Google Scholar]
- Schantz SL, Gardiner JC, Gasior DM, McCaffrey RJ, Sweeney A, Humphrey HEB. Much ado about something: The weight of evidence for PCB effects on neuropsychological function. Psychol Schools. 2004;41:669–679. [Google Scholar]
- Schell LM, Hubicki LA, DeCaprio AP, Gallo MV, Ravenscroft J, Tarbell A, Jacobs A, David D, Worswick P, Akwesasne Task Force on the Environment Organochlorines, lead, and mercury in Akwesasne Mohawk youth. Env Health Perspect. 2003;111:954–961. doi: 10.1289/ehp.5990. [DOI] [PMC free article] [PubMed] [Google Scholar]
- Seegal RF. Neurochemical effects of polychlorinated biphenyls: A selective review of the current state of knowledge. In: Robertson LW, Hansen LG, editors. Recent advances in environmental toxicology and health effects. University of Kentucky Press; Lexington, KY: 2001. [Google Scholar]
- Seegal RF, Bush B, Brosch K. Comparison of effects or Aroclors 1016 and 1260 on non-human primate catecholamine function. Toxicology. 1991;66:145–163. doi: 10.1016/0300-483x(91)90215-m. [DOI] [PubMed] [Google Scholar]
- SPSS, Inc. SPSS Version 15. SPSS, Inc.; Chicago: 2006. [Google Scholar]
- Shaddish WR, Cook TR, Campbell DT. Experimental and quasi-experimental designs for generalized causal inference. Houghton-Mifflin; Boston: 2002. [Google Scholar]
- Smith PL. Splines as a useful and convenient statistical tool. American Statistician. 1979;33:57–62. [Google Scholar]
- Strauss E, Sherman EMS, Spreen O. A compendium of neuropsychological tests. 3rd. Oxford University Press; New York: 2006. [Google Scholar]
- Tucker LR, Lewis C. A reliability coefficient for maximum likelihood factor analysis. Psychometrika. 1973;38:1–10. [Google Scholar]
- Verhaeghen P, Salthouse TA. Meta-analysis of age-cognition relations in adulthood: Estimates of linear and non-linear age effects and structural models. Psychol Bull. 1997;122:231–249. doi: 10.1037/0033-2909.122.3.231. [DOI] [PubMed] [Google Scholar]
- Wechsler D. A standardized memory scale for clinical use. J Psychol. 1945;19:87–95. [Google Scholar]


