INTRODUCTION
The diagnosis of acute graft versus host disease (GVHD) is based on clinical criteria which may be confirmed by biopsy of one of the three target organs (skin, gastrointestinal tract or liver). The severity of acute GVHD is graded clinically from I – IV using a standardized system that evaluates three principal target organs1, with increased mortality rates with significant GVHD (grades II – IV).2
There is no validated diagnostic blood test for acute GVHD, although multiple blood proteins have been described as potential biomarkers in small studies.3–23 Differences in any single protein have lacked sufficient specificity and sensitivity to be of clinical use. Although recent mass spectrometric (MS) profiling of urine24,25 and serum26 demonstrate the presence of spectral patterns associated with GVHD, these approaches do not identify specific proteins. We have previously reported a quantitative analysis of a number of potential biomarkers for GVHD in the plasma of a small number of patients.27 However, no study has developed a simple non-invasive test that indicates GVHD in a sufficient large number of patient samples that would allow determining its significance with respect to clinical outcomes.
The complex pathophysiology of GVHD28 suggests that plasma proteins involved in multiple processes such as T cell alloreactivity, inflammation and tissue damage and repair might be altered in the patient with the disease. Further, the dynamic nature of the circulatory system and the ease with which the blood can be sampled makes it a logical choice for biomarker applications. Blood components include various cellular elements such as immunologic cells, leukemic cells, cell-free DNA and RNA, proteins, peptides and metabolites. Proteins that are detectable in plasma or serum form the basis of commonly used test to screen and monitor several cancers, such as prostate-specific antigen (PSA) for prostate cancer or Ca125 for ovarian cancer. The goal of having such biomarker in the blood for the diagnostic and prognostic of acute GVHD has not yet been achieved.
ONE PROTEOMICS DISCOVERY APPROACH
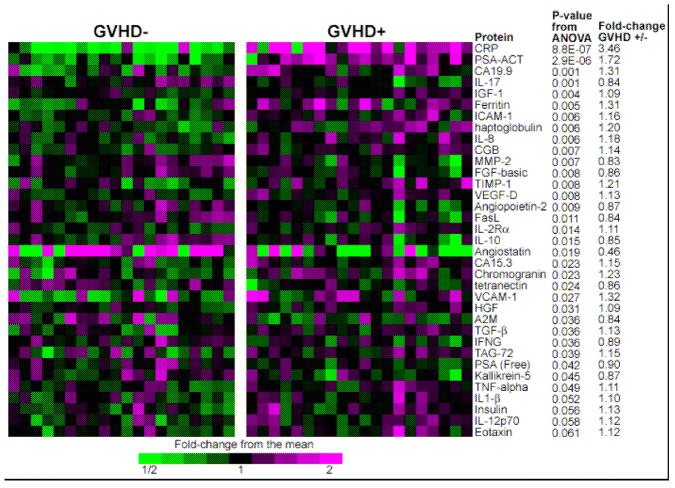
Experimental design has a crucial role in a successful biomarker search. The first step is the choice of the most informative specimens and the adequacy of matching between cases and controls to avoid bias. This goal is best achieved through a database containing high quality samples linked to quality-controlled clinical information. At the University of Michigan in 2000 we initiated a repository that currently contains approximately 8000 samples from 850 individuals. Blood was drawn at approximately weekly intervals in the first two months after HCT. We analyzed these samples using an antibody microarray containing arrayed antibodies to 120 human proteins that targeted diverse classes of proteins including acute phase reactants, cytokines, angiogenic factors, tumor markers, leukocyte adhesion molecules, and metalloproteinases or their inhibitors and we hypothesized that samples from patients whose GVHD was severe would be most likely to yield informative biomarkers. We first performed a discovery study that compared samples from 21 patients with severe acute GVHD (GVHD+ severe) to samples from 21 patients without GVHD who were similar in age, intensity of the conditioning regimen (reduced versus full), donor source (related versus unrelated) and time of sample acquisition. The 35 biomarkers that demonstrated the most significant differences between groups are shown in Figure 1.29
Fig 1. Antibody array heatmap of discovery set samples.
This heatmap depicts relative protein values obtained from antibody microarrays after removal of batch effects due to three separate analyses. Samples from 21 GVHD–patients (left panel) and 21 GVHD+ patients (right panel) are represented. Only the antibodies giving the 35 smallest p-values for differences between GVHD+ and GVHD– patient plasma are shown. P-values compare GVHD+ and GVHD–samples. Reproduced with permission from reference 31.
VALIDATION STRATEGIES FOR DISCOVERED PROTEIN BIOMARKERS
The path from discovery to approval for use in clinical is arduous for any biomarker. The biomarker validation process is long and need several steps, although more direct than the discovery step. The validations studies have obstacles of their own. Most noteworthy is the paucity of affinity-capture agents such as high-quality antibodies with the required affinity and specificity for the target. The number of samples needed for validation also increases as the biomarker advances though the phases, hence the need of high-throughput assays. The most-relied on approach for validation remains the sandwich enzyme-linked immunosorbent assay (ELISA) which is highly specific because of the use of a pair of antibodies against the candidate protein. In our study, a sequential ELISA protocol was used to maximize the number of measured analytes per sample. This sequential protocol measures multiple analytes per plasma sample by re-using the same aliquot consecutively in individual ELISA plates. Another level of validation is the use of a statistical validation set which is a portion of the data set used to assess the performance of classification or prediction models that have been fit on a separate portion of the same data set: the training set. Both the training and validation set are randomly selected, and the validation set is used as a more objective measure of the performance of various models that have been fit to the training data.
RATIONAL DESIGN OF BIOMARKERS PANELS FOR GVHD DIAGNOSTIC
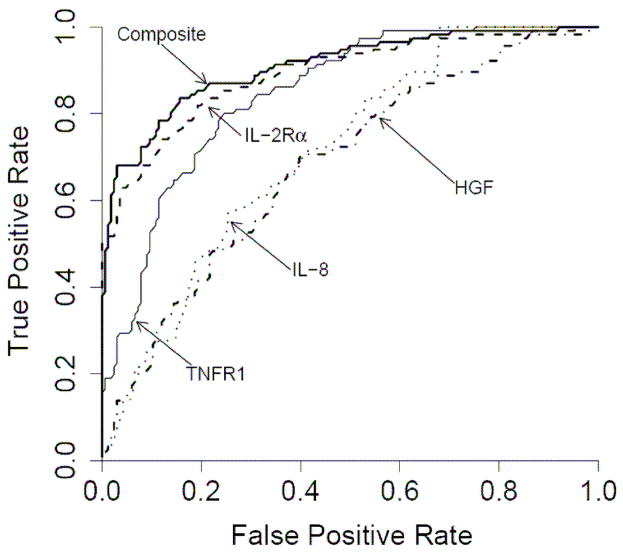
It is clear that single biomarker lack the sensitivity and specificity needed for most clinical applications. Specificity and sensitivity are best represented by a Receiver Operating Characteristic (ROC) curve which is a plot of the false positive rate on the x axis and true positive rate on the y axis for every possible level of a marker. A perfect test would have a ROC curve that is a right angle demonstrating 100% of true positives and no false positives. In this case, the corresponding Area Under the Curve (AUC) will equal 1. A random test will have an AUC of 0.5 meaning that there is one false positive for every true positive. A biomarkers panel might include a candidate biomarker that may otherwise be dismissed if in initial studies it provides modest sensitivity. This biomarker may be valuable if it is informative with respect to a particular subset of subjects. For example, in our study, logistic regression models determined that a linear combination of values for IL-2Rα, TNFR1, HGF and IL-8 levels produced the best model to predict the occurrence of acute GVHD. The ROC curves of these four biomarkers and the composite biomarker panel are shown in Figure 2, with an AUC for the composite biomarker panel of 0.91 [95% CI, 0.87 – 0.94]. Levels of IL-2Rα and TNFR1 primarily contributed to the accuracy of the model (p < 0.001 and p = 0.003, respectively). When logistic regression models were used to determine whether the four biomarker panel provided prognostic information HGF was the only marker that predicted maximum GVHD grade (p = 0.003) and both HGF and IL-2Rα were associated with specific target organs (p = 0.03 and p = 0.04).
Fig 2. Receiver Operating Characteristic (ROC) curves of four individual discriminator proteins and the composite panel in the training set.
Individual ROC curves for IL-2Rα (- - - -), TNFR1 (——), HGF ( ) and IL-8 (
 ) and the composite panel (———). Reproduced with permission from reference 31.
CLINICAL APPLICATIONS
Physicians are interested in low and high risk groups for developing GVHD and the significance of these groups with respect to clinical outcomes. In our study we divided patients in the training set into two high and low risk groups based on their predicted probabilities for developing GVHD. We determined the threshold for high so that the false positive rate did not exceed 5%. We then asked whether the four biomarker panel described above provided prognostic information regarding (i) the eventual maximum grade of GVHD and (ii) non-relapse mortality (NRM) and overall survival (OS).
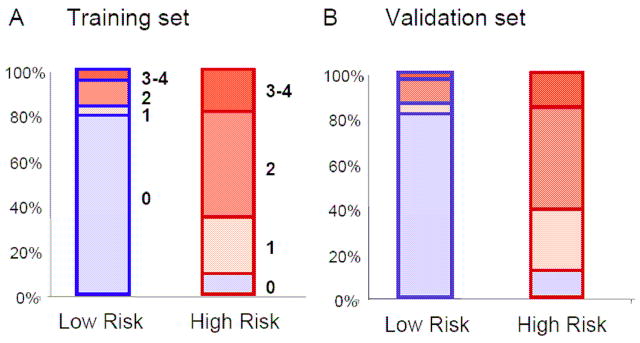
(i) In the training set, the low risk group consisted primarily of patients with grade 0 GVHD as shown in Figure 3A. Only a few patients had GVHD grade I–IV. In the high risk group, less than 10 % of patients had GVHD grade 0, whereas most patients had GVHD grade I–IV. Importantly, these results were very similar in the validation set, where the model predicted the GVHD grade of those patients without knowledge of their clinical symptoms (Figure 3B).
Fig 3. Low and high risk groups correlate to GVHD grades.
The blue boxes represent the low risk groups and the red boxes the high risk groups in the training (Panel A) and validation (Panel B) sets. The filled blue colors represent the GVHD grade 0 and the filled red colors the GVHD grade 1–4.
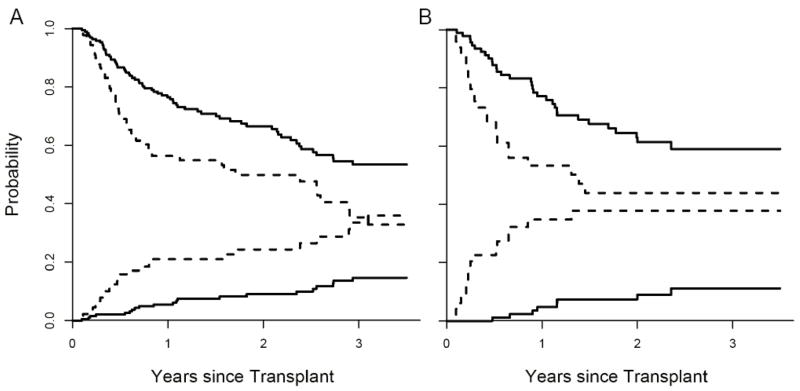
(ii) Non-relapse mortality (NRM) and overall survival (OS) for low and high risk groups are shown in Figure 4. When adjusted for age, donor type, HLA-match and intensity of conditioning, the differences in NRM between the two groups were highly significant (p = 0.001, Figure 4A). When we applied the same definition to the validation set, the false positive rate in the high risk group was 6%. The NRM between groups was again significantly different when adjusted for all four variables (Figure 4B, p < 0.001). These two groups also experienced significantly different OS in both the training set (Figure 4A, p = 0.006, adjusted) and validation set (Figure 4B, p = 0.02, adjusted).
Fig 4. Non-relapse mortality (NRM) and overall survival (OS) stratified by the biomarker panel in the training set (Panel A) and validation set (Panel B).
In Panel A, the cumulative incidence of NRM and OS (determined by Kaplan Meier) are plotted according to the predicted probability of acute GVHD: low (—, n = 193) and high (- - -, n = 89). P = 0.001 and 0.006 (adjusted for age, donor type, HLA-match and intensity of conditioning) for differences in NRM and OS, respectively. The NRM at 3.5 years is 15% [95% CI, 9%–21%] for the low risk group and 36% [95% CI, 24%–48%] for the high risk group. OS at 3.5 years is 53% [95% CI, 45%–63%] for the low risk group and 33% [95% CI, 22%–48%] in the high risk group. In Panel B, the cumulative incidence of NRM and OS of the two groups are plotted for the validation set: low (—, n = 93) and high (- - -, n = 49). P < 0.001 and 0.02 (adjusted as before) for differences in NRM and OS, respectively. The NRM at 3.5 years is 11% [95% CI, 4%–19%] for the low risk group and 38% [95% CI, 23%–53%] for the high risk group. OS at 3.5 years is 59% [95% CI, 49%–72%] for the low risk group and 44%, [95% CI, 31%–63%] for the high risk group. Reproduced with permission from reference 31.
A SECOND PROTEOMICS APPROACH FOR TARGET ORGAN SPECIFIC BIOMARKERS
A variety of mass spectrometry (MS)-based proteomic approaches have recently been used in an attempt to diagnose GVHD with promising results.24–26 An advantage of these approaches is that identification of proteins does not depend on the availability of antibodies as in the case of microarrays. These MS-based techniques do have inherent disadvantages such as the lack of identification of specific proteins, their labor intensity, lack of speed and the limited sensitivity for low abundant proteins. Newer technologies such as tandem-MS make such techniques more attractive. Given the low abundance in serum or plasma of the known GVHD individual markers, the issue is whether current proteomic technologies provide sufficient depth of analysis for novel biomarker discovery. Three studies using current tandem mass spectrometry (MS/MS) technologies have shown that proteins in low concentration are identified in plasma.30–32
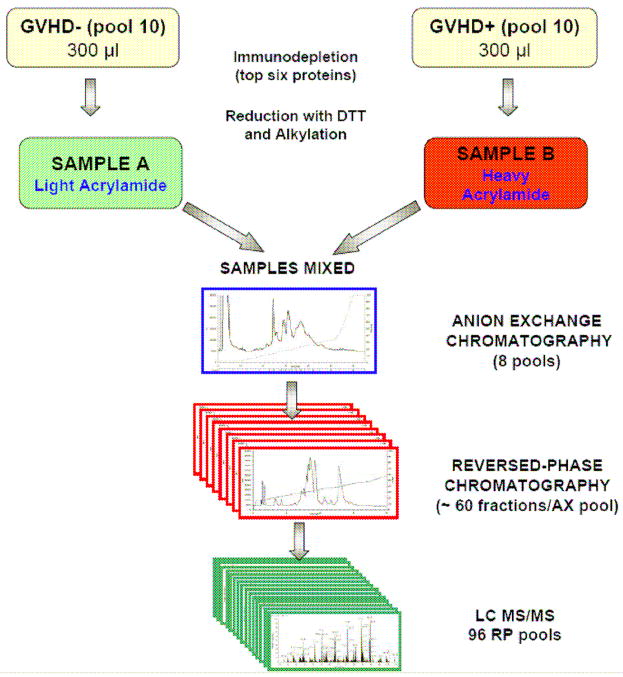
There are no plasma biomarkers that are specific to any of the three target organs of acute graft versus host disease (GVHD): skin, GI tract and liver. We sought to identify a biomarker that is specific for GVHD of the skin in an initial discovery step using an intact proteomic analysis system (Figure 5). We compared plasma pooled from ten patients with GVHD only of the skin (sGVHD) to plasma pooled from ten patients with no GVHD to plasma pooled from ten patients with GVHD only of the GI tract. Of four candidate proteins that were both significantly elevated only in the plasma of sGVHD patients and that could be measured by ELISA, we selected elafin, an epidermal proteinase inhibitor that is induced by TNF-α and found in inflamed epidermis in diseases such as psoriasis. We therefore measured levels of elafin in individual samples of the discovery set, confirming that they were significantly higher in plasma from patients with sGVHD compared to patients presenting only with GI GVHD or without GVHD, respectively. We next analyzed a validation set of > 400 plasma samples from allogeneic BMT patients transplanted at the University of Michigan. Elafin levels were two fold higher in plasma from patients with sGVHD as compared to plasma from patients without GVHD. We next analyzed whether elafin levels provided prognostic information regarding (i) eventual maximum stage of GVHD skin, (ii) transplant-related mortality and (iii) overall survival. For this purpose, we divided the patients into 2 groups using a threshold level of elafin that provided 85% specificity. The group with the high levels of elafin developed more severe skin GVHD (maximum stage) than the group with low levels. Patients with high elafin levels also experienced greater transplant-related mortality (TRM) at 1 year. Patients with high elafin levels also experienced lower overall survival (OS) at 1 year. this study suggests that a biomarker such as elafin that is specific for a target organ (skin) can be discovered and validated and can provide important diagnostic and prognostic information, that could eventually be useful in modifying our therapeutic options.
Fig 5. Intact Protein Analysis System workflow and in-depth analysis of plasma proteins.
Plasma pooled from ten patients with GVHD are labeled with the heavy isotope and compared to plasma pooled from ten patients with no GVHD labeled with the light isotope. The specimens are then subjected to extensive fractionation (by ion-exchange chromatography and reversed-phase chromatography) before analysis of individual fractions. The result is a reduced complexity of individual fractions subjected to analysis by liquid chromatography – tandem mass spectrometry (LC-MS/MS). Adapted from reference 32.
Footnotes
Publisher's Disclaimer: This is a PDF file of an unedited manuscript that has been accepted for publication. As a service to our customers we are providing this early version of the manuscript. The manuscript will undergo copyediting, typesetting, and review of the resulting proof before it is published in its final citable form. Please note that during the production process errors may be discovered which could affect the content, and all legal disclaimers that apply to the journal pertain.
References
- 1.Przepiorka D, Weisdorf D, Martin P, et al. 1994 Consensus Conference on Acute GVHD Grading. Bone Marrow Transplant. 1995;15:825–828. [PubMed] [Google Scholar]
- 2.Martin PJ, Schoch G, Fisher L, et al. A retrospective analysis of therapy for acute graft-versus-host disease: secondary treatment. Blood. 1991;77:1821–1828. [PubMed] [Google Scholar]
- 3.Miyamoto T, Akashi K, Hayashi S, et al. Serum concentration of the soluble interleukin-2 receptor for monitoring acute graft-versus-host disease. Bone Marrow Transplant. 1996;17:185–190. [PubMed] [Google Scholar]
- 4.Grimm J, Zeller W, Zander AR. Soluble interleukin-2 receptor serum levels after allogeneic bone marrow transplantations as a marker for GVHD. Bone Marrow Transplant. 1998;21:29–32. doi: 10.1038/sj.bmt.1701041. [DOI] [PubMed] [Google Scholar]
- 5.Foley R, Couban S, Walker I, et al. Monitoring soluble interleukin-2 receptor levels in related and unrelated donor allogenic bone marrow transplantation. Bone Marrow Transplant. 1998;21:769–773. doi: 10.1038/sj.bmt.1701163. [DOI] [PubMed] [Google Scholar]
- 6.Nakamura H, Komatsu K, Ayaki M, et al. Serum levels of soluble IL-2 receptor, IL-12, IL-18, and IFN-gamma in patients with acute graft-versus-host disease after allogeneic bone marrow transplantation. J Allergy Clin Immunol. 2000;106:S45–50. doi: 10.1067/mai.2000.106774. [DOI] [PubMed] [Google Scholar]
- 7.Shaiegan M, Iravani M, Babaee GR, Ghavamzadeh A. Effect of IL-18 and sIL2R on aGVHD occurrence after hematopoietic stem cell transplantation in some Iranian patients. Transpl Immunol. 2006;15:223–227. doi: 10.1016/j.trim.2005.10.002. [DOI] [PubMed] [Google Scholar]
- 8.Visentainer JE, Lieber SR, Persoli LB, et al. Serum cytokine levels and acute graft-versus-host disease after HLA-identical hematopoietic stem cell transplantation. Exp Hematol. 2003;31:1044–1050. doi: 10.1016/j.exphem.2003.08.005. [DOI] [PubMed] [Google Scholar]
- 9.Holler E, Kolb HJ, Moller A, et al. Increased serum levels of tumor necrosis factor alpha precede major complications of bone marrow transplantation. Blood. 1990;75:1011–1016. [PubMed] [Google Scholar]
- 10.Kayaba H, Hirokawa M, Watanabe A, et al. Serum markers of graft-versus-host disease after bone marrow transplantation. J Allergy Clin Immunol. 2000;106:S40–44. doi: 10.1067/mai.2000.106060. [DOI] [PubMed] [Google Scholar]
- 11.Or R, Kalinkovich A, Nagler A, et al. Soluble tumor necrosis factor (sTNF) receptors: a possible prognostic marker for bone marrow transplantation-related complications. Cytokines Mol Ther. 1996;2:243–250. [PubMed] [Google Scholar]
- 12.Okamoto T, Takatsuka H, Fujimori Y, Wada H, Iwasaki T, Kakishita E. Increased hepatocyte growth factor in serum in acute graft-versus-host disease. Bone Marrow Transplant. 2001;28:197–200. doi: 10.1038/sj.bmt.1703095. [DOI] [PubMed] [Google Scholar]
- 13.Schots R, Kaufman L, Van Riet I, et al. Proinflammatory cytokines and their role in the development of major transplant-related complications in the early phase after allogeneic bone marrow transplantation. Leukemia. 2003;17:1150–1156. doi: 10.1038/sj.leu.2402946. [DOI] [PubMed] [Google Scholar]
- 14.Uguccioni M, Meliconi R, Nesci S, et al. Elevated interleukin-8 serum concentrations in beta-thalassemia and graft-versus-host disease. Blood. 1993;81:2252–2256. [PubMed] [Google Scholar]
- 15.Liem LM, van Houwelingen HC, Goulmy E. Serum cytokine levels after HLA-identical bone marrow transplantation. Transplantation. 1998;66:863–871. doi: 10.1097/00007890-199810150-00009. [DOI] [PubMed] [Google Scholar]
- 16.Imamura M, Hashino S, Kobayashi H, et al. Serum cytokine levels in bone marrow transplantation: synergistic interaction of interleukin-6, interferon-gamma, and tumor necrosis factor-alpha in graft-versus-host disease. Bone Marrow Transplant. 1994;13:745–751. [PubMed] [Google Scholar]
- 17.Mohty M, Blaise D, Faucher C, et al. Inflammatory cytokines and acute graft-versus-host disease after reduced-intensity conditioning allogeneic stem cell transplantation. Blood. 2005;106:4407–4411. doi: 10.1182/blood-2005-07-2919. [DOI] [PubMed] [Google Scholar]
- 18.Fujimori Y, Takatsuka H, Takemoto Y, et al. Elevated interleukin (IL)-18 levels during acute graft-versus-host disease after allogeneic bone marrow transplantation. Br J Haematol. 2000;109:652–657. doi: 10.1046/j.1365-2141.2000.02095.x. [DOI] [PubMed] [Google Scholar]
- 19.Symington FW, Pepe MS, Chen AB, Deliganis A. Serum tumor necrosis factor alpha associated with acute graft-versus-host disease in humans. Transplantation. 1990;50:518–521. doi: 10.1097/00007890-199009000-00033. [DOI] [PubMed] [Google Scholar]
- 20.Luft T, Conzelmann M, Benner A, et al. Serum cytokeratin-18 fragments as quantitative markers of epithelial apoptosis in liver and intestinal graft-versus-host disease. Blood. 2007 doi: 10.1182/blood-2006-10-049817. [DOI] [PubMed] [Google Scholar]
- 21.Piper KP, Horlock C, Curnow SJ, et al. CXCL10 - CXCR3 interactions play an important role in the pathogenesis of acute graft-versus-host disease in the skin following allogeneic stem cell transplantation. Blood. 2007 doi: 10.1182/blood-2006-12-061408. [DOI] [PubMed] [Google Scholar]
- 22.Seidel C, Ringden O, Remberger M. Increased levels of syndecan-1 in serum during acute graft-versus-host disease. Transplantation. 2003;76:423–426. doi: 10.1097/01.TP.0000074316.76104.A5. [DOI] [PubMed] [Google Scholar]
- 23.Hori T, Naishiro Y, Sohma H, et al. CCL8 is a potential molecular candidate for the diagnosis of graft-versus-host disease. Blood. 2008;111:4403–4412. doi: 10.1182/blood-2007-06-097287. [DOI] [PMC free article] [PubMed] [Google Scholar]
- 24.Kaiser T, Kamal H, Rank A, et al. Proteomics applied to the clinical follow-up of patients after allogeneic hematopoietic stem cell transplantation. Blood. 2004;104:340–349. doi: 10.1182/blood-2004-02-0518. [DOI] [PubMed] [Google Scholar]
- 25.Weissinger EM, Schiffer E, Hertenstein B, et al. Proteomic patterns predict acute graft-versus-host disease after allogeneic hematopoietic stem cell transplantation. Blood. 2007;109:5511–5519. doi: 10.1182/blood-2007-01-069757. [DOI] [PubMed] [Google Scholar]
- 26.Srinivasan R, Daniels J, Fusaro V, et al. Accurate diagnosis of acute graft-versus-host disease using serum proteomic pattern analysis. Exp Hematol. 2006;34:796–801. doi: 10.1016/j.exphem.2006.02.013. [DOI] [PubMed] [Google Scholar]
- 27.Wang H, Clouthier SG, Galchev V, et al. Intact-protein-based high-resolution three-dimensional quantitative analysis system for proteome profiling of biological fluids. Mol Cell Proteomics. 2005;4:618–625. doi: 10.1074/mcp.M400126-MCP200. [DOI] [PubMed] [Google Scholar]
- 28.Ferrara JL, Deeg HJ. Graft-versus-host disease. N Engl J Med. 1991;324:667–674. doi: 10.1056/NEJM199103073241005. [DOI] [PubMed] [Google Scholar]
- 29.Paczesny. A biomarker panel for acute graft versus host disease. Blood. doi: 10.1182/blood-2008-07-167098. [DOI] [PMC free article] [PubMed] [Google Scholar]
- 30.Faca V, Pitteri SJ, Newcomb L, et al. Contribution of protein fractionation to depth of analysis of the serum and plasma proteomes. J Proteome Res. 2007;6:3558–3565. doi: 10.1021/pr070233q. [DOI] [PubMed] [Google Scholar]
- 31.States DJ, Omenn GS, Blackwell TW, et al. Challenges in deriving high-confidence protein identifications from data gathered by a HUPO plasma proteome collaborative study. Nat Biotechnol. 2006;24:333–338. doi: 10.1038/nbt1183. [DOI] [PubMed] [Google Scholar]
- 32.Zhang H, Liu AY, Loriaux P, et al. Mass spectrometric detection of tissue proteins in plasma. Mol Cell Proteomics. 2007;6:64–71. doi: 10.1074/mcp.M600160-MCP200. [DOI] [PubMed] [Google Scholar]


