Abstract
Brain injury affects one-third of persons who survive after heart attack, even with restoration of spontaneous circulation by cardiopulmonary resuscitation. We studied brain injury resulting from transient bilateral carotid artery occlusion (BCAO) and reperfusion by simulating heart attack and restoration of circulation, respectively, in live C57Black6 mice. This model is known to induce neuronal death in the hippocampus, striatum, and cortex. We report the appearance of edema after transient BCAO of 60 minutes and 1 day of reperfusion. Hyperintensity in diffusion-weighted magnetic resonance imaging (MRI) was detectable in the striatum, thalamus, and cortex but not in the hippocampus. To determine whether damage to the hippocampus can be detected in live animals, we infused a T2 susceptibility magnetic resonance contrast agent (superparamagnetic iron oxide nanoparticles [SPIONs]) that was linked to single-stranded deoxyribonucleic acid (DNA) complementary in sequence to c-fos messenger ribonucleic acid (SPION-cfos); we acquired in vivo T2*-weighted MRI 3 days later. SPION retention was measured as T2* (milliseconds) signal reduction or R2* value (s−1) elevation. We found that animals treated with 60-minute BCAO and 7-day reperfusion exhibited significantly less SPION retention in the hippocampus and cortex than sham-operated animals. These findings suggest that brain injury induced by cardiac arrest can be detected in live animals.
Brain edema after experimental and clinical cardiac arrest is predictive of poor neurologic prognosis; it occurs despite restoration of circulation using various means.1,2 To improve our understanding of cerebral injury induced by heart attack, we established a global cerebral ischemia (CI)-reperfusion model to investigate brain injury by simulating cardiac arrest in male C57Black6 mice.3 This model typically involves bilateral carotid artery occlusion (BCAO) of less than 120 minutes to restrict blood flow to the brain by 85 to 89% and release of BCAO to allow reperfusion, simulating restoration of circulation.4,5 Previous investigations have demonstrated elevation in reactive oxygen species, precursors of gene damage, deoxyribonucleic acid (DNA) fragmentation, and neuronal apoptosis in the hippocampus, striatum, frontal cortex, and piriform cortex.4–8 Unlike more commonly used stroke models, use of this model for investigating cerebral edema or necrosis has been reported by only a few laboratories.9,10
Detection of apoptosis in living subjects using advanced diffusion-weighted imaging (DWI) is difficult because the process is not associated with either abnormal water content or gross morphologic changes. However, recent advances in ligand-targeting contrast agents have shown that it is possible to detect the process of cellular apoptosis in vivo.11–19 Detection requires specific protein-antibody interactions on cell surface markers associated with apoptosis; therefore, injection of probe must be timed to coincide with expression of surface markers.
Several single-stranded phosphorothioate-modified oligodeoxynucleotides (sODNs) with messenger ribonucleic acid (mRNA)-complementary sequences have been shown to have specific targeting properties on cerebral mRNAs after being taken up by the brain cells of live animals.20–26 Retention of sODN in the brain is also mRNA sequence specific. We developed a novel magnetic resonance contrast probe by labeling superparamagnetic iron oxide nanoparticles (SPIONs) with mRNA-targeting sODN. The target gene transcript in this study is c-fos mRNA, which can be detected in cerebral neurons.27 Fos, the protein of cfos mRNA, is an important component of activator protein 1, which regulates the transcription of many genes, including nerve growth factor.28 We selected this target mRNA because normal and active brain cells express minimal levels of c-fos mRNA and because its turnover is 10 minutes or less.29 Given these properties of c-fos, we expect to find much lower levels of c-fos mRNA in apoptotic cells, where DNA fragmentation prevents new transcription, than in live animal cells (Figure 1). We hypothesize that our new magnetic resonance probe will offer detection for distinguishing living and dead cells in the brains of live animals. We show here vulnerability in regions of the mouse brain following treatment that simulates cardiac arrest, which, although undetectable with DWI, can be detected by differential uptake of SPION-cfos.
Figure 1.
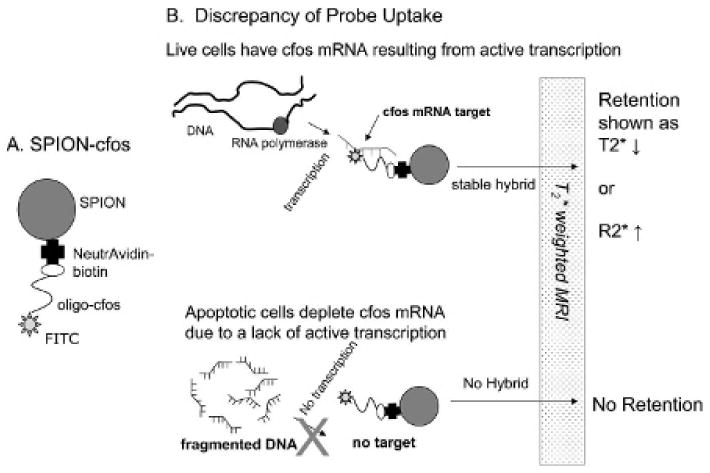
A, Description of the oligo nucleic acid–based superparamagnetic iron oxide nanoparticle (SPION) probe. Linkage of SPION and single-stranded phosphorothioate-modified oligodeoxynucleotides is based on the avidin-biotin interaction. B, Cartoon depicting how living cells with normal cfos messenger ribonucleic acid (mRNA) transcription are able to retain SPION-cfos probe by complex formation based on complementary base pairing between the probe and the intracellular mRNA target. The presence of T2* magnetic resonance contrast agent (SPION) can cause localized magnetic resonance signal reduction owing to cells that contain SPION. On the other hand, dead cells damaged by apoptosis exhibit fragmented deoxyribonucleic acid (DNA), and no new cfos mRNA can be transcribed owing to a lack of available DNA template. As a result, there is less or no uptake of SPION-cfos by the dead cell.
Materials and Methods
Contrast Probe Preparation
Dextran-coated SPION was prepared as described previously.30,31 Briefly, freshly synthesized SPION was activated with cyanogen bromide,32 and reacted with NeutrAvidin (NA, Pierce Biotechnology, Rockford, IL) in the presence of 1 M sodium cyanoborohydride. The covalently linked product, SPION-NeutrAvidin (SPION-NA), was filtered (Centricon Plus-100, Millipore Corp., Bedford, MA), dialyzed against a 20× volume of sodium citrate buffer (25 mM, pH 8.0) and stored in amber vials at 4°C.
The antisense sODN (cfos, 5′-catcatggtcgtggtttgggcaaacc-3′) with sequence complementary to c-fos mRNA at nucleotides 115 to 140 (GenBank accession No. X06769, locus rncfos) was purified using polyacrylamide gel electrophoresis. To trace sODN-cfos uptake, we labeled the 3′-OH terminus of cfos with digoxigenin–deoxyuracil triphosphate, generating 5′-biotin-sODN-cfos-3′-digoxigenin with terminal transferase (Roche Applied Sciences, Indianapolis, IN). The biotinylated oligo-3′-digoxigenin was purified using a dextran column for biotinylated oligo DNA (Roche Applied Sciences) and stored at −20°C.28 SPION-NA (250 nmol Fe) was incubated with the biotinylated sODN (1 nmol) at 4°C for at least 30 minutes; lipofectin (1 mg/mL, Invitrogen Life Technologies, San Diego, CA), shown to facilitate sODN uptake,28 was added prior to infusion. The resulting conjugate is abbreviated as SPION-cfos.
Animal Surgical Procedures
Apoptosis Induction
All procedures and animal care practices adhered strictly to the Association for the Assessment and Accreditation of Laboratory Animal Care, Society for Neuroscience, and institutional guidelines for experimental animal health, safety, and comfort. After anesthetizing male C57Black6 mice (24 ± 3 g; Taconic Farm, Germantown, NY) with a mixture of ketamine (80 mg/kg, intraperitoneally) and xylazine (12 mg/kg, intraperitoneally), we made a midline ventral incision in the neck. Both common carotid arteries were isolated, freed of nerve fibers, and occluded for 60 minutes using nontraumatic aneurysm clips (Fine Science Tools, Inc., Foster City, CA). The occlusion was released for reperfusion as described previously.3 Complete occlusion (no blood flow) or blood flow restoration was directly observed under a surgical microscope (Zeiss OPMI-6, Carl Zeiss Microimaging, Inc., Thornwood, NY). Sham-operated (SO) animals underwent the same surgical procedure except for actual execution of artery occlusion. The skin was closed with sutures, and the animals were returned to the same cage for 1 week before SPION-cfos probe delivery. Body temperature was monitored and maintained at 37 ± 1°C throughout surgery and the immediate postoperative period, until the animals recovered fully from anesthesia. The mortality rate with this model was 12%; all deaths occurred in animals with reperfusion of 16 to 48 hours. The mortality rate was similar to that reported in mice.3,33
Delivery of Contrast Conjugates
We selected intracerebroventricular (ICV) delivery to the left ventricular space because we found that circulation of the cerebrospinal fluid in the ventricular space distributes the probe more evenly than intracerebral injection directly to the hippocampus or cortex.28 Animals were anesthetized (as described above) and positioned in a stereotaxic device (Stoelting, Wood Dale, IL). SPION-cfos was delivered to the brain via ICV infusion to the left cerebral ventricles at a dose of 0.08 mg Fe/kg body weight in 2 μL sodium citrate solution (25 mM). The dose was one order of magnitude lower than the 1.1 mg Fe/kg nontoxic dose used in humans.34 The spatial coordinates of the ICV infusion site were left to right, −1.0 mm; anterior to posterior, −0.4 mm; dorsal to ventral, −3.0 mm, referenced to the bregma.
Histology and Molecular Biological Assay
Postmortem Tissue Preparation
Animals were anesthetized as described above and transcardially perfused with 15 mL heparinized saline at a rate of 5 mL/min and then with 15 mL freshly prepared paraformaldehyde (4%) in 0.1 M phosphate-buffered saline (PBS, pH 7.4) at the same rate. The brains were removed from the animals' skulls and kept overnight in paraformaldehyde solution at 4°C. The following day, the brains were placed in 20% sucrose-PBS solution for more than 8 hours. Brains were either immediately scanned with magnetic resonance microscopy in a 14-Tesla magnetic resonance imaging system or processed for paraffin block preparation.35 Postmortem tissue samples were prepared 1 or 3 days after infusion (specified in the Results), and coronal tissue slices (20 or 100 μm) were prepared from paraffin-embedded blocks.21
Immunohistochemical and Iron Staining
To examine the distribution of sODN-cfos-digoxigenin in the brain tissue, we used fluorescein isothiocyanate (FITC)-labeled immunoglobin G (IgG) against digoxigenin (FITC-IgG × dig). Fluorescence was detected with a mercury light source and a filter with a 495 nm broad spectrum suitable for wavelengths of 470 nm (excitation) and 525 nm (emission); we captured images with a SPOT 1 digital camera (Diagnostic Instruments, Detroit, MI) mounted on an Olympus BX-51 microscope.35 We used terminal UTP nick-end labeling (TUNEL) staining (Apop-Tag Detection Kit, Oncor, Gaithersburg, MD) to determine cell death.3 To detect intracellular iron particles, we stained the brain tissue of an adjacent tissue slice with histologic stains commonly used for detection of intracellular iron: Prussian blue with 2% potassium ferrocyanide in 2% HCl (Perl's method) and nuclear fast red, a nucleus counterstain (Fisher Chem. Co., Houston, TX).
Necrosis and Edema of the Brain after BCAO
The cytotoxicity of BCAO simulating cardiac arrest was confirmed by 2,3,5-triphenyltetrazolium chloride (TTC) assessment.36,37 Brain edema was identified by hyperintensity in DWI and reduced apparent diffusion coefficients (ADCs) in the same region, that is, when the ADC in the hyperintense region was reduced to 2 SD below the average ADC in normal brains. See the MRI protocol below for a description of DWI and ADC acquisition.
MRI Protocol
In vivo image acquisition was performed with 9.4-Tesla MRI (Bruker Avance system, Bruker Biospin MRI, Inc., Billerica, MA) at different postinfusion time points. Animals were anesthetized with 2% halothane in pure O2 (800 mL/min flow rate), and blood oxygenation levels were monitored by pulse oximetry. A 1-inch surface coil was used for excitation and signal detection. We used serial gradient echo (GE) images with a constant repetition time (TR = 500 milliseconds) and incremental echo spacing (TE = 3, 4, 6 milliseconds) to construct R2* maps (R2* = 1/T2*) for a 500 μm–thick slice at a resolution of 120 μm in the image plane.
We acquired DWI and ADC with the following sequence: TR/TE = 3,000/27 ms, b = 154, 1,160 s/mm2, 180 × 180 μm2 in-plane resolution, and 1 mm slice thickness for assessment of tissue injury. Images at b = 1,160 (DWI) and maps of the ADC were calculated using a pixelwise linear fitting algorithm based on a monoexponential (exp) equation S = So × exp (−b × ADC), where S is the signal intensity of the images.
Postmortem image acquisition was performed using a 14-Tesla MRI scanner (Bruker Avance system, Bruker Biospin MRI, Inc.). We immersed the brains in 1 cm nuclear magnetic resonance (NMR) tubes in perfluoro compound solution FC-40 to eliminate background proton signals. We used a 1 cm volume coil and a fast low-angle shot (FLASH) gradient echo sequence to obtain three-dimensional high-resolution MRIs (TR/TE = 50/18 ms, 40 × 40 × 40 μm3, flip angle 20°).
Subtraction Maps and Data Analysis
We coregistered the MRIs and computed the mean R2* maps of SO and BCAO-treated animals using in-house software (Martinos Center for Biomedical Imaging at Massachusetts General Hospital). Corresponding brain slices were subtracted (CI minus SO) and the percent decrease in R2* was computed. We chose to use the R2* values, defined as the inverse of T2* values. A computer-generated color scale in negative values, ranging from −10 to −50%, is presented for reference. Approximate outlines of the hippocampus were drawn from rapid acquisition with relaxation enhancement (RARE) anatomic images and transposed onto the color-coded subtraction map for anatomic reference. The subtraction R2* map minimized possible artifact stemming from the position of the surface coil in both groups. We selected magnetic resonance slices from the MRI data of each animal group (0.7 to −2.7 mm, relative to bregma) for t-test statistical analysis but avoided slices with partial-volume artifacts in regions close to the olfactory bulbs and the nose.
Results
Cell Death after CI Simulating Cardiac Arrest in C57Black6 Mice
We compared (1) DNA fragmentation in postmortem samples and (2) DWI in live C57Black6 mice (n > 4 each group) after BCAO-induced CI or SO (see Figure 2A for the protocol). We observed that BCAO induces DNA fragmentation as early as 1 day of reperfusion in the hippocampus and cortex and that the areas with TUNEL-positive nuclei included the dentate gyrus (DG) and pyramidal cell layer of the cornu Ammonis (CA) fields. Figure 2, B and C, compare TUNEL-negative and TUNEL-positive nuclei in the CA3 region of the hippocampus of SO and BCAO-induced animals, respectively. DNA fragmentation also occurs in the cortex and striatum (Figure 2, D and G). Because they have no antigen for glial fibrillary acidic protein, cells showing DNA fragmentation were identified as neurons (Figure 2, E and F). Figure 2F shows gliosis-reactive glia; astrocyte enlargement can be identified near the apoptotic neuron (arrow), around vessel walls, and near ventricular walls. In some animals, a certain portion of neurons in the CA1 formation did not show DNA fragmentation 1 day after BCAO (box, Figure 2D). Neurons both with and without neuropeptide Y are vulnerable to DNA fragmentation (Figure 2, G and H).
Figure 2.
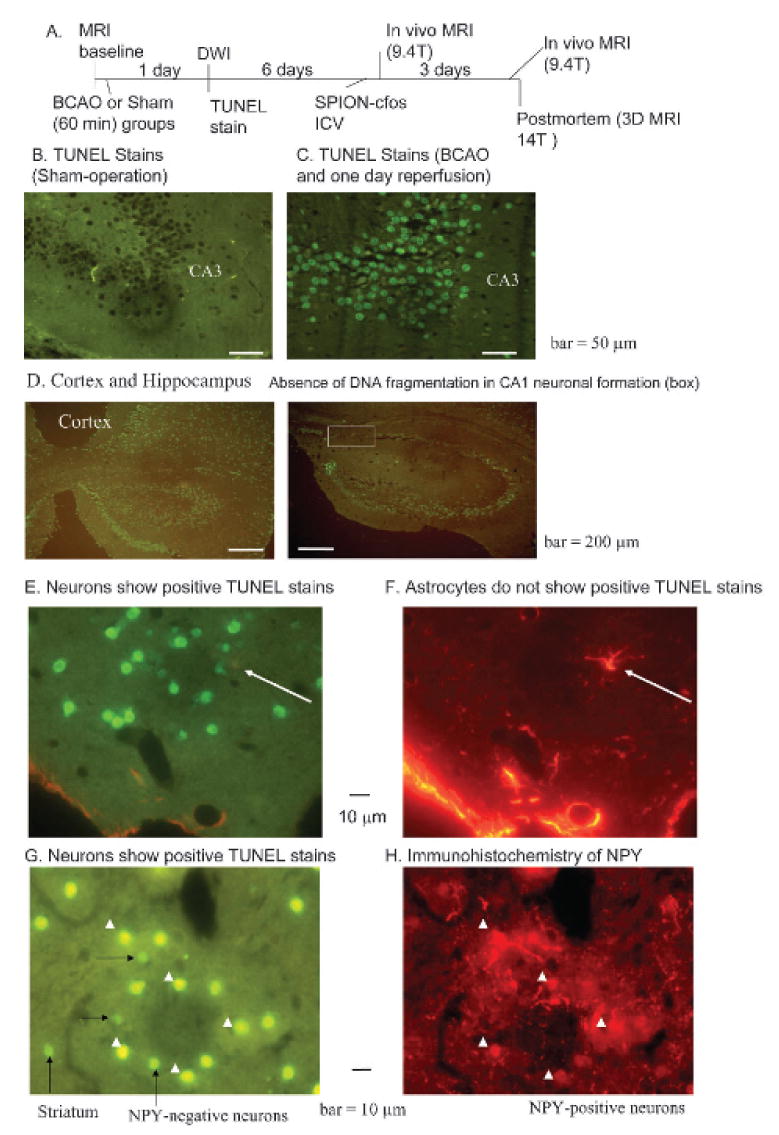
Detection of neuronal death using terminal UTP nick-end label (TUNEL) assay. A, Schematic of the experimental protocol. B–E and G, TUNEL staining of postmortem samples obtained 1 day after bilateral carotid artery occlusion (BCAO) of 60 minutes. Positive TUNEL stain (green) shows deoxyribonucleic acid (DNA) fragmentation in neuronal nuclei (C, D, E, and G); no TUNEL stain was observed in neurons of sham-operated animals (B) and in cells with astrocyte-specific glial fibrillary acidic protein (red in F). E and F show dual stains in the same tissue section in an animal treated with BCAO. Arrows show a reactive astrocyte near several dying neurons. G and H show dual stains as in E and F, except neurons were identified using antibodies against neuropeptide Y (NPY) in the same tissue section from the striatum. These panels show NPY-positive (arrowheads) and NPY-negative (long arrows) neurons, along with dying neurons with diminished NPY antigen (short arrows). ICV = intracerebroventricular; MRI = magnetic resonance imaging.
DWI, along with ADC, identifies small alternations in tissue and indicates regional diffusion of water molecules resulting from metabolic effects of CI. DWI is a sensitive marker for edema induced by stroke episodes in humans.38 We detected hyperintensity using DWI and constructed maps of the ADC in each live animal treated with either transient 60-minute BCAO or SO; we observed that changes in DWI and ADC were detectable 10 hours post-treatment in all animals after BCAO of 60 minutes. DWI hyperintensity was found to occur concurrently with ADC reduction in the striatum and septal nucleus at 1 day of reperfusion (Figure 3A). Nearly half of the animals treated with BCAO showed edema in the thalamus and hypothalamus, either at 1 day of reperfusion (not shown) or at 7 days (arrows, Figure 3B). Because cortical regions did not show focal abnormalities on DWI (see Figure 3A) but statistical analysis revealed ADC reduction (Figure 3C), we identified cortical edema by comparing ADC. We observed no necrosis with 2,3,5-TTC assessment in 10 of 11 BCAO-treated animals that showed edema (not shown). DWI (and reduction in ADC) did not allow us to conclude that hippocampal damage had occurred, although we did observe DNA fragmentation using the TUNEL assay in these regions (see Figure 2C).
Figure 3.
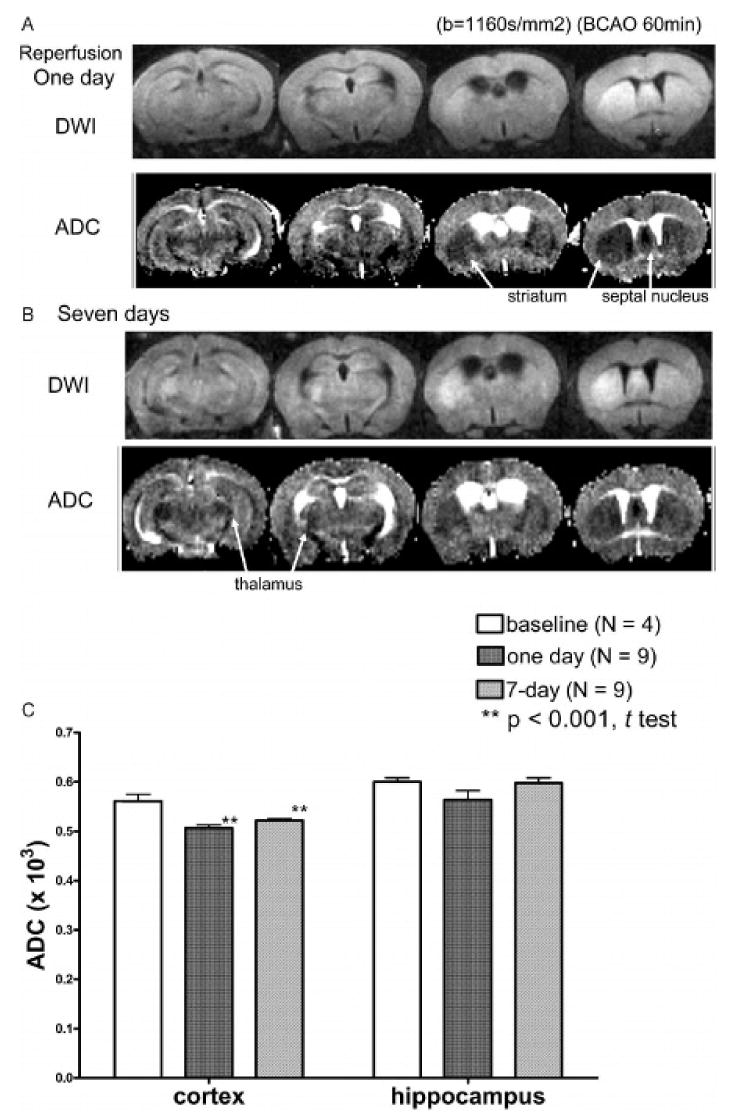
Comparison of diffusion-weighted imaging (DWI) and apparent diffusion coefficient (ADC) between bilateral carotid artery occlusion (BCAO) and sham-operated animals at two time points: DWIs and ADC were obtained from animals 1 (A) and 7 (B) days after treatment with BCAO of 60 minutes. The ADCs (mean ± SD) in sham-operated (baseline) animals were 0.57 ± 0.01 × 10⁻³ and 0.61 ± 0.01 × 10⁻³ for the cortex and the hippocampus, respectively. Regions with edema can be identified by comparing the ADC of the 1- and 7-day time points with baseline ADC (C). Edema, identified by visual inspection of DWI hyperintensity and reduced ADC, occurred in the striatum and septal nucleus in all animals but in the thalamus and hypothalamus of only four of nine animals.
SPION-cfos Uptake in Live Animals
Living brain cells have been shown to take up and retain SPION-cfos.39 We aimed to demonstrate differential retention of SPION-cfos in living and dead neurons. We first demonstrated delivery of SPION-cfos or SPION to the left cerebral ventricle (ICV delivery to the ipsilateral ventricle) and acquired MRI 1 day later. Compared with both the preinfusion baseline and animals that received unconjugated SPION, we observed that live animals infused with SPION-cfos exhibited bilateral signal reduction (caused by the presence of SPION-cfos in the brain) in T2*-weighted MRIs along the ventricular wall 1 day after infusion. We observed similar signal reduction in the ipsilateral and contralateral ventricles, suggesting that this delivery method causes the probe to mix with the cerebrospinal fluid in the ventricular space. T2* signal reduction also appeared in the parenchyma of the lateral and third ventricles in living mice; the presence of SPION-cfos in the lateral ventricles on the first day was strong and produced a T1 effect between the parenchyma and ventricle (white rings around the ventricle, Figure 4B). Susceptibility artifacts attributable to the air-tissue interface were observed near the ear canals and trachea in the lower portions of all images (long arrows, Figure 4, A–C). Because these artifacts do not directly represent SPION-induced signal reduction in the brain tissue and may bias data analysis in the mouse brain, they are not included in subsequent data analysis. This observation also provided a rationale for comparing SPION uptake in the hippocampus and somatosensory cortex to avoid regions with susceptibility artifacts.
Figure 4.
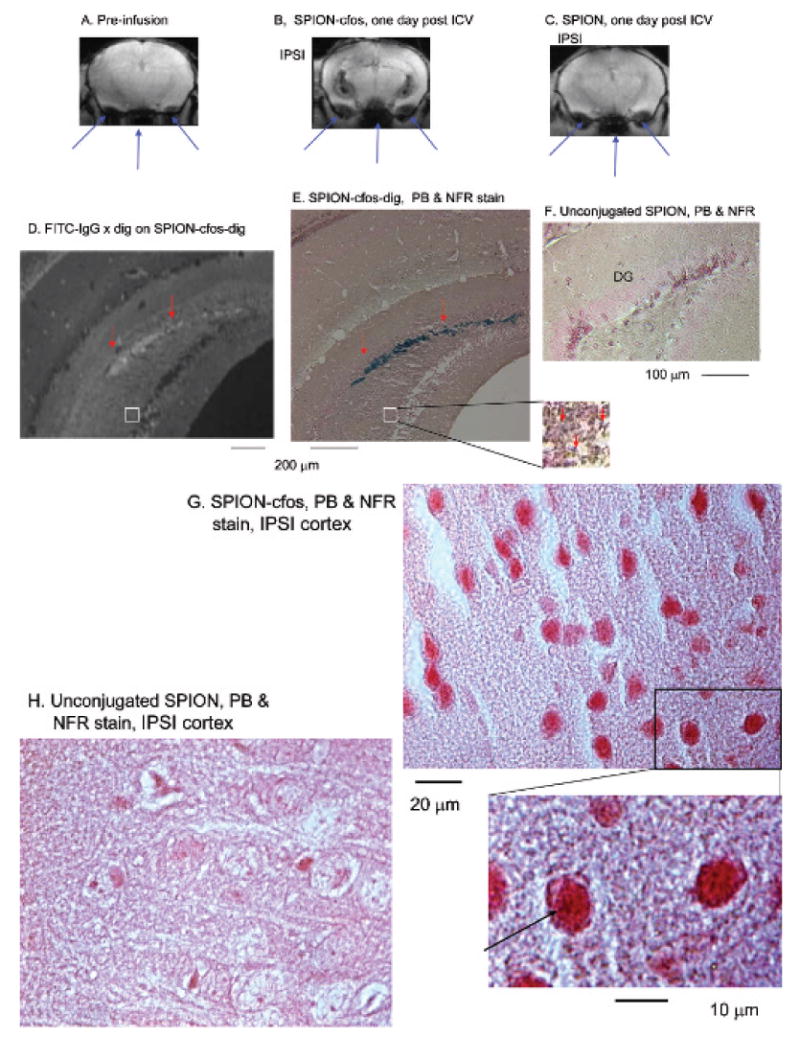
Colocalization of single-stranded phosphorothioate-modified oligodeoxynucleotide (sODN)-cfos and iron oxide in the ipsilateral hippocampus of a mouse 1 day after infusion of SPION-cfos. Animals were infused with SPION-cfos-digoxigenin (Fe = 0.08 mg/kg, n = 3). A to C show T2*-weighted images of preinfusion baseline, SPION-cfos-digoxigenin, and SPION-infused brains 1 day after infusion in live animals. Long arrows (pointed upward) point to the tissue-air interface from the trachea and ears. Images were produced using a 9.4 T magnetic resonance imaging (MRI) system. Histology of SPION uptake was acquired in postmortem brain samples after MRI. These brain sections were 10 μm in thickness. D shows fluorescein isothiocyanate (FITC)-antidigoxigenin antibodies (white fluorescent staining) on cfos-digoxigenin in the dentate gyrus (DG). Iron oxide was detected in a similar area of the adjacent brain section using Prussian blue (PB) stain and nuclear fast red (NFR) counterstain (E–H). F shows the PB stains of the SPION-infused brain sample. Short arrows (pointed down) indicate colocalization of iron oxide detected by PB stain. G and H show the cortices. ICV = intracerebroventricular; IPSI = ipsilateral to the infusion site.
To reveal the presence of SPION-cfos in brain regions where we detected magnetic resonance signal reduction, we collected postmortem samples 1 day after ICV delivery of SPION-cfos-digoxigenin. We observed positive FITC-IgG × dig in the locations where we also observed positive sODN-cfos-digoxigenin staining (short arrows, Figure 4D) and iron oxide staining (short arrows, Figure 4E). We also observed minute intracellular iron particles in the neuronal formation (the DG) of the hippocampus (Figure 4E, insert) and in the cortex (Figure 4G). No such staining was observed in the hippocampus and cortex when unconjugated SPION was delivered (Figure 4, F and H).
Normal Temporal Profile of Cerebral SPION-cfos
We compared SPION-cfos retention 1, 2, 3, and 6 days post–ICV infusion. Figure 5 reveals that R2* in the hippocampus and somatosensory cortex of the contralateral hemisphere continued to increase for 3 days and then decreased toward baseline values on the sixth day. We therefore decided that assessment of probe retention 3 days after SPION-cfos infusion at the 0.08 mg Fe/kg dose was appropriate for subsequent studies.
Figure 5.
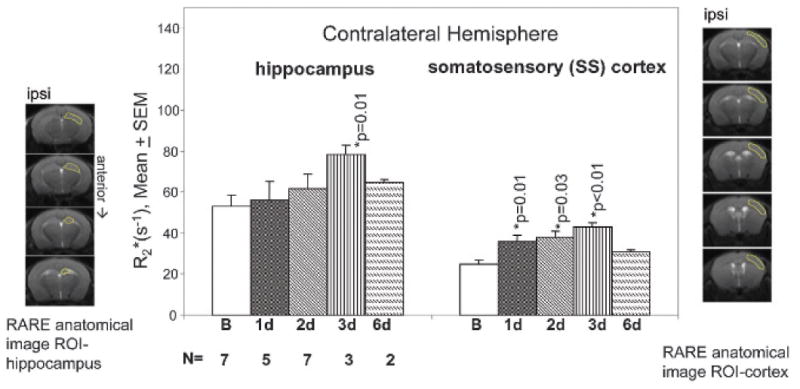
In vivo R2* profile in two contralateral brain regions of the brain. Regions of interest (ROI) were outlined in the panels to the left (hippocampus) and right (somatosensory [SS] cortex) of the bar graph. Progressive elevation of R2* in both brain regions was observed for 3 days. Hippocampal regions reached plateau at 3 days (p = .01), whereas the SS cortex exhibited significant elevations at 1, 2, and 3 days (p ≤ .03). R2* values in both regions decreased to the baseline on day 6, suggesting washout (clearance) of the probe. SEM = standard error of measurement.
Hippocampal and Cortical Regions with Cell Death Show Less SPION Retention
We aimed to test the application of our SPION-cfos probe for detection of dead cells in live animals. We first showed that the probe was retained in the brains of SO animals. Because cerebral apoptosis in this model occurred mostly in neurons, we focused our comparison of MRIs in the hippocampus, where the distinctive neuronal formations of the DG and CA could be identified.
Analysis of the R2* Maps in Live Animals after Stroke
In vivo MRI was performed in both SO and CI-treated animals 3 days after ICV infusion of SPION-cfos. Figure 6A compares the GE MRIs (TR/TE = 500/6 ms) and maps of animals that received CI and SO. We found that the brain images of SO animals exhibited greater signal reduction in T2* maps of the cortex and hippocampus than did the brain images of CI animals. The SO group exhibits higher R2* values than the CI group. Cortical and hippocampal R2* in the subtraction map are decreased by more than 20% (Figure 6B). We subsequently obtained R2* values for these regions of interest in each animal for statistical analysis. Unlike the images acquired 1 day after ICV infusion (see Figure 4B), we observed no T1 effect attributable to localized high concentration of SPION-cfos 3 days post–ICV infusion for either CI or SO animals.
Figure 6.
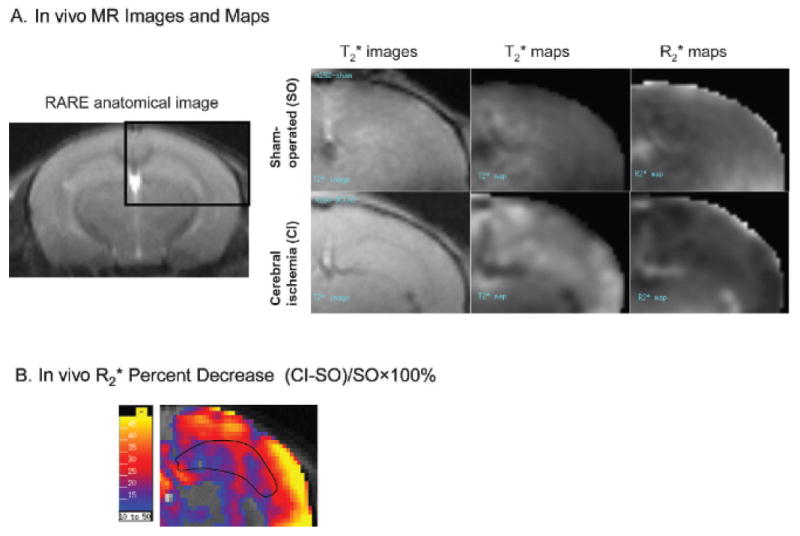
Apoptotic hot spots as determined by in vivo R2* maps. A shows a RARE image (rapid acquisition with relaxation enhancement; TR/TE = 7,000/26 ms, RARE factor = 8, number of averaging = 2) that depicts the anatomic reference from which T2* images, T2* and R2* maps of animal brains are shown to its right. B, A subtraction map shows percent decreases in R2* values in R2* maps of cerebral ischemia (CI)-treated animals compared with sham-operated (SO) animals. A computer-generated intensity scale for percent change is shown at the left. The outline of the hippocampus was referenced from the anatomic images in A and superimposed on subtraction R2* maps in B. The number of animals for subtraction R2* maps in B is listed in Figure 7.
Statistical Analysis in Live Mice
We observed that the SO group consistently exhibited significant R2* elevations in the hippocampus, indicating that in normal mice, cells in hippocampal regions are able to retain SPION-cfos probes 3 days after infusion (Figure 7). On comparing SPION retention in the CI and SO groups, we showed that the group treated with BCAO exhibited significantly lower R2*, from 100 to 60 s−1 in the cortex (p = .01, t-test) and from 80 to 60 s−1 in the hippocampus (p = .03, t-test).
Figure 7.
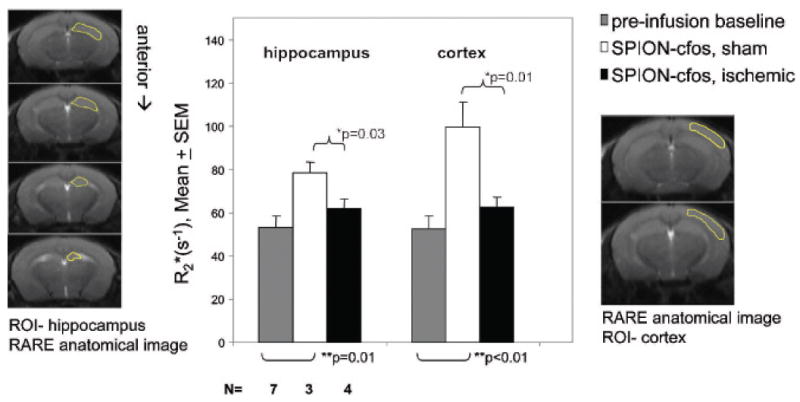
Profiles of superparamagnetic iron oxide nanoparticle (SPION) retention in R2* maps of three groups of animals. Probe retention in the ischemia-treated group is significantly lower than in the sham-operated group (t-test). No significant difference in retention was observed between baseline animals without SPION-cfos infusion and cerebral ischemia–treated animals with SPION-cfos infusion. The number of animals is given below the bar graph. The outlines of the hippocampus and cortex were referenced from the anatomic images and superimposed on individual R2* maps as regions of interest (ROI); R2* values within two ROIs of each animal were extracted from individual R2* maps as ROI-hippocampus and ROI-cortex for statistical analysis. Mean R2* and standard error (SEM) are shown. RARE = rapid acquisition with relaxation enhancement.
Magnetic Resonance Microscopy
We aimed to validate the potential application of this probe for detection of cerebral apoptosis in live animals. Figure 8, A and B, shows postmortem, high-resolution, T2*-weighted MRIs of the contralateral hemisphere in representative SO and BCAO-treated animals that received SPION-cfos infusion. Stronger magnetic resonance signal reduction, compared with baseline, in the ventricular space surrounding the hippocampus in both treatment groups (asterisks) suggests delivery of SPION-cfos to the brain. We observed that the presence of SPION-cfos correlated with signal reduction in the SO brain, especially in the well-defined DG and CA (arrows, Figure 8A); we observed less signal reduction in the cortex and in the neuronal formations of the DG and CA in MRIs of brains treated with CI (Figure 8B). In the CI brain, we also observed T2* signal reduction in the CA1 region (arrow, see Figure 8B), where neurons did not show positive TUNEL staining (box, see Figure 2D). This result suggests that T2* signal reduction represents retention of SPION-cfos and reflects the presence of live cells. In conclusion, we have demonstrated that the region lacking SPION retention capabilities is also the region that exhibits DNA fragmentation in the group treated with BCAO-induced CI. With further investigation, this probe may prove to have applications for neurologic disorders.
Figure 8.
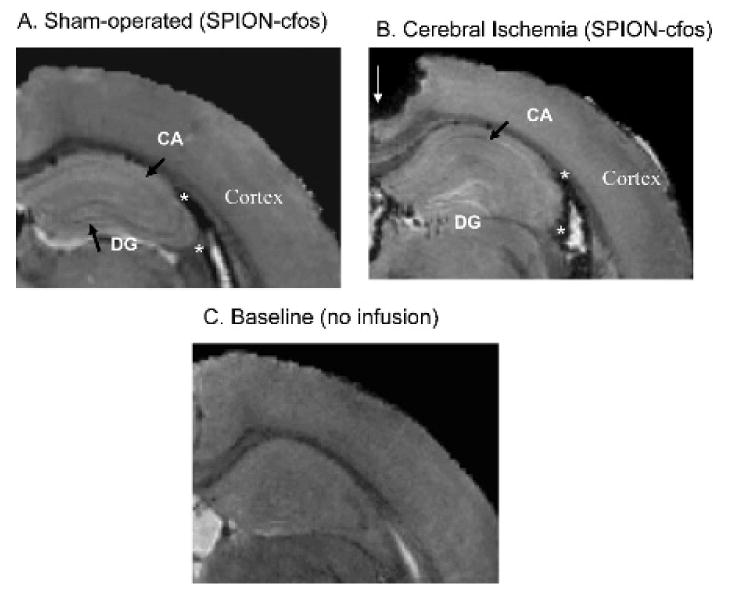
Less cerebral superparamagnetic iron oxide nanoparticle (SPION) retention in animals with stroke cerebral ischemia. Three-dimensional T2*-weighted images of postmortem brains collected 3 days after intracerebroventricular infusion of SPION-cfos and treatment with either sham operation (A) or bilateral carotid occlusion (B) for 60 minutes 1 week before. The hippocampus of the contralateral hemisphere is shown from one representative mouse in each group. Short arrows show the dentate gyrus (DG) and pyramidal cell layer (CA) neuronal formation in the hippocampus. C shows an animal brain without infusion. The signal void in the upper-left corner of B (thin arrow) was caused by missing tissue during brain sample handling. The number of animals is listed in Figure 7.
Discussion
We have described here detection of cortical and hippocampal lesions after global CI in live C57Black6 mice. We employed conventional DWI/ADC maps to detect brain edema and developed a transcription probe for MRI to assess neuronal status. After 60 minutes of BCAO, cerebral edema and neuronal death appeared in selectively vulnerable brain regions. Development of brain damage measured with DWI/ADC (cerebral edema) or neuronal death (DNA fragmentation or apoptosis) appears less defined than is often reported with focal stroke models. Most global CI models that simulate cardiac arrest are studied in gerbils,40 which have no functional collateral blood flow from the posterior communicating arteries known as the circle of Willis; therefore, the lesion produced by such models is considered somewhat different from what would be expected to occur in human brains. Other models have used asphyxiation in the rat to study cerebral edema using a conventional wet-to-dry weight ratio known to accurately reflect edema in the tissue.41 However, this model is less specific for regional reporting. Normalizing ADC can be a reliable indicator of edema.42
C57Black6 mice are an inbred strain with partial but functional posterior communicating arteries.4 BCAO-induced brain injury in the cortex and hippocampus of CD-1 and C57Black6 mice is correlated with the duration of BCAO and the patency of the circle of Willis.4,43 Cerebral damage in the human brain appears in selectively vulnerable brain regions such as the hippocampus, thalamus, frontal and parietal cortices, and cerebellum in patients who suffer comatose cardiac arrest.44 Others have described the most characteristic findings in MRI as symmetric lesions in the bilateral basal ganglia, thalami, and/or substantia nigra.2 Recall and recognition memory difficulties often accompany out-of-hospital cardiac arrest survivors,45 and significant memory impairment is associated with global cerebral atrophy.46 The vulnerable regions in mouse brains show some similarity to those in human brains after cardiac arrest. In our experimental animal models, the lesions after reperfusion appeared late (after more than 12 hours) in both DWI/ADC and DNA fragmentation tests. This result is consistent with the slow development of cerebral edema in humans after cardiac arrest,10,47 except that we did not observe hippocampal damage using DWI/ADC in mice.
Conventional methods for detection of apoptotic cells include assays on biopsy or autopsy samples, which are characterized by the presence of chromatin condensation, nuclear DNA fragmentation, expression of apoptosis-specific antigens, and apoptotic bodies.3,48–50 Well-established molecular biology methods such as TUNEL staining or DNA ladder assay have used postmortem samples to detect DNA fragmentation (an early process of apoptosis in most, if not all, cell types), although these assays give false-positive signal for cells in the S phase and cannot always give specific identification in cancer research and neurogenesis. Elevated levels of neuronal apoptosis in the central nervous system are associated with acute and chronic neurodegenerative diseases,51 but less invasive and specific detection is advantageous for targeted interventions.52 By labeling an sODN with sequence complementary to cfos mRNA of neuronal origin onto SPION, we have demonstrated a new class of magnetic resonance contrast agent that shows (1) the magnetic resonance signal reduction with an extended window for detection in live mouse brains, (2) a correlation between magnetic resonance assessment of SPION retention and histologic examination of iron and cfos uptake, and (3) retention of SPION-cfos as an active process in live cells of the brain. These properties of SPION-sODN illustrate the feasibility of their application for the identification of dying cells that escape DWI detection.
Muldoon and colleagues reported that unconjugated SPION (833 pmol/kg) is not retained in the brain beyond 3 hours53; however, studies of cells in culture for transplantation have shown that oligodendroglial cells take up an iron-based magnetic resonance contrast agent.54 DNA-based magnetic resonance contrast agents have been used to detect DNA cleaving activities in cellular extracts.55 We show here that SPION-cfos is retained in live animals for at least 3 days at a dose of 0.08 mg Fe/kg—one order of magnitude less than the dose Muldoon and colleagues reported.
Following ICV delivery, sODN with sequence complementary to c-fos mRNA (sODN of cfos) but without SPION has been histologically shown to initially attach to the ventricular wall and then appear in the parenchyma, where it binds to c-fos mRNA, its cellular target.21,35 We show the presence of SPION-cfos in the ventricular walls of the lateral and third ventricles; we also demonstrate with MRI its migration into the parenchyma in living mice (see Figure 4B). The result suggests that MRI is as sensitive as conventional histology and molecular biology detection methods.
The exact routes of probe uptake and distribution are not well understood, although they likely involve migration across a number of barriers such as the Virchow-Robins space, the perivascular lymphatic space between the vessels of the central nervous system, and the glial membrane on the brain surface between the parenchyma and ventricle wall. Using an MRI detection method, we have shown as a proof of concept that SPION-cfos is distributed and causes magnetic resonance signal reduction for more than 1 day. None of these observations were made in animals that received SPION without conjugation to sODN (see Figure 4).
The distribution of SPION-cfos in cerebral ventricles using the ICV delivery technique is different from the distribution observed using a viral vector.56,57 ICV infusion, a convection-enhanced delivery method,56 allows cerebrospinal fluid to distribute SPION-sODN in the brain. This delivery method represents an improvement over previously documented intracerebral or intra-axonal injection techniques58,59 as evidence of R2* elevation indicates that SPION-cfos migrates to the contralateral hemisphere, most likely through the cerebrospinal fluid circulation (see Figure 4B), to the ventricular wall and then through the perivascular space and/or axonal transport. The mechanism of such probe migration and transfer may involve more robust, although still unknown, pathways.
Although all types of brain cells reportedly take up sODN,60 we have shown that sODN of cfos binds to its cerebral mRNA target at the neuronal formation.21 Furthermore, our results from both in vivo and postmortem MRI studies indicate correspondence between cerebral retention of iron (see Figure 4, E and G) and magnetic resonance assessment (see Figures 4 to 8). The retention of SPION-cfos is shown to be driven by hybridization between sODN of SPION-cfos and neuronal c-fos mRNA.61 Our data in Figure 6 show higher SPION retention in the brains of animals that received SPION-cfos after SO compared with those that experienced BCAO. We have shown that ICV delivery does not destroy cerebral c-fos mRNA.21 Our results from current studies, showing that living cells retain SPION-cfos, are consistent with that report.
In this study, we observed colocalization of cfos and Prussian blue–stained iron 1 day after ICV SPION-cfos infusion (see Figure 4, D and E). No SPION retention was observed when a mixture of unlinked SPION and sODN was infused.39 Given that linked SPION-cfos survives infusion to and is retained by the brain, the sODN of SPION-cfos seems to serve as a carrier for SPION. Our results thus suggest that the stability of a heteroduplex between a cellular target and sODN of cfos is correlated with the stability of SPION-cfos in live brain cells. Because c-fos mRNA is minimally expressed in normal live neurons of the brain and cellular c-fos mRNA has a very short half-life, we expect very little target c-fos mRNA to be present in neurons that show DNA fragmentation 7 days after CI. In fact, we observed no retention in regions where we detected DNA fragmentation in ischemia-treated brains, specifically in the cortex and hippocampus.
In this proof-of-concept study, the ICV infusion method of delivering probe to the brain cells bypasses the blood-brain barrier to achieve robust distribution at a very low dose of the reporter probe and to reduce iron-related toxicity, if it exists. Although ICV infusion is not the ideal method of delivery, the ICV route is a very efficient way to deliver genes and stem cells in studies of gene therapies and neurogenesis, respectively. This probe may have applications in gene therapies and stem cell delivery, especially in experimental studies of animals, for which lumbar puncture is not a feasible option. This route may thus have viable applications, at least for the contralateral hemisphere, without requiring autopsy or tissue biopsy. Intravascular delivery might also be considered in other disease models in which the blood-brain barrier is disrupted, an important consideration for longitudinal studies at the cellular and molecular levels for drug discovery. In conclusion, using high-resolution MRI, immunohistochemistry, and histology, we have demonstrated the ability of our DNA-based magnetic resonance contrast probe to detect apoptotic cell death in the brain.
Acknowledgments
We thank Drs. A. de Crespigny, H. D'Arceuil, J. Mandeville, A. Moore, J. Marota, and D. Sosnovik for insightful discussion; Drs. G. Dai, C. Farrar, and C. M. Liu and Mr. J. Moore for excellent technical assistance; and Ms. N. Eusemann for excellent editing.
This project was supported by grants from the National Institute of Neurological Disorders and Stroke (R01NS45845) and the National Center for Research Resources (P41RR14075) and funds from the Mental Illness and Neuroscience Discovery (MIND) Institute and the A.A. Martinos Center for Biomedical Imaging.
References
- 1.Roine RO, Raininko R, Erkinjuntti T, et al. Magnetic resonance imaging findings associated with cardiac arrest. Stroke. 1993;24:1005–14. doi: 10.1161/01.str.24.7.1005. [DOI] [PubMed] [Google Scholar]
- 2.Fujioka M, Okuchi K, Sakaki T, et al. Specific changes in human brain following reperfusion after cardiac arrest. Stroke. 1994;25:2091–5. doi: 10.1161/01.str.25.10.2091. [DOI] [PubMed] [Google Scholar]
- 3.Liu PK, Hsu CY, Dizdaroglu M, et al. Damage, repair, and mutagenesis in nuclear genes after mouse forebrain ischemia-reperfusion. J Neurosci. 1996;16:6795–806. doi: 10.1523/JNEUROSCI.16-21-06795.1996. [DOI] [PMC free article] [PubMed] [Google Scholar]
- 4.Fujii M, Hara H, Meng W, et al. Strain-related differences in susceptibility to transient forebrain ischemia in SV-129 and C57black/6 mice. Stroke. 1997;28:1805–10. doi: 10.1161/01.str.28.9.1805. discussion 1811. [DOI] [PubMed] [Google Scholar]
- 5.Kitagawa K, Matsumoto M, Yang G, et al. Cerebral ischemia after bilateral carotid artery occlusion and intraluminal suture occlusion in mice: evaluation of the patency of the posterior communicating artery. J Cereb Blood Flow Metab. 1998;18:570–9. doi: 10.1097/00004647-199805000-00012. [DOI] [PubMed] [Google Scholar]
- 6.Yang G, Kitagawa K, Matsushita K, et al. C57BL/6 strain is most susceptible to cerebral ischemia following bilateral common carotid occlusion among seven mouse strains: selective neuronal death in the murine transient forebrain ischemia. Brain Res. 1997;752:209–18. doi: 10.1016/s0006-8993(96)01453-9. [DOI] [PubMed] [Google Scholar]
- 7.Huang D, Shenoy A, Cui J, et al. In situ detection of AP sites and DNA strand breaks bearing 3′-phosphate termini in ischemic mouse brain. Faseb J. 2000;14:407–17. doi: 10.1096/fasebj.14.2.407. [DOI] [PMC free article] [PubMed] [Google Scholar]
- 8.Lin LH, Cao S, Yu L, et al. Up-regulation of base excision repair activity for 8-hydroxy-2′-deoxyguanosine in the mouse brain after forebrain ischemia -reperfusion. J Neurochem. 2000;74:1098–105. doi: 10.1046/j.1471-4159.2000.741098.x. [DOI] [PMC free article] [PubMed] [Google Scholar]
- 9.Xiao F, Arnold T, Zhang S, et al. Matrix metalloproteinases are not involved in early brain edema formation after cardiac arrest in rats. Acta Neurochir Suppl. 2003;86:75–8. doi: 10.1007/978-3-7091-0651-8_17. [DOI] [PubMed] [Google Scholar]
- 10.Back T, Hemmen T, Schuler OG. Lesion evolution in cerebral ischemia. J Neurol. 2004;251:388–97. doi: 10.1007/s00415-004-0399-y. [DOI] [PubMed] [Google Scholar]
- 11.Schellenberger EA, Reynolds F, Weissleder R, Josephson L. Surface-functionalized nanoparticle library yields probes for apoptotic cells. Chembiochemistry. 2004;5:275–9. doi: 10.1002/cbic.200300713. [DOI] [PubMed] [Google Scholar]
- 12.van Tilborg G, Mulder WJM, Deckers Niko, et al. Annexin A5-functionalized bimodal lipid-based contrast agents for the detection of apoptosis. Bioconjug Chem. 2006;17:741–9. doi: 10.1021/bc0600259. [DOI] [PubMed] [Google Scholar]
- 13.van Engeland M, Nieland LJ, Ramaekers FC, et al. Annexin V-affinity assay: a review on an apoptosis detection system based on phosphatidylserine exposure. Cytometry. 1998;31:1–9. doi: 10.1002/(sici)1097-0320(19980101)31:1<1::aid-cyto1>3.0.co;2-r. [DOI] [PubMed] [Google Scholar]
- 14.Fadok VA, de Cathelineau A, Daleke DL, et al. Loss of phospholipid asymmetry and surface exposure of phosphatidyl-serine is required for phagocytosis of apoptotic cells by macrophages and fibroblasts. J Biol Chem. 2001;276:1071–7. doi: 10.1074/jbc.M003649200. [DOI] [PubMed] [Google Scholar]
- 15.Reutelingsperger CP, Dumont E, Thimister PW, et al. Visualization of cell death in vivo with the annexin A5 imaging protocol. J Immunol Methods. 2002;265:123–32. doi: 10.1016/s0022-1759(02)00075-3. [DOI] [PubMed] [Google Scholar]
- 16.Schellenberger EA, Hogemann D, Josephson L, Weissleder R. Annexin V-CLIO: a nanoparticle for detecting apoptosis by MRI. Acad Radiol. 2002;9(Suppl 2):S310–1. doi: 10.1016/s1076-6332(03)80212-x. [DOI] [PubMed] [Google Scholar]
- 17.Blankenberg F, Mari C, Strauss HW. Imaging cell death in vivo. Q J Nucl Med. 2003;47:337–48. [PubMed] [Google Scholar]
- 18.Blankenberg FG, Katsikis PD, Tait JF, et al. In vivo detection and imaging of phosphatidylserine expression during programmed cell death. Proc Natl Acad Sci U S A. 1998;95:6349–54. doi: 10.1073/pnas.95.11.6349. [DOI] [PMC free article] [PubMed] [Google Scholar]
- 19.D'Arceuil H, Rhine W, de Crespigny A, et al. 99mTc annexin V imaging of neonatal hypoxic brain injury. Stroke. 2000;31:2692–700. doi: 10.1161/01.str.31.11.2692. [DOI] [PubMed] [Google Scholar]
- 20.Chiasson BJ, Hooper ML, Murphy PR, Robertson HA. Antisense oligonucleotide eliminates in vivo expression of c-fos in mammalian brain. Eur J Pharmacol. 1992;227:451–3. doi: 10.1016/0922-4106(92)90167-t. [DOI] [PubMed] [Google Scholar]
- 21.Liu PK, Salminen A, He YY, et al. Suppression of ischemia-induced fos expression and AP-1 activity by an antisense oligodeoxynucleotide to c-fos mRNA. Ann Neurol. 1994;36:566–76. doi: 10.1002/ana.410360405. [DOI] [PMC free article] [PubMed] [Google Scholar]
- 22.Konradi C, Cole RL, Heckers S, Hyman SE. Amphetamine regulates gene expression in rat striatum via transcription factor CREB. J Neurosci. 1994;14:5623–34. doi: 10.1523/JNEUROSCI.14-09-05623.1994. [DOI] [PMC free article] [PubMed] [Google Scholar]
- 23.Morrow BA, Elsworth JD, Inglis FM, Roth RH. An antisense oligonucleotide reverses the footshock-induced expression of fos in the rat medial prefrontal cortex and the subsequent expression of conditioned fear-induced immobility. J Neurosci. 1999;19:5666–73. doi: 10.1523/JNEUROSCI.19-13-05666.1999. [DOI] [PMC free article] [PubMed] [Google Scholar]
- 24.Zhang Y, Widmayer MA, Zhang B, et al. Suppression of post-ischemic-induced fos protein expression by an antisense oligonucleotide to c-fos mRNA leads to increased tissue damage. Brain Res. 1999;832:112–7. doi: 10.1016/s0006-8993(99)01459-6. [DOI] [PubMed] [Google Scholar]
- 25.Zhang M, Miller C, He Y, et al. Calphostin C induces AP1 synthesis and AP1-dependent c-jun transactivation in normal human chondrocytes independent of protein kinase C-alpha inhibition: possible role for c-jun N-terminal kinase. J Cell Biochem. 1999;76:290–302. doi: 10.1002/(sici)1097-4644(20000201)76:2<290::aid-jcb12>3.0.co;2-v. [DOI] [PubMed] [Google Scholar]
- 26.Tolliver BK, Sganga MW, Sharp FR. Suppression of c-fos induction in the nucleus accumbens prevents acquisition but not expression of morphine-conditioned place preference. Eur J Neurosci. 2000;12:3399–406. doi: 10.1046/j.1460-9568.2000.00214.x. [DOI] [PubMed] [Google Scholar]
- 27.Sagar AD, Briggs WR, Thompson WF. Nuclear-cytoplasmic partitioning of phytochrome-regulated transcripts in Pisum sativum. Plant Physiol. 1988;88:1397–402. doi: 10.1104/pp.88.4.1397. [DOI] [PMC free article] [PubMed] [Google Scholar]
- 28.Cui JK, Hsu CY, Liu PK. Suppression of postischemic hippocampal nerve growth factor expression by a c-fos antisense oligodeoxynucleotide. J Neurosci. 1999;19:1335–44. doi: 10.1523/JNEUROSCI.19-04-01335.1999. [DOI] [PMC free article] [PubMed] [Google Scholar]
- 29.Kabnick KS, Housman DE. Determinants that contribute to cytoplasmic stability of human c-fos and beta-globin mRNAs are located at several sites in each mRNA. Mol Cell Biol. 1988;8:3244–50. doi: 10.1128/mcb.8.8.3244. [DOI] [PMC free article] [PubMed] [Google Scholar]
- 30.Lind K, Kresse M, Debus NP, Muller RH. A novel formulation for superparamagnetic iron oxide (SPIO) particles enhancing MR lymphography: comparison of physicochemical properties and the in vivo behaviour. J Drug Target. 2002;10:221–30. doi: 10.1080/10611860290022651. [DOI] [PubMed] [Google Scholar]
- 31.Shen T, Weissleder R, Papisov M, et al. Monocrystalline iron oxide nanocompounds (MION): physicochemical properties. Magn Reson Med. 1993;29:599–604. doi: 10.1002/mrm.1910290504. [DOI] [PubMed] [Google Scholar]
- 32.Marshall JJ, Rabinowitz ML. Preparation and characterization of a dextran-trypsin conjugate. J Biol Chem. 1976;251:1081–7. [PubMed] [Google Scholar]
- 33.Barone FC, Knudsen DJ, Nelson AH, et al. Mouse strain differences in susceptibility to cerebral ischemia are related to cerebral vascular anatomy. J Cereb Blood Flow Metab. 1993;13:683–92. doi: 10.1038/jcbfm.1993.87. [DOI] [PubMed] [Google Scholar]
- 34.Saini S, Sharma R, Baron RL, et al. Multicentre dose-ranging study on the efficacy of USPIO ferumoxtran-10 for liver MR imaging. Clin Radiol. 2000;55:690–5. doi: 10.1053/crad.2000.0504. [DOI] [PubMed] [Google Scholar]
- 35.Cui J, Holmes EH, Liu PK. Oxidative damage to the c-fos gene and reduction of its transcription after focal cerebral ischemia. J Neurochem. 1999;73:1164–74. doi: 10.1046/j.1471-4159.1999.0731164.x. [DOI] [PMC free article] [PubMed] [Google Scholar]
- 36.Bederson JB, Pitts LH, Germano SM, et al. Evaluation of 2,3,5-triphenyltetrazolium chloride as a stain for detection and quantification of experimental cerebral infarction in rats. Stroke. 1986;17:1304–8. doi: 10.1161/01.str.17.6.1304. [DOI] [PubMed] [Google Scholar]
- 37.Lin TN, He YY, Wu G, et al. Effect of brain edema on infarct volume in a focal cerebral ischemia model in rats. Stroke. 1993;24:117–21. doi: 10.1161/01.str.24.1.117. [DOI] [PubMed] [Google Scholar]
- 38.Moseley ME, de Crespigny AJ, Roberts TP, et al. Early detection of regional cerebral ischemia using high-speed MRI. Stroke. 1993;24(12 Suppl):I60–5. [PubMed] [Google Scholar]
- 39.Liu CH, Kim YR, Ren JQ, et al. Imaging cerebral gene transcripts in live animals. J Neurosci. 2007;27:713–22. doi: 10.1523/JNEUROSCI.4660-06.2007. [DOI] [PMC free article] [PubMed] [Google Scholar]
- 40.Lythgoe MF, Thomas DL, King MD, et al. Gradual changes in the apparent diffusion coefficient of water in selectively vulnerable brain regions following brief ischemia in the gerbil. Magn Reson Med. 2005;53:593–600. doi: 10.1002/mrm.20372. [DOI] [PubMed] [Google Scholar]
- 41.Xiao F, Zhang S, Arnold TC, et al. Mild hypothermia induced before cardiac arrest reduces brain edema formation in rats. Acad Emerg Med. 2002;9:105–14. doi: 10.1111/j.1553-2712.2002.tb00224.x. [DOI] [PubMed] [Google Scholar]
- 42.Fischer M, Bockhorst K, Hoehn-Berlage M, et al. Imaging of the apparent diffusion coefficient for the evaluation of cerebral metabolic recovery after cardiac arrest. Magn Reson Imaging. 1995;13:781–90. doi: 10.1016/0730-725x(95)00030-k. [DOI] [PubMed] [Google Scholar]
- 43.Murakami K, Kondo T, Kawase M, Chan PH. The development of a new mouse model of global ischemia: focus on the relationships between ischemia duration, anesthesia, cerebral vasculature, and neuronal injury following global ischemia in mice. Brain Res. 1998;780:304–10. doi: 10.1016/s0006-8993(97)01217-1. [DOI] [PubMed] [Google Scholar]
- 44.Wijdicks EF, Campeau NG, Miller GM. MR imaging in comatose survivors of cardiac resuscitation. AJNR Am J Neuroradiol. 2001;22:1561–5. [PMC free article] [PubMed] [Google Scholar]
- 45.Drysdale EE, Grubb NR, Fox KA, O'Carroll RE. Chronicity of memory impairment in long-term out-of-hospital cardiac arrest survivors. Resuscitation. 2000;47:27–32. doi: 10.1016/s0300-9572(00)00194-5. [DOI] [PubMed] [Google Scholar]
- 46.Grubb NR, Fox KA, Smith K, et al. Memory impairment in out-of-hospital cardiac arrest survivors is associated with global reduction in brain volume, not focal hippocampal injury. Stroke. 2000;31:1509–14. doi: 10.1161/01.str.31.7.1509. [DOI] [PubMed] [Google Scholar]
- 47.Schulman SP, Hartmann TK, Geocadin RG. Intensive care after resuscitation from cardiac arrest: a focus on heart and brain injury. Neurol Clin. 2006;24:41–59. vi. doi: 10.1016/j.ncl.2005.11.002. [DOI] [PubMed] [Google Scholar]
- 48.Lipton P. Ischemic cell death in brain neurons. Physiol Rev. 1999;79:1431–568. doi: 10.1152/physrev.1999.79.4.1431. [DOI] [PubMed] [Google Scholar]
- 49.Czarnota GJ, Kolios MC, Abraham J, et al. Ultrasound imaging of apoptosis: high-resolution non-invasive monitoring of programmed cell death in vitro, in situ and in vivo. Br J Cancer. 1999;81:520–7. doi: 10.1038/sj.bjc.6690724. [DOI] [PMC free article] [PubMed] [Google Scholar]
- 50.Allera C, Lazzarini G, Patrone E, et al. The condensation of chromatin in apoptotic thymocytes shows a specific structural change. J Biol Chem. 1997;272:10817–22. doi: 10.1074/jbc.272.16.10817. [DOI] [PubMed] [Google Scholar]
- 51.Kudo T. Involvement of unfolded protein responses in neurodegeneration. Nihon Shinkei Seishin Yakurigaku Zasshi. 2003;23:105–9. [PubMed] [Google Scholar]
- 52.Czernin J, Weber WA, Herschman HR. Molecular imaging in the development of cancer therapeutics. Annu Rev Med. 2006;57:99–118. doi: 10.1146/annurev.med.57.080904.190431. [DOI] [PubMed] [Google Scholar]
- 53.Muldoon LL, Varallyay P, Kraemer DF, et al. Trafficking of superparamagnetic iron oxide particles (Combidex) from brain to lymph nodes in the rat. Neuropathol Appl Neurobiol. 2004;30:70–9. doi: 10.1046/j.0305-1846.2003.00512.x. [DOI] [PubMed] [Google Scholar]
- 54.Bulte JW, Zhang S, van Gelderen P, et al. Neurotransplantation of magnetically labeled oligodendrocyte progenitors: magnetic resonance tracking of cell migration and myelination. Proc Natl Acad Sci U S A. 1999;96:15256–1. doi: 10.1073/pnas.96.26.15256. [DOI] [PMC free article] [PubMed] [Google Scholar]
- 55.Perez JM, Josephson L, O'Loughlin T, et al. Magnetic relaxation switches capable of sensing molecular interactions. Nat Biotechnol. 2002;20:816–20. doi: 10.1038/nbt720. [DOI] [PubMed] [Google Scholar]
- 56.Hommel JD, Sears RM, Georgescu D, et al. Local gene knockdown in the brain using viral-mediated RNA interference. Nat Med. 2003;9:1539–44. doi: 10.1038/nm964. [DOI] [PubMed] [Google Scholar]
- 57.de Marco G, Bogdanov A, Marecos E, et al. MR imaging of gene delivery to the central nervous system with an artificial vector. Radiology. 1998;208:65–71. doi: 10.1148/radiology.208.1.9646794. [DOI] [PubMed] [Google Scholar]
- 58.van Everdingen KJ, Enochs WS, Bhide PG, et al. Determinants of in vivo MR imaging of slow axonal transport. Radiology. 1994;193:485–91. doi: 10.1148/radiology.193.2.7526413. [DOI] [PubMed] [Google Scholar]
- 59.Muldoon LL, Nilaver G, Kroll RA, et al. Comparison of intracerebral inoculation and osmotic blood-brain barrier disruption for delivery of adenovirus, herpesvirus, and iron oxide particles to normal rat brain. Am J Pathol. 1995;147:1840–51. [PMC free article] [PubMed] [Google Scholar]
- 60.Ogawa S, Brown HE, Okano HJ, Pfaff DW. Cellular uptake of intracerebrally administered oligodeoxynucleotides in mouse brain. Regul Pept. 1995;59:143–9. doi: 10.1016/0167-0115(95)00096-t. [DOI] [PubMed] [Google Scholar]
- 61.Liu CH, Huang S, Cui J, et al. MR contrast probes that trace gene transcripts for cerebral ischemia in live animals. FASEB J. 2007 doi: 10.1096/fj.07-8203com. in press. [DOI] [PMC free article] [PubMed] [Google Scholar]


