

Abstract
Tuberous sclerosis complex (TSC) is a tumor suppressor gene syndrome in which severe renal cystic disease can occur. Many renal cystic diseases, including autosomal dominant polycystic kidney disease (ADPKD), are associated with absence or dysfunction of the primary cilium. We report here that hamartin (TSC1) localizes to the basal body of the primary cilium, and that Tsc1−/− and Tsc2−/− mouse embryonic fibroblasts (MEFs) are significantly more likely to contain a primary cilium than wild-type controls. In addition, the cilia of Tsc1−/− and Tsc2−/− MEFs are 17–27% longer than cilia from wild-type MEFs. These data suggest a novel type of ciliary disruption in TSC, associated with enhanced cilia development. The TSC1 and TSC2 proteins function as a heterodimer to inhibit the activity of the mammalian target of rapamycin complex 1 (TORC1). The enhanced ciliary formation in the Tsc1−/− and Tsc2−/− MEFs was not abrogated by rapamycin, which indicates a TORC1-independent mechanism. Polycystin 1 (PC1), the product of the PKD1 gene, has been found to interact with TSC2, but Pkd1−/− MEFs did not have enhanced ciliary formation. Furthermore, while activation of mTOR has been observed in renal cysts from ADPKD patients, Pkd1−/− MEFs did not have evidence of constitutive mTOR activation, thereby underscoring the independent functions of the TSC proteins and PC1 in regulation of primary cilia and mTOR. Our data link the TSC proteins with the primary cilium and reveal a novel phenotype of enhanced ciliary formation in a cyst-associated disease.
INTRODUCTION
Tuberous sclerosis complex (TSC) is a tumor suppressor gene syndrome (1) associated with renal cystic disease (2–7). TSC patients can also develop seizures, mental retardation, autism and tumors in the brain, retina, kidney, heart and skin (8). In a study of 224 TSC patients (74% of whom were under the age of 15), the incidence of renal cysts was 16% in patients with germline TSC1 mutations and 25% in patients with germline TSC2 mutations (9). The protein products of the TSC1 and TSC2 genes, hamartin and tuberin, respectively, physically interact (10,11) and function as a heterodimeric complex to inhibit the mammalian target of rapamycin complex 1 (mTORC1) (12–17). mTORC1 contains mTOR, GβL and Raptor, and controls protein synthesis and cell growth by integrating mitogenic signals and nutrient availability with protein synthesis, via substrates including p70 S6 Kinase (S6K) (18–22). Tuberin inhibits mTORC1 via the Ras homologue Rheb, which is a key target of tuberin's highly conserved GTPase activating protein domain (23–28).
Autosomal dominant polycystic kidney disease (ADPKD) is one of the most common hereditary disorders in humans, with a prevalence of about 1:1000 (29). Eighty-five percent of ADPKD is caused by germline mutations in the chromosome 16p13 PKD1 gene, which encodes the polycystin 1 (PC1) protein, with most of the remaining cases caused by mutations in the chromosome 4q PKD2 gene, which encodes for polycystin 2 (PC2). Cyst number and size increase with age, eventually numbering in the hundreds or thousands, often leading to dialysis-dependent end-stage renal disease (29). Extra-renal manifestations of ADPKD include cysts in the liver and pancreas, mitral valve prolapse and intracranial and aortic aneurysms (29–31).
TSC2 and PKD1 are adjacent genes on chromosome 16p13.3, separated by fewer than 100 base pairs. Adults with TSC marked by severe renal cystic disease tend to have large TSC2 deletions, some of which extend into the 3′ end of PKD1 (2). Contiguous germline deletion of the TSC2 and PKD1 genes is associated with severe infantile-onset polycystic kidney disease (2,3,32,33). It was recently reported that tuberin co-immunoprecipitates with the C-terminal cytoplasmic domain of PC1, and that cysts from patients with ADPKD have evidence of mTOR pathway activation (34), leading to the hypothesis that PC1 inhibits the mTOR pathway via a direct interaction with TSC2 (35–37).
Many proteins associated with renal cystic disease, including PC1, have been linked with the function of the primary cilium (38–40). It is hypothesized that ciliary-mediated sensation of the environment outside of the cell maintains a growth-arrested phenotype in mature tubules and that loss of ciliary-mediated sensation leads to dysregulated growth (reviewed in 41–50). Proteins associated with ADPKD (PC1, PC2), autosomal recessive PKD (fibrocystin, polaris, cystin, inversion), nephronophthisis (nephrocystin, inversion), oro-facio-digital syndrome (OFD1) and Bardet–Biedl syndrome (BBS proteins 1, 4, 5 and 8) localize to the shaft of the primary cilium, the basal body and/or the centrosome (38,39,42,51–53). The von Hippel-Lindau (VHL) tumor suppressor protein, which is associated with renal cell carcinoma, has also recently been found to localize to the cilium (54,55) and to regulate cilia formation and maintenance (54–56). Mutations in some cyst-associated proteins, including PC1 and PC2, cause defects in the function of the primary cilium (38,46). Mutations in other proteins, including polaris, KIF3A and VHL, lead to shortening or complete loss of the cilium (40,55,57–59), while mutations in the proteins Bbs4 and Nek8 lead to longer cilia (60,61).
The centrosome, composed of two centrioles, serves as the microtubule-organizing center of the cell and regulates cell division, migration and polarity (41). In cells with a primary cilium, the mother centriole of the centrosome serves as the basal body and nucleates cilia development. Several cyst-associated proteins localize to the basal body of the cilium, including BBS-8 (62), nephrocystin-4 (52) and polaris (51). In previous work, we found that endogenous hamartin localizes to the centrosome (63). Here we show that hamartin (TSC1) localizes to the basal body of the primary cilium, and that Tsc1−/− and Tsc2−/− mouse embryonic fibroblasts (MEFs) have a higher fraction of ciliated cells than control MEFs. In addition, the cilia of Tsc1−/− and Tsc2−/− MEFs are 17–27% longer than wild-type MEF cilia. This enhanced cilia development was not abrogated by rapamycin, and Pkd1−/− MEFs did not have enhanced ciliary formation, indicating that the phenotype is rapamycin-insensitive and PC1-independent. Despite the previously observed links between Pkd1 and mTOR, we observe hyperphosphorylation of S6 in only a subset (30–35%) of ADPKD cysts, while the remaining 65–70% have low levels of mTOR activation, suggesting that additional mechanisms are required to fully activate mTOR in human ADPKD or that mTOR is active primarily in early stage disease. In addition, no evidence of mTOR activation was observed in Pkd1-null MEFs. Together, these data link the TSC proteins with the primary cilium, suggest a novel paradigm of ciliary signaling disruption in TSC associated with enhanced cilia development, and highlight the independent functions of TSC2 and PC1 in regulation of the primary cilium and mTOR.
RESULTS
Hamartin (TSC1) is localized to the basal body
We previously reported that TSC1 localizes to the centrosome in Cos7 and HeLa cells (63). Because the centrosome gives rise to the basal body of the primary cilium, we hypothesized that hamartin is basal body localized. Human retinal pigmented epithelial cells (RPE1) were serum starved for 48 h to induce cilia growth, fixed, and co-stained with anti-α-acetylated tubulin antibody to identify cilia, anti-γ-tubulin antibody to identify centrosomes, and anti-hamartin antibody. Endogenous hamartin localized to cytoplasmic vesicular structures as previously reported (10,11) and also to the centrosome in RPE1 cells (arrowheads, Fig. 1A). In cells with a primary cilium, hamartin is localized in the basal body at the base of the cilia (arrows, Fig. 1B). Hamartin also localized to the basal body in a human kidney epithelial cell line, HK-2 (Fig. 1C). To verify the specificity of the hamartin antibody, Tsc1-null MEFs (Tsc1−/−/vector) and Tsc1−/− MEFs with re-introduced TSC1 (Tsc1−/−/TSC1) were co-stained with anti-γ-tubulin antibody to identify centrosomes, anti-α-acetylated tubulin antibody to identify cilia, and anti-hamartin antibody. Hamartin colocalized with the centrosome and basal body in the Tsc1−/−/TSC1 cells, and not in the Tsc1−/−/vector cells (Supplementary Material, Fig. S1A–D).
Figure 1.

Hamartin localizes to the basal body of ciliated human RPE1 and HK-2 cells. RPE1 and HK-2 cells were serum starved for 48 h to induce cilia formation. (A) RPE1 cells were fixed and immunostained with anti-γ-tubulin antibody (red) to identify centrosomes, and anti-hamartin antibody (TSC1, green). Arrowheads indicate hamartin localization at the centrosome. (B) RPE1 cells were fixed and immunostained with anti-α-acetylated tubulin antibody (red) to identify cilia, and anti-hamartin antibody (TSC1, green). Arrows indicate hamartin at the base of the primary cilia, and arrowheads indicate hamartin in the centrosome of cells lacking a primary cilium. (C) HK-2 cells were fixed and immunostained with anti-α-acetylated tubulin antibody (red) to identify cilia, and anti-hamartin antibody (TSC1, green). Arrow indicates hamartin at the base of the primary cilium. Nuclei were stained with DAPI. All images shown at ×100 magnification.
Loss of hamartin (Tsc1) enhances ciliary formation
The primary cilium is formed and resorbed in connection with the cell cycle, with cilia formation directly after mitosis and cilia disassembly either at cell cycle entry after G0 or prior to mitotic entry, depending on the cell type (64,65). To determine whether TSC1 regulates ciliary formation, cilia were induced in Tsc1−/− and Tsc1+/+ MEFs by culturing the cells for 48 h after reaching cell contact-induced growth arrest (referred to in subsequent experiments as confluency-induced ciliary formation). Cells were then fixed, probed with antibodies to α-acetylated tubulin (to identify cilia) and γ-tubulin (to identify centrosomes) and scored for cilia by an observer blinded to the experimental conditions. We found that 26% of Tsc1−/− MEFS contained a primary cilium, compared with only 5% of Tsc1+/+ MEFs (P < 0.005, Fig. 2A–D). To confirm that this enhanced ciliary formation in the Tsc1−/− MEFs was Tsc1-dependent, we examined Tsc1−/− MEFs in which either TSC1 or empty vector was stably re-expressed. A similar trend was observed: 34% of Tsc1-null MEFs (Tsc1−/−/vector) contained a primary cilium compared with 12% of Tsc1−/− MEFs with re-introduced TSC1 (Tsc1−/−/TSC1) (P < 0.005, Fig. 2E and F). To confirm further this unexpected finding that loss of Tsc1 enhances ciliary formation, we analyzed cilia at an earlier time point (24 h after plating) during logarithmic growth at subconfluent levels. Twenty percent of the Tsc1-null MEFs had a primary cilium, compared with only 4% of the MEFs re-expressing TSC1 (P < 0.005, Fig. 2G). These data indicate that loss of Tsc1 enhances ciliary formation.
Figure 2.

Loss of hamartin (Tsc1) enhances ciliary formation. (A) Western immunoblot of Tsc1−/− and Tsc1+/+ cells showing hamartin levels with β-actin as a loading control. (B and C) MEFs were maintained at confluency for 48 h to induce cilia formation. Cells were fixed and immunostained with anti-α-acetylated tubulin antibody (cilia, green) and anti-γ-tubulin antibody (centrosomes/basal body, red). Nuclei were stained with DAPI. Arrows indicate the primary cilia. ×100 magnification. (D) Percentage of cells containing a primary cilium is shown, asterisk indicates P < 0.005. (E) Western immunoblot of Tsc1 re-introduction cell lines Tsc1−/−/vector (stably expressing empty vector) and Tsc1−/−/TSC1 (stably expressing TSC1) showing hamartin levels with β-actin as a loading control. Phospho-S6 levels are decreased in cells expressing hamartin, as expected. (F) MEFs were maintained at confluency for 48 h to induce cilia formation. Percentage of cells containing a primary cilium is shown, asterisk indicates P < 0.005. (G) Cells were grown in full serum at subconfluent levels for 24 h. Percentage of cells containing a primary cilium is shown, asterisk indicates P < 0.005.
In previous work from our laboratory, increased centrosome numbers were observed in Tsc1-null cells during prolonged G1/S arrest (63). To determine whether the Tsc1-null and Tsc2-null cells have an increased number of centrosomes under the conditions we used to study ciliary formation in this study, we scored cells for centrosomes after 24 or 48 h of growth in full serum or 48 h serum starvation. No differences in centrosome number were detected between Tsc1−/−/vector cells (1.1– 4.9% of cells with >2 centrosomes, depending on the culture conditions) and Tsc1−/−/TSC1 cells (1.2–4% of cells with >2 centrosomes, depending on the culture conditions) (Supplementary Material, Table S1).
Finally, to determine if loss of Tsc1 causes a difference in cilia length, possibly suggesting defects in normal ciliogenesis, we measured the length of Tsc1−/−/vector and Tsc1−/−/TSC1 cilia after 24 or 48 h in 10% fetal bovine serum (FBS) or 48 h of serum starvation. Interestingly, loss of Tsc1 lead to a 20–27% increase in cilia length, with an average cilia length of 1.54 µm for Tsc1−/−/vector cells and 1.18 µm for Tsc1−/−/TSC1cells (P < 0.005, Table 1).
Table 1.
Cilia length in Tsc1 and Tsc2-null and wild-type cells
| Cell type | Condition | Cilia length, μm average (standard deviation) | Cilia length, μm median | Average cilia length (μm)a |
|---|---|---|---|---|
| Tsc1−/−/vector | 24 h FBS subconfluent | 1.48 (±0.61)b | 1.4 | 1.54 |
| 48 h FBS confluency | 1.58 (±0.38)b | 1.6 | ||
| 48 h serum deprivation | 1.55 (±0.43)b | 1.5 | ||
| 48 h FBS, rapamycin | 1.30 (±0.25)c | 1.3 | ||
| Tsc1−/−/TSC1 | 24 h FBS subconfluent | 1.08 (±0.22) | 1.1 | 1.18 |
| 48 h FBS confluency | 1.22 (±0.37) | 1.2 | ||
| 48 h serum deprivation | 1.24 (±0.27) | 1.2 | ||
| 48 h FBS, rapamycin | 1.08 (±0.27) | 1.1 | ||
| Tsc2−/−p53−/− | 24 h FBS subconfluent | 1.30 (±0.30)b | 1.3 | 1.40 |
| 48 h FBS confluency | 1.35 (±0.24)b | 1.3 | ||
| 48 h serum deprivation | 1.55 (±0.36)b | 1.4 | ||
| 48 h FBS, rapamycin | 1.35 (±0.25) | 1.3 | ||
| Tsc2+/+p53−/− | 24 h FBS subconfluent | 1.08 (±0.25) | 1.1 | 1.13 |
| 48 h FBS confluency | 1.11 (±0.22) | 1.1 | ||
| 48 h serum deprivation | 1.21 (±0.23) | 1.2 | ||
| 48 h FBS, rapamycin | 1.20 (±0.34) | 1.1 |
aAverage cilia length calculated for each cell line from the three culture conditions: 24 h 10% FBS subconfluent, 48 h 10% FBS confluency and 48 h serum deprivation.
bCilia length of Tsc1−/−/vector compared with Tsc1−/−/TSC1, and Tsc2−/−p53−/− compared with Tsc2+/+p53−/−, was statistically significant (P < 0.005) for all conditions tested, Wilcoxon two sample test.
cCilia length of rapamycin treated Tsc1−/−/vector compared with untreated Tsc1−/−/vector at 48 h 10% FBS was statistically significant (P < 0.005), Wilcoxon two sample test. Rapamycin treatment of the other three cell lines did not cause a significant reduction in cilia length at 48 h 10% FBS.
Loss of tuberin (Tsc2) enhances ciliary formation
Tuberin and hamartin function as a heterodimer (10,11) and patients with either TSC1 or TSC2 mutations can develop renal cysts (1,2). To determine if the enhanced cilia formation we observed in cells lacking hamartin also occurs after loss of tuberin, we analyzed ciliary formation in Tsc2−/−p53−/− and Tsc2+/+p53−/− MEFs. These cells, which were originally generated from littermate embryos, are widely used in the TSC field because Tsc2−/− MEFs undergo premature senescence and cannot be propagated (66). The Tsc2−/−p53−/− MEFs had a similar phenotype to the Tsc1−/− cells: when ciliary formation was induced by confluency, 70% of the Tsc2−/−p53−/− MEFs contained a primary cilium compared with only 12% of the Tsc2+/+p53−/− cells (Fig. 3A–D, P < 0.005). When grown for 24 h at subconfluent levels, 43% of the Tsc2−/−p53−/− MEFs contained a primary cilium compared with only 2% of the Tsc2+/+p53−/− MEFs (P < 0.005, Fig. 3E). To confirm the specificity of this phenotype, we re-expressed GFP-tagged TSC2 in the Tsc2−/−p53−/− MEFs. Transfected cells were grown for 24 h in 10% FBS, were probed with antibodies to α-acetylated tubulin (to identify cilia) and γ-tubulin (to identify centrosomes), and GFP-TSC2-positive cells (green) and GFP-TSC2-negative cells were scored for cilia. Re-expression of TSC2 reduced the number of ciliated cells from 58 to 12% (P < 0.005, Supplementary Material, Fig. S2A–D). Similar to the Tsc1 cells, we found no significant difference in centrosome number between Tsc2−/−p53−/− (1.3–2.4% of cells with >2 centrosomes, depending on the culture conditions) and Tsc2+/+p53−/− cells (1.8–3.5% of cells with >2 centrosomes) after 24 or 48 h in 10% FBS, or 48 h serum starvation (Supplementary Material, Table S1).
Figure 3.

Loss of tuberin (Tsc2) enhances ciliary formation. (A) Western immunoblot of Tsc2−/−p53−/− and Tsc2+/+p53−/− cells showing tuberin levels with β-actin as a loading control. The upper band appearing in both lanes is a cross-reactive band often observed with this antibody. (B and C) Tsc2−/−p53−/− MEFs and Tsc2+/+p53−/− MEFs were maintained at confluency for 48 h to induce cilia formation. Cells were fixed and immunostained with anti-α-acetylated tubulin antibody (cilia, green) and anti-γ-tubulin antibody (centrosomes/basal body, red). Nuclei were stained with DAPI. Arrows indicate the primary cilia. ×100 magnification. (D) Percentage of cells containing a primary cilium is shown, asterisk indicates P < 0.005. (E) Cells were grown in full serum at subconfluent levels for 24 h. Percentage of cells containing a primary cilium is shown, asterisk indicates P < 0.005.
To determine if loss of Tsc2 is associated with longer cilia, as was observed in the Tsc1-null cells, we measured the length of Tsc2−/−p53−/− and Tsc2+/+p53−/− cilia after 24 or 48 h in 10% FBS or 48 h of serum starvation. Loss of Tsc2 lead to a 17–22% increase in cilia length, with an average cilia length of 1.40 µm for Tsc2−/−p53−/− cells, and 1.13 µm for Tsc2+/+p53−/− cells (P < 0.005, Table 1).
Regulation of ciliary formation by Tsc1 and Tsc2 is rapamycin-insensitive
The best understood function of TSC1 and TSC2 is to inhibit the activity of mTORC1 (12–15). To determine if the enhancement of cilia formation observed in MEFs lacking TSC proteins is mTORC1-dependent, we treated the cells with the mTORC1 inhibitor, rapamycin. First we analyzed the response to rapamycin in cells in which cilia were induced by confluency. Tsc1−/−/vector and Tsc1−/−/TSC1 cells were grown for 48 h in the presence of rapamycin (20 nmol) or dimethyl sulfoxide (DMSO) control. Rapamycin did not abrogate the enhanced cilia development phenotype. In fact, in the Tsc1−/−/vector MEFs, rapamycin further increased the number of cells with a primary cilium, from 34% (DMSO) to 52% (rapamycin) (P < 0.005, Fig. 4A). To verify that the mTOR pathway remained sensitive to rapamycin after 48 h growth in 10% FBS, we analyzed phospho-S6 levels by western blot. Phospho-S6 levels were undetectable in Tsc1−/−/vector and Tsc1−/−/TSC1 cells treated with rapamycin for 48 h (Supplementary Material, Fig. S3A). No differences in centrosome number were detected in rapamycin-treated cells (Supplementary Material, Table S1), but cilia length was significantly reduced after rapamycin treatment in the Tsc1−/−/vector cells, from 1.58 to 1.30 µm (P < 0.005, Table 1).
Figure 4.

Regulation of ciliary formation by Tsc1 and Tsc2 is rapamycin-insensitive. (A) Tsc1−/−/vector and Tsc1−/−/TSC1 MEFs were grown in the presence of 10% FBS for 48 h with rapamycin (20 nmol) or DMSO control. Percentage of cells containing a primary cilium is shown, asterisk indicates P < 0.005, P = NS, no significant difference. (B) Tsc2−/−p53−/−and Tsc2+/+p53−/− MEFs were grown in the presence of 10% FBS for 48 h with rapamycin (20 nmol) or DMSO control. Percentage of cells containing a primary cilium is shown, asterisk indicates P < 0.005, P = NS, no significant difference. (C and D) Tsc2−/−p53−/− and Tsc2+/+p53−/− MEFs were serum starved for 72 h in the presence of rapamycin (20 nmol) or DMSO control. (C) Percentage of cells containing a primary cilium is shown. (D) Percentage of cells containing more than one primary cilium is shown, asterisk indicates P < 0.005, section sign indicates P < 0.05, P = NS, no significant difference. (E–G) Examples are shown of single Tsc2−/−p53−/− cells containing more than one primary cilium. MEFs were serum starved for 72 h, fixed and immunostained with anti-α-acetylated tubulin antibody (cilia, green) and anti-γ-tubulin antibody (centrosomes/basal body, red). Nuclei were stained with DAPI. Arrows indicate primary cilia. ×100 magnification.
We also tested the effects of rapamycin on confluency-induced ciliary formation in Tsc2−/−p53−/− and Tsc2+/+p53−/− MEFs. As in the Tsc1−/− cells, rapamycin did not abrogate, but instead enhanced, the cilia development phenotype from 53% (DMSO) to 79% (rapamycin) in Tsc2−/−p53−/− cells (P < 0.005, Fig. 4B). Similarly, when cilia were induced in the Tsc2−/−p53−/− and Tsc2+/+p53−/− MEFs by serum deprivation (72 h), rapamycin increased the number of ciliated Tsc2−/−p53−/− cells from 66% (DMSO) to 76% (≤0.05, Fig. 4C), and increased the number of ciliated Tsc2+/+p53−/− cells from 32% (DMSO) to 43% (P < 0.05). Phospho-S6 levels were undetectable in both Tsc2−/−p53−/− and Tsc2+/+p53−/− MEFs treated with rapamycin for 48 or 72 h, confirming the efficacy of rapamycin in these conditions (Supplementary Material, Fig. S3B and C). No differences in centrosome number were detected in rapamycin-treated Tsc2−/−p53−/− or Tsc2+/+p53−/− cells (Supplementary Material, Table S1). Unlike the Tsc1 cells, rapamycin treatment had no effect on cilia length in the Tsc2−/−p53−/− and Tsc2+/+p53−/− MEFs, which indicates the possibility of a role of p53 in ciliary length regulation (Table 1).
Interestingly, when the Tsc2−/−p53−/− MEFS were serum starved for 72 h to induce cilia, 9% had multiple cilia per cell (range 2–11 cilia/cell, average 3 cilia/cell), when compared with <1% of Tsc2+/+p53−/− MEFS (P < 0.005, Fig. 4D–G). This phenotype was rapamycin-sensitive, with 3.7% of the rapamycin-treated Tsc2−/−p53−/− MEFs having more than 1 cilia (P < 0.05, Fig. 4D). Taken together, these data indicate that loss of Tsc2 leads to two ciliary phenotypes: enhanced ciliary formation, which is rapamycin-insensitive, and multiple cilia per cell, which is rapamycin-sensitive.
Regulation of ciliary formation by Tsc2 is independent of PC1
PC1 has been shown to bind to TSC2, and it is hypothesized that cells lacking PC1 have functional inactivation of TSC2 leading to mTOR activation (34–37). Based on this model, we predicted that cells lacking PC1 would have enhanced ciliary formation similarly to cells lacking TSC2. To test this, we utilized MEFs derived from embryos with homozygous disruption of exons 2 and 3 of Pkd1 (67,68). These Pkd1−/− mice have an embryonic lethal phenotype associated with severely cystic kidneys. First, to determine whether MEFs normally express PC1 at a level analogous to those of renal epithelial cells, we used quantitative real-time RT–PCR to compare Pkd1 mRNA levels in Pkd1+/+ and Pkd1−/− MEFs with IMCD3 (inner medullary collecting duct) cells, which are frequently used to study PC1 function, and with mPKE (non-immortalized mouse primary kidney epithelial) cells. Pkd1+/+ MEFs actually had a higher Pkd1 mRNA level (relative level 100) than IMCD3 and mPKE cells (relative level 12 and 13, respectively), while the Pkd1−/− MEFs had nearly undetectable Pkd1 levels (Fig. 5A). Next, to directly compare the Pkd1−/− MEFs to Tsc2−/−p53−/− MEFs with a similar genetic background, early passage Pkd1+/+ and Pkd1−/− MEFs were retrovirally transduced with p53 shRNA to generate immortalized Pkd1+/+p53kd(knockdown) and Pkd1−/−p53kd MEFs (69). These cells have a >97% decrease in p53 levels as determined by quantitative real-time RT–PCR (Fig. 5B). Finally, to determine if Pkd1−/−p53kd cells have enhanced cilia development similar to Tsc2−/−p53−/− MEFs, cells were grown at subconfluent levels in full serum media for 24 h, fixed, stained and scored for the presence of cilia. As we had observed in previous experiments, the Tsc2−/−p53−/− MEFs had a markedly elevated number of ciliated cells, compared with the Tsc2+/+p53−/− MEFs (43 versus 2%, P < 0.005). In striking contrast to Tsc2−/−p53−/− MEFs, only 8% of the Pkd1−/−p53kd MEFs had a primary cilium (P < 0.005, Fig. 5C). These data demonstrate that TSC1 and TSC2 function primarily independently of PC1 to regulate primary cilium development in fibroblasts. The fact that Pkd1−/−p53kd MEFs had a small, but statistically higher number of cells with a cilium compared with Tsc2+/+p53−/− MEFs, leaves open the possibility that PC1 may have a minor effect on cilia formation.
Figure 5.

Pkd1−/−p53kd cells do not have enhanced cilia development. (A) Quantitative real-time RT–PCR analysis of Pkd1 mRNA levels in IMCD3 cells, non-immortalized mouse primary kidney epithelial (mPKE) cells, Pkd1+/+ MEFs and Pkd1−/− MEFs. RNA concentration was determined by Nanodrop spectrophotometry, and RT–PCR results are normalized to levels of TATA-binding protein. (B) Quantitative real-time RT–PCR analysis of p53 levels of Pkd1+/+ and Pkd1−/− MEFs before and after immortalization with p53 shRNA. (C) Cells were grown in full serum at subconfluency for 24 h. Percentage of cells containing a primary cilium is shown, asterisk indicates P < 0.005, section sign indicates P < 0.05.
Loss of Pkd1 does not constitutively activate the mTOR pathway in fibroblasts
The fact that cells lacking PC1 and cells lacking Tsc2 have different phenotypes related to ciliary formation led us to examine mTOR activation in the Pkd1-null cells. To our knowledge, no prior study has addressed whether PC1-null cells have dysregulation of the mTOR pathway. To examine the role of Pkd1 in mTOR regulation, we compared Pkd1−/−p53kd MEFs to Pkd1+/+p53kd and Tsc2−/−p53−/− MEFs. After 24 h of serum deprivation, the Tsc2−/−p53−/− MEFs had high levels of phosphorylated ribosomal protein S6 (phospho-S6) as expected because of the known role of TSC2 in inhibiting mTOR. In contrast, both the Pkd1+/+p53kd and Pkd1−/−p53kd MEFs had low levels of phospho-S6 after 24 h of serum deprivation. Fifteen minutes after serum stimulation, both the Pkd1+/+p53kd and the Pkd1−/−p53kd MEFs showed marked enhancement of mTOR activation (Fig. 6A). To confirm that this effect is related to the loss of Pkd1, and not a consequence of p53 loss, we compared early passage primary cultures of Pkd1−/− MEFs to the Pkd1−/−p53kd MEFs and Tsc2−/−p53−/− MEFs. Both primary and immortalized Pkd1−/− MEFs had low levels of phospho-S6 in serum deprivation conditions (Fig. 6B). These data demonstrate that loss of PC1 does not constitutively activate mTOR in fibroblasts.
Figure 6.

Loss of Pkd1 does not constitutively activate the mTOR pathway. MEFs were serum deprived overnight, then stimulated for 15 min in the presence of 20% FBS. Immunoblots were probed with phospho-S6 to determine the level of mTOR activation. β-actin was used as a loading control. (A) Western immunoblot of Tsc2−/−p53−/−, Pkd1+/+p53kd MEFs and Pkd1−/−p53kd MEFs. (B) Western immunoblot of Tsc2−/−p53−/−, Pkd1−/− primary MEFs and Pkd1−/−p53kd MEFs. Similar results were seen in four independent experiments.
ADPKD kidneys contain cysts both with and without evidence of mTOR activation
Because cells lacking PC1 have low levels of activated mTOR in serum deprivation conditions, we next re-examined mTOR activation in ADPKD. Paraffin-embedded tissue specimens from 7 ADPKD patients were stained with anti-phospho-S6 ribosomal protein (Ser 235/236), and 121 individual cysts were scored using a semi-quantitative scale as reported previously (70,71). Strong (3+) to moderate (2+) phospho-S6 immunoreactivity was evident in 36 cysts (30%) (Table 2). Importantly, the other 70% had weak (1+) or negative phospho-S6 immunoreactivity. Similar staining patterns were observed using anti-phospho-mTOR (Ser2448), with 35% of cysts staining strongly or moderately positive (Table 3). Both positively staining and negatively staining cysts were identified in each patient, as illustrated in Figure 7. Cysts tended to have a homogeneous staining pattern, with the entire cyst staining either positive or negative. Weakly positive phosphorylation of S6 was seen in the renal epithelium of some normal renal tubules (not shown), as we have previously observed (70). In some cases, the phospho-S6 and phospho-mTOR-positive cells were larger and more cuboidal in shape than the negative cells (arrows, Fig. 7).
Table 2.
Phospho-S6 immunoreactivity of ADPKD renal cysts
| Patient number | Number of cysts scored |
|||
|---|---|---|---|---|
| − | 1+ | 2+ | 3+ | |
| 305 | 6 | 7 | 3 | 1 |
| 427 | 2 | 4 | 1 | 0 |
| 433 | 11 | 10 | 5 | 3 |
| 513 | 6 | 1 | 3 | 1 |
| 550 | 3 | 3 | 1 | 0 |
| 555 | 16 | 6 | 2 | 6 |
| 611 | 8 | 2 | 7 | 3 |
| Total number (%) | 52 (43) | 33 (27) | 22 (18) | 14 (12) |
Table 3.
Phospho-mTOR immunoreactivity of ADPKD renal cysts
| Patient number | Number of cysts scored |
|||
|---|---|---|---|---|
| − | 1+ | 2+ | 3+ | |
| 305 | 20 | 6 | 5 | 10 |
| 427 | 23 | 4 | 6 | 7 |
| Total number (%) | 43 (53) | 10 (12) | 11 (14) | 17 (21) |
Figure 7.

ADPKD kidneys contain cysts both with and without evidence of mTOR activation. Cysts from seven ADPKD patients were stained using phospho-S6 (Ser 235/236) and phospho-mTOR (Ser 2448) antibodies. Thirty percent had moderate or strong immunoreactivity with anti-phospho-S6, and 35% had moderate or strong immunoreactivity with anti-phospho-mTOR. Representative examples of positive and negative cysts are shown. Phospho-mTOR and phospho-S6-positive cysts tended to have larger cells with a more cuboidal shape (black arrow). The negative cells tended to have a flattened shape. Occasionally, the phospho-S6 and phospho-mTOR-positive cysts had papillary projections (white arrows, patient 611). ×40 magnification.
The fact that only ∼30% of ADPKD cysts have evidence of activation of the mTOR/S6K signaling pathway was unexpected, for this implies that mutational inactivation of PKD1 is not sufficient to activate mTOR. One possible explanation for the discordance between these results and the hypothesized PC1-TSC2-TOR signaling axis (which would predict uniform activation of mTOR in PKD1 cysts) is that mTOR is initially uniformly active, but that fibrosis and consequent hypoxia in end-stage disease inhibit mTOR.
DISCUSSION
The mechanisms through which mutations in the TSC1 or TSC2 genes contribute to the development of renal cysts are not well understood. We report here that TSC1 is localized to the basal body of the primary cilium, and that fibroblasts lacking either Tsc1 or Tsc2 have a phenotype of enhanced ciliary formation in three different conditions: logarithmic growth; confluency-induced ciliary formation and serum deprivation-induced growth arrest. In addition, cells lacking Tsc1 or Tsc2 have cilia that are on average 17–27% longer than wild-type cells, which indicates a defect in normal ciliogenesis. The pathogenesis of many renal cystic diseases has been linked with dysfunction of the primary cilium (e.g. ADPKD, autosomal recessive PKD, nephronophthisis, OFD1 and BBS; 42–44,50,52,53,72). Mutations in some proteins associated with renal cystic disease result in complete loss of the primary cilium (e.g. polaris, KIF3A and VHL) (51,55,57–59), while increases in ciliary length have been reported in cell culture and kidney tubules from mutations in the renal cystic disease associated Bbs4 and Nek8 proteins (60,61). To our knowledge, increased ciliary formation has not been previously observed in cells carrying mutations for genes associated with renal cystic disease. These data, therefore, may reveal a novel paradigm in which enhanced ciliary development is associated with renal cyst pathogenesis.
The best studied function of the TSC1 and TSC2 proteins is to inhibit the activity of mTORC1 (12–17,23–28). We found that Tsc1−/− and Tsc2−/−p53−/− MEFs treated with the mTORC1 inhibitor rapamycin actually increased, rather than reduced cilia numbers, which demonstrates that the enhanced cilia formation in these cells is mTORC1- independent. The relative contributions of mTOR-dependent and mTOR-independent mechanisms to cyst pathogenesis in TSC are not known. In a Tsc1+/− mouse model, only 53 and 37% of cyst epithelial cells were positive for phospho- mTOR and phospho-S6 immunostaining, respectively, compared with >90% of cystadenomas and renal cell carcinomas that stained positively for both markers. This suggests that activation of the mTOR pathway may not be the key initiating event in cyst development (73). It is known that treatment with rapamycin reduces the size of renal angiomyolipomas in patients with TSC (74) and reduces the severity of kidney lesions (cysts and tumors) in rodent models (75–77), but the impact of rapamycin on cystic disease in humans with TSC is not yet known. Our unexpected finding that rapamycin treatment further enhances cilia formation in the Tsc1 and Tsc2-null cells may have important implications for treating renal cystic disease in TSC patients. This may suggest that the TSC proteins regulate the primary cilium through both mTORC1-dependent and mTORC1-independent mechanisms. These mechanisms may differentially impact ciliary assembly, elongation and/or maintenance, and in turn these mechanisms may differentially impact cyst initiation and cyst progression. The efficacy of rapamycin on renal cystic disease in patients carrying TSC gene mutations or a contiguous PKD1/TSC2 deletion may therefore differ from the efficacy of rapamycin on renal cystic disease in patients carrying PKD1 mutations.
In addition to enhanced ciliary formation, 9% of Tsc2−/−p53−/− MEFs had multiple primary cilia per cell, which was partially corrected by treatment with rapamycin. Therefore, the TSC pathway appears to have both mTOR-independent and mTOR-dependent roles in ciliary formation. We have previously observed that Tsc1−/− MEFs have extra centrosomes after a 40 h G1/S arrest (63), and others have reported that Tsc2+/EK pulmonary vascular smooth muscle cells (SMCs) derived from Eker rats have increased centrosome number compared with Tsc2+/+ SMCs (78). However, under the conditions used to study ciliary formation in this study, extra centrosomes were not observed in either the Tsc1-null or the Tsc2-null cells, which suggests that the multiple-cilia-per-cell phenotype is not a consequence of multiple centrosomes (63).
Mutations in either TSC1 or TSC2 alone can lead to polycystic kidney disease, but renal failure is uncommon. Mutations in PKD1 alone lead to renal failure in 50% of cases, at an average age of 60 years (29,30). The severe renal cystic disease observed in infants with contiguous deletion of both TSC2 and PKD1 is consistent with a synergistic functional connection between TSC and ADPKD (2,3,32,79). It has been previously shown that TSC2 is required for correct localization of PC1 to the cell membrane, placing TSC2 upstream of PC1 (80). More recently, it has been proposed that PC1 inhibits the activity of mTOR via a direct interaction with TSC2, placing PC1 upstream of TSC2 (34). We found that Pkd1−/− MEFs do not exhibit enhanced cilia development as do the Tsc1−/− and Tsc2−/−p53−/− MEFs, indicating that at least for this particular ciliary phenotype, PC1 is not functioning upstream of TSC2. PC1 localizes to the primary cilium and is involved in sensing physiological fluid flow (38,39,81,82). We speculate, therefore, that TSC2 and PC1 may cooperatively regulate different aspects of ciliary development and function, with TSC2 regulating ciliary formation and PC1 sensing physiological fluid flow, thereby synergistically contributing to renal cyst formation in patients with contiguous deletion of both genes.
In striking contrast to Tsc2−/−p53−/− MEFs, Pkd1−/− MEFs showed no evidence of mTOR activation under serum deprivation conditions. This is surprising considering the interaction of PC1 (overexpressed C-terminal cytoplasmic tail) with TSC2 that was hypothesized to underlie the activation of mTOR observed in renal cystic epithelial cells from patients with ADPKD (34–37). One possible explanation is that the Pkd1 disruption in the Pkd1−/− MEFs used for our studies, which occurs by homologous recombination of a β-galactosidase/neomycin cassette in place of exons 2 and 3 of Pkd1, leaves a partially functional region of PC1 intact (67,68). A second potential explanation for the discordance between our data and the previously proposed models for the relationship between PC1 and TSC2 is that there are differences in the regulation of mTOR activity by PC1 between fibroblasts and epithelial cells. This could be clinically important since ADPKD patients develop non- epithelial manifestations, including mitral valve prolapse and aortic and intracranial aneurysms (29–31,83). However, we note that MEFs have been used by other groups to study the roles of VHL, PDGFRαα, KIF3A and other proteins in ciliary formation and function, and in general, results have been concordant between fibroblasts and epithelial cells when both cell types were analyzed (55,84–87).
Multiple signaling cascades converge on TSC2, leading to its phosphorylation and inactivation (88–92). Interestingly, loss of Pkd1 has been shown to result in activation of Akt and MAPK (93,94), and Akt and MAPK activation can lead to mTOR activation via direct phosphorylation and inactivation of TSC2 (88–91), yet mTOR was not activated in our Pkd1−/− MEFs. While loss of PC1 does not appear sufficient to activate mTORC1, it may act cooperatively with other pathways to potentiate cyst pathogenesis (Fig. 8). Consistent with this, we find that ∼30–35% of ADPKD cysts have strong to moderate immunohistochemical evidence of mTOR pathway activation, while 65–70% do not, potentially reflecting activation of other pathways upstream of TSC2 and mTOR.
Figure 8.
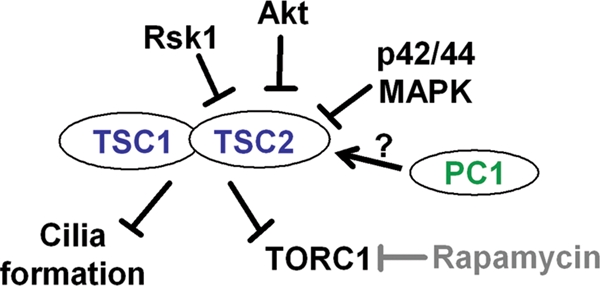
Working model. TSC1 and TSC2 regulate cilia formation in a TORC1/rapamycin-independent manner. Multiple signaling cascades, including MAPK, Akt and Rsk1, converge on TSC2, leading to its phosphorylation and inactivation and contributing to mTOR activation. Loss of PC1 does not appear sufficient to activate TOR or impact ciliary formation via TSC2. However, PC1 may cooperate with the multiple signaling cascades to initiate or enhance cystogenesis.
Elucidating the mechanism through which mTOR is regulated in ADPKD has critical clinical implications, since at least four clinical trials of mTOR inhibitors are ongoing for patients with PKD to determine if these drugs can slow cyst progression, reduce cyst volume and improve renal function (95). Our data suggest that mutational activation of PKD1 is not sufficient to activate mTOR and that other events which may be mediated by TSC2 are required to activate mTOR in ADPKD cysts, thereby leading to cyst progression. These other events may distinguish cyst initiation from cyst progression and could reveal novel therapeutic options for patients with ADPKD, which affects 12.5 million people world-wide, accounts for 8–10% of all patients on dialysis, and leads to $2 billion per year in health care costs in the USA.
MATERIALS AND METHODS
Cell culture
Human retinal pigmented epithelial cells (hTERT-RPE1) were obtained from the American Type Culture Collection. RPE1 cells were maintained in 1:1 DMEM:F12 media containing 10% FBS and 10 µg/ml Hygromycin B. Immortalized human kidney proximal tubule epithelial (HK-2) cells (American Type Culture Collection) were maintained in DMEM with 10% FBS and ITS liquid media supplement (Sigma). Tsc1+/+, Tsc1−/−, Tsc2+/+p53−/−, and Tsc2−/−p53−/− MEFs have been previously described (6,66,96) and were maintained in DMEM with 10% FBS and non-essential amino acids. TSC1-null re-introduction MEFs have been previously described (63). Non-immortalized mPKE were derived from a wild-type C57BL/6 mouse and were maintained in low calcium DMEM/F12 media (Invitrogen #90-5212EF) with 5% horse serum. The Pkd1−/− MEFs were isolated from Pkd1−/− mice that have homologous recombination of a β-galactosidase/neomycin cassette that disrupts exons 2 and 3 (67,68). Wild-type and Pkd1−/− MEFs were immortalized by transduction of a retroviral vector containing shRNA targeting p53 (69). For immortalization, 5 × 10⁶ 293T Phoenix packaging cells were transfected with 7 µg shRNA plasmid (p53E or empty vector) with 5 µg helper plasmid containing retroviral gag/pol genes using Fugene 6 (Roche). After 48 h, the target MEFs were infected twice daily for 2 days with the media from the Phoenix cells filtered through a 0.45 µm filter. MEF media was changed twice daily for the next 2 days, and then media was supplemented with 1.5 µg puromycin to select for infected cells for the next 72 h. All cells losing p53 are immortalized, and puromycin selection is no longer necessary.
Assays of ciliary formation
To study cilia three different conditions were used, as specified in the text: cells were serum starved for 48–72 h to induce cilia formation, cells were cultured with cell-to-cell contact inhibition in the presence of 10% FBS for 48 h to induce ciliary formation, or cells were grown logarithmically in the presence of 10% FBS at subconfluency for 24 h. Each result was confirmed in at least three independent experiments. Due to variation in seeding density, absolute numbers of primary cilia differed between experiments by 10–30%, but the fold increase caused by loss of Tsc1 or Tsc2 remained consistent. Rapamycin (20 nmol) and DMSO were added to the media for the full 48 or 72 h of ciliary induction, as indicated. For GFP-TSC2 re-expression in Tsc2−/−p53−/− MEFs, cells were plated on coverslips and transfected with GFP-TSC2 plasmid DNA using Fugene 6 (Roche). After 24 h growth in 10% FBS, cells were fixed and stained. For each culture condition, at least 150 cells were scored for the presence of a primary cilium, and at least 200 cells scored for the number of centrosomes by an observer blinded to the experimental conditions. For cilia measurements, at least 50 randomly chosen cilia were measured (from base to tip) per cell line for each culture condition at 1000× magnification using a Nikon Coolsnap ES camera and Image-Pro Express 2000 software (Media Cybernetics, Inc.).
Immunofluorescence
RPE1, HK-2 or MEF cells were grown in conditions to stimulate cilia formation and then fixed for 10 min in 100% methanol on ice. Cells were washed three times in PBS, incubated for 5 min in 0.2% Triton-X in PBS, and then washed three times in Triton-X PBS. Primary antibodies [α-acetylated tubulin (Sigma) 1:1000, γ-tubulin (Abcam) 1:1000, Hamartin (Zymed) 1:100] were added for 1 h at room temperature, and then cells were washed three times with Triton-PBS. Secondary antibody [alexa fluor 488 or 594 (Molecular Probes) 1:1000] were added for 1 h at room temperature, then cells were washed 3× 2 min with Triton-PBS. Cells were incubated with DAPI for 1 min at room temperature, washed in PBS and mounted using anti-fading gel mount (Biomeda). Cells were viewed by Nikon Coolsnap ES and pictures taken with Image-Pro Express 2000 software (Media Cybernetics).
Western blotting
Cells were washed once in PBS on ice, then lysed in PTY buffer (50 mm HEPES, pH 7.5, 50 mm NaCl, 50 mm NaF, 10 mm Na4P2O7·10H2O, 5 mm EDTA, 1% Triton X, Sigma protease inhibitors), or in RIPA buffer (150 mm NaCl, 50 mm Tris, pH 8.0, 1% Triton X, 1% deoxycholic acid, 0.1% SDS, 2 mm PMSF, Sigma protease inhibitors). Proteins were run on 4–20% SDS–PAGE, then transferred to Immobilon-P (Millipore) membrane. Western blots were probed with antibodies to β-actin (Sigma, A2228), hamartin [TSC1] (Zymed, 37–0400), phospho-S6 ribosomal protein [Ser235/236] (Cell Signaling, 2211) and tuberin [TSC2] (Santa Cruz, sc-893).
Immunohistochemistry
ADPKD specimens were obtained at the time of nephrectomy through the Polycystic Kidney Research Foundation. Formalin-fixed, paraffin-embedded ADPKD kidney sections were deparaffinized and rehydrated according to standard procedures. Slides were boiled in 10 mm citrate buffer, pH 6.0 for 10 min in the microwave. After cooling, slides were quenched with 3% hydrogen peroxide in methanol for 30 min at room temperature. For staining procedures, the Histo-stain Plus kit (Zymed) was used according to manufacturer's instructions. Phospho-S6 [(Ser235/236) Cell Signaling] and phospho- mTOR [(Ser2448) #2967] antibodies were used in a 1:50 dilution in PBS. Cysts were scored for phospho-S6 and phospho-mTOR staining using a scale of negative (−), weakly positive (1+), moderately positive (2+) or strongly positive (3+).
Reverse transcription polymerase chain reaction
Total mRNA was isolated from IMCD3, mPKE and MEF cell lines using the RNeasy™ Mini-kit (Qiagen). RNA concentration was determined using NanoDrop™ Spectrophotometer (Thermo Scientific). For each sample, two reverse transcription reactions were performed with 100 and 20 ng of input RNA. 5′-Nuclease assays using TaqMan chemistry were run on a 7900 HT sequence detection system (Applied Biosystems). Ct (cycle threshold) values were converted to quantities (in arbitrary units) using standard curve (five points, 5-fold dilutions) established with a calibrator sample. Quantitative real-time RT–PCR results were normalized to TATA-binding protein mRNA levels. For each sample, the two values of relative quantity (from two PCR assays) were averaged.
Statistical analysis
A two-tailed Fisher's exact test was used for all statistical analysis of cilia number per cell and centrosome number per cell. For comparisons of cilia length, a Wilcoxon two sample test was performed. Significance was achieved at P ≤ 0.05.
SUPPLEMENTARY MATERIAL
FUNDING
This work was supported by grants from the PKD Foundation and Tuberous Sclerosis Alliance (#-01PT07a). T.R.H. was supported by NIH F32 (DK076443-01). Funding to pay the Open Access charges was provided by Brigham and Women's Hospital.
Supplementary Material
ACKNOWLEDGEMENTS
We thank Erica Golemis for critical reading of this manuscript. We thank Dr Sam Litwin and Tianyu Li at the Fox Chase Cancer Center Biostatistics Facility for statistical analysis. We thank Emmanuelle Nicolas for assistance with quantitative real-time RT–PCR. We thank Olga Plotnikova for mPKE cells.
Conflict of Interest statement. None declared.
REFERENCES
- 1.Gomez M.R., Sampson J.R., Whittemore V.H. Tuberous Sclerosis Complex. New York: Oxford University Press; 1999. [Google Scholar]
- 2.Sampson J.R., Maheshwar M.M., Aspinwall R., Thompson P., Cheadle J.P., Ravine D., Roy S., Haan E., Bernstein J., Harris P.C. Renal cystic disease in tuberous sclerosis: role of the polycystic kidney disease 1 gene. Am. J. Hum. Genet. 1997;61:843–851. doi: 10.1086/514888. [DOI] [PMC free article] [PubMed] [Google Scholar]
- 3.Longa L., Scolari F., Brusco A., Carbonara C., Polidoro S., Valzorio B., Riegler P., Migone N., Maiorca R. A large TSC2 and PKD1 gene deletion is associated with renal and extrarenal signs of autosomal dominant polycystic kidney disease. Nephrol. Dial. Transplant. 1997;12:1900–1907. doi: 10.1093/ndt/12.9.1900. [DOI] [PubMed] [Google Scholar]
- 4.Kobayashi T., Hirayama Y., Kobayashi E., Kubo Y., Hino O. A germline insertion in the tuberous sclerosis (Tsc2) gene gives rise to the Eker rat model of dominantly inherited cancer. Nat. Genet. 1995;9:70–74. doi: 10.1038/ng0195-70. [DOI] [PubMed] [Google Scholar]
- 5.Kobayashi T., Minowa O., Kuno J., Mitani H., Hino O., Noda T. Renal carcinogenesis, hepatic hemangiomatosis, and embryonic lethality caused by a germ-line Tsc2 mutation in mice. Cancer Res. 1999;59:1206–1211. [PubMed] [Google Scholar]
- 6.Onda H., Lueck A., Marks P.W., Warren H.B., Kwiatkowski D.J. Tsc2(+/−) mice develop tumors in multiple sites that express gelsolin and are influenced by genetic background. J. Clin. Invest. 1999;104:687–695. doi: 10.1172/JCI7319. [DOI] [PMC free article] [PubMed] [Google Scholar]
- 7.Kobayashi T., Minowa O., Sugitani Y., Takai S., Mitani H., Kobayashi E., Noda T., Hino O. A germ-line Tsc1 mutation causes tumor development and embryonic lethality that are similar, but not identical to, those caused by Tsc2 mutation in mice. Proc. Natl Acad. Sci. USA. 2001;98:8762–8767. doi: 10.1073/pnas.151033798. [DOI] [PMC free article] [PubMed] [Google Scholar]
- 8.Shepherd C.W., Gomez M.R., Lie J.T., Crowson C.S. Causes of death in patients with tuberous sclerosis. Mayo Clin. Proc. 1991;66:792–796. doi: 10.1016/s0025-6196(12)61196-3. [DOI] [PubMed] [Google Scholar]
- 9.Dabora S.L., Jozwiak S., Franz D.N., Roberts P.S., Nieto A., Chung J., Choy Y.S., Reeve M.P., Thiele E., Egelhoff J.C., et al. Mutational analysis in a cohort of 224 tuberous sclerosis patients indicates increased severity of TSC2, compared with TSC1, disease in multiple organs. Am. J. Hum. Genet. 2001;68:64–80. doi: 10.1086/316951. [DOI] [PMC free article] [PubMed] [Google Scholar]
- 10.Plank T.L., Yeung R.S., Henske E.P. Hamartin, the product of the tuberous sclerosis 1 (TSC1) gene, interacts with tuberin and appears to be localized to cytoplasmic vesicles. Cancer Res. 1998;58:4766–4770. [PubMed] [Google Scholar]
- 11.van Slegtenhorst M., Nellist M., Nagelkerken B., Cheadle J., Snell R., van den Ouweland A., Reuser A., Sampson J., Halley D., van der Sluijs P. Interaction between hamartin and tuberin, the TSC1 and TSC2 gene products. Hum. Mol. Genet. 1998;7:1053–1057. doi: 10.1093/hmg/7.6.1053. [DOI] [PubMed] [Google Scholar]
- 12.Radimerski T., Montagne J., Hemmings-Mieszczak M., Thomas G. Lethality of Drosophila lacking TSC tumor suppressor function rescued by reducing dS6K signaling. Genes Dev. 2002;16:2627–2632. doi: 10.1101/gad.239102. [DOI] [PMC free article] [PubMed] [Google Scholar]
- 13.Inoki K., Li Y., Zhu T., Wu J., Guan K.L. TSC2 is phosphorylated and inhibited by Akt and suppresses mTOR signalling. Nat. Cell Biol. 2002;4:648–657. doi: 10.1038/ncb839. [DOI] [PubMed] [Google Scholar]
- 14.Gao X., Zhang Y., Arrazola P., Hino O., Kobayashi T., Yeung R.S., Ru B., Pan D. Tsc tumour suppressor proteins antagonize amino-acid-TOR signalling. Nat. Cell Biol. 2002;4:699–704. doi: 10.1038/ncb847. [DOI] [PubMed] [Google Scholar]
- 15.Potter C.J., Huang H., Xu T. Drosophila Tsc1 functions with Tsc2 to antagonize insulin signaling in regulating cell growth, cell proliferation, and organ size. Cell. 2001;105:357–368. doi: 10.1016/s0092-8674(01)00333-6. [DOI] [PubMed] [Google Scholar]
- 16.Jaeschke A., Hartkamp J., Saitoh M., Roworth W., Nobukuni T., Hodges A., Sampson J., Thomas G., Lamb R. Tuberous sclerosis complex tumor suppressor-mediated S6 kinase inhibition by phosphatidylinositide-3-OH kinase is mTOR independent. J. Cell Biol. 2002;159:217–224. doi: 10.1083/jcb.jcb.200206108. [DOI] [PMC free article] [PubMed] [Google Scholar]
- 17.Tapon N., Ito N., Dickson B.J., Treisman J.E., Hariharan I.K. The Drosophila tuberous sclerosis complex gene homologs restrict cell growth and cell proliferation. Cell. 2001;105:345–355. doi: 10.1016/s0092-8674(01)00332-4. [DOI] [PubMed] [Google Scholar]
- 18.Kim D.H., Sarbassov D.D., Ali S.M., King J.E., Latek R.R., Erdjument-Bromage H., Tempst P., Sabatini D.M. mTOR interacts with raptor to form a nutrient-sensitive complex that signals to the cell growth machinery. Cell. 2002;110:163–175. doi: 10.1016/s0092-8674(02)00808-5. [DOI] [PubMed] [Google Scholar]
- 19.Kozma S.C., Thomas G. Regulation of cell size in growth, development and human disease: PI3K, PKB and S6K. Bioessays. 2002;24:65–71. doi: 10.1002/bies.10031. [DOI] [PubMed] [Google Scholar]
- 20.Blume-Jensen P., Hunter T. Oncogenic kinase signalling. Nature. 2001;411:355–365. doi: 10.1038/35077225. [DOI] [PubMed] [Google Scholar]
- 21.Shah O.J., Anthony J.C., Kimball S.R., Jefferson L.S. 4E-BP1 and S6K1: translational integration sites for nutritional and hormonal information in muscle. Am. J. Physiol. Endocrinol. Metab. 2000;279:E715–E729. doi: 10.1152/ajpendo.2000.279.4.E715. [DOI] [PubMed] [Google Scholar]
- 22.Loewith R., Jacinto E., Wullschleger S., Lorberg A., Crespo J.L., Bonenfant D., Oppliger W., Jenoe P., Hall M.N. Two TOR complexes, only one of which is rapamycin sensitive, have distinct roles in cell growth control. Mol. Cell. 2002;10:457–468. doi: 10.1016/s1097-2765(02)00636-6. [DOI] [PubMed] [Google Scholar]
- 23.Zhang Y., Gao X., Saucedo L.J., Ru B., Edgar B.A., Pan D. Rheb is a direct target of the tuberous sclerosis tumour suppressor proteins. Nat. Cell Biol. 2003;5:578–581. doi: 10.1038/ncb999. [DOI] [PubMed] [Google Scholar]
- 24.Garami A., Zwartkruis F.J., Nobukuni T., Joaquin M., Roccio M., Stocker H., Kozma S.C., Hafen E., Bos J.L., Thomas G. Insulin activation of Rheb, a mediator of mTOR/S6K/4E-BP signaling, is inhibited by TSC1 and 2. Mol. Cell. 2003;11:1457–1466. doi: 10.1016/s1097-2765(03)00220-x. [DOI] [PubMed] [Google Scholar]
- 25.Inoki K., Li Y., Xu T., Guan K.L. Rheb GTPase is a direct target of TSC2 GAP activity and regulates mTOR signaling. Genes Dev. 2003;17:1829–1834. doi: 10.1101/gad.1110003. [DOI] [PMC free article] [PubMed] [Google Scholar]
- 26.Saucedo L.J., Gao X., Chiarelli D.A., Li L., Pan D., Edgar B.A. Rheb promotes cell growth as a component of the insulin/TOR signalling network. Nat. Cell Biol. 2003;5:566–571. doi: 10.1038/ncb996. [DOI] [PubMed] [Google Scholar]
- 27.Tee A.R., Manning B.D., Roux P.P., Cantley L.C., Blenis J. Tuberous sclerosis complex gene products, Tuberin and Hamartin, control mTOR signaling by acting as a GTPase-activating protein complex toward Rheb. Curr. Biol. 2003;13:1259–1268. doi: 10.1016/s0960-9822(03)00506-2. [DOI] [PubMed] [Google Scholar]
- 28.Stocker H., Radimerski T., Schindelholz B., Wittwer F., Belawat P., Daram P., Breuer S., Thomas G., Hafen E. Rheb is an essential regulator of S6K in controlling cell growth in Drosophila. Nat. Cell Biol. 2003;5:559–565. doi: 10.1038/ncb995. [DOI] [PubMed] [Google Scholar]
- 29.Wilson P.D. Polycystic kidney disease. N. Engl. J. Med. 2004;350:151–164. doi: 10.1056/NEJMra022161. [DOI] [PubMed] [Google Scholar]
- 30.Gabow P.A. Autosomal dominant polycystic kidney disease. N. Engl. J. Med. 1993;329:332–342. doi: 10.1056/NEJM199307293290508. [DOI] [PubMed] [Google Scholar]
- 31.Chapman A.B., Rubinstein D., Hughes R., Stears J.C., Earnest M.P., Johnson A.M., Gabow P.A., Kaehny W.D. Intracranial aneurysms in autosomal dominant polycystic kidney disease. N. Engl. J. Med. 1992;327:916–920. doi: 10.1056/NEJM199209243271303. [DOI] [PubMed] [Google Scholar]
- 32.Brook-Carter P.T., Peral B., Ward C.J., Thompson P., Hughes J., Maheshwar M.M., Nellist M., Gamble V., Harris P.C., Sampson J.R. Deletion of the TSC2 and PKD1 genes associated with severe infantile polycystic kidney disease—a contiguous gene syndrome. Nat. Genet. 1994;8:328–332. doi: 10.1038/ng1294-328. [DOI] [PubMed] [Google Scholar]
- 33.Ong A.C., Harris P.C., Davies D.R., Pritchard L., Rossetti S., Biddolph S., Vaux D.J., Migone N., Ward C.J. Polycystin-1 expression in PKD1, early-onset PKD1, and TSC2/PKD1 cystic tissue. Kidney Int. 1999;56:1324–1333. doi: 10.1046/j.1523-1755.1999.00659.x. [DOI] [PubMed] [Google Scholar]
- 34.Shillingford J.M., Murcia N.S., Larson C.H., Low S.H., Hedgepeth R., Brown N., Flask C.A., Novick A.C., Goldfarb D.A., Kramer-Zucker A., et al. From the Cover: The mTOR pathway is regulated by polycystin-1, and its inhibition reverses renal cystogenesis in polycystic kidney disease. Proc. Natl Acad. Sci. USA. 2006;103:5466–5471. doi: 10.1073/pnas.0509694103. [DOI] [PMC free article] [PubMed] [Google Scholar]
- 35.Mostov K.E. mTOR is out of control in polycystic kidney disease. Proc. Natl Acad. Sci. USA. 2006;103:5247–5248. doi: 10.1073/pnas.0601352103. [DOI] [PMC free article] [PubMed] [Google Scholar]
- 36.Weimbs T. Regulation of mTOR by polycystin-1: is polycystic kidney disease a case of futile repair? Cell Cycle. 2006;5:2425–2429. doi: 10.4161/cc.5.21.3408. [DOI] [PubMed] [Google Scholar]
- 37.Chapman A.B. Autosomal dominant polycystic kidney disease: time for a change? J. Am. Soc. Nephrol. 2007;18:1399–1407. doi: 10.1681/ASN.2007020155. [DOI] [PubMed] [Google Scholar]
- 38.Nauli S.M., Alenghat F.J., Luo Y., Williams E., Vassilev P., Li X., Elia A.E., Lu W., Brown E.M., Quinn S.J., et al. Polycystins 1 and 2 mediate mechanosensation in the primary cilium of kidney cells. Nat. Genet. 2003;33:129–137. doi: 10.1038/ng1076. [DOI] [PubMed] [Google Scholar]
- 39.Yoder B.K., Hou X., Guay-Woodford L.M. The polycystic kidney disease proteins, polycystin-1, polycystin-2, polaris, and cystin, are co-localized in renal cilia. J. Am. Soc. Nephrol. 2002;13:2508–2516. doi: 10.1097/01.asn.0000029587.47950.25. [DOI] [PubMed] [Google Scholar]
- 40.Yoder B.K., Tousson A., Millican L., Wu J.H., Bugg C.E., Jr, Schafer J.A., Balkovetz D.F. Polaris, a protein disrupted in orpk mutant mice, is required for assembly of renal cilium. Am. J. Physiol. Renal Physiol. 2002;282:F541–F552. doi: 10.1152/ajprenal.00273.2001. [DOI] [PubMed] [Google Scholar]
- 41.Badano J.L., Teslovich T.M., Katsanis N. The centrosome in human genetic disease. Nat. Rev. Genet. 2005;6:194–205. doi: 10.1038/nrg1557. [DOI] [PubMed] [Google Scholar]
- 42.Pan J., Wang Q., Snell W.J. Cilium-generated signaling and cilia-related disorders. Lab. Invest. 2005;85:452–463. doi: 10.1038/labinvest.3700253. [DOI] [PubMed] [Google Scholar]
- 43.Afzelius B.A. Cilia-related diseases. J. Pathol. 2004;204:470–477. doi: 10.1002/path.1652. [DOI] [PMC free article] [PubMed] [Google Scholar]
- 44.Pazour G.J., Rosenbaum J.L. Intraflagellar transport and cilia-dependent diseases. Trends Cell Biol. 2002;12:551–555. doi: 10.1016/s0962-8924(02)02410-8. [DOI] [PubMed] [Google Scholar]
- 45.Salisbury J.L. Primary cilia: putting sensors together. Curr. Biol. 2004;14:R765–R767. doi: 10.1016/j.cub.2004.09.016. [DOI] [PubMed] [Google Scholar]
- 46.Nauli S.M., Zhou J. Polycystins and mechanosensation in renal and nodal cilia. Bioessays. 2004;26:844–856. doi: 10.1002/bies.20069. [DOI] [PubMed] [Google Scholar]
- 47.Chodhari R., Mitchison H.M., Meeks M. Cilia, primary ciliary dyskinesia and molecular genetics. Paediatr. Respir. Rev. 2004;5:69–76. doi: 10.1016/j.prrv.2003.09.005. [DOI] [PubMed] [Google Scholar]
- 48.Yokoyama T. Motor or sensor: a new aspect of primary cilia function. Anat. Sci. Int. 2004;79:47–54. doi: 10.1111/j.1447-073x.2004.00072.x. [DOI] [PubMed] [Google Scholar]
- 49.Calvet J.P. Cilia in PKD–letting it all hang out. J. Am. Soc. Nephrol. 2002;13:2614–2616. doi: 10.1681/ASN.V13102614. [DOI] [PubMed] [Google Scholar]
- 50.Lina F., Satlinb L.M. Polycystic kidney disease: the cilium as a common pathway in cystogenesis. Curr. Opin. Pediatr. 2004;16:171–176. doi: 10.1097/00008480-200404000-00010. [DOI] [PubMed] [Google Scholar]
- 51.Taulman P.D., Haycraft C.J., Balkovetz D.F., Yoder B.K. Polaris, a protein involved in left-right axis patterning, localizes to basal bodies and cilia. Mol. Biol. Cell. 2001;12:589–599. doi: 10.1091/mbc.12.3.589. [DOI] [PMC free article] [PubMed] [Google Scholar]
- 52.Mollet G., Silbermann F., Delous M., Salomon R., Antignac C., Saunier S. Characterization of the nephrocystin/nephrocystin-4 complex and subcellular localization of nephrocystin-4 to primary cilia and centrosomes. Hum. Mol. Genet. 2005;14:645–656. doi: 10.1093/hmg/ddi061. [DOI] [PubMed] [Google Scholar]
- 53.Pazour G.J. Intraflagellar transport and cilia-dependent renal disease: the ciliary hypothesis of polycystic kidney disease. J. Am. Soc. Nephrol. 2004;15:2528–2536. doi: 10.1097/01.ASN.0000141055.57643.E0. [DOI] [PubMed] [Google Scholar]
- 54.Schermer B., Ghenoiu C., Bartram M., Muller R.U., Kotsis F., Hohne M., Kuhn W., Rapka M., Nitschke R., Zentgraf H., et al. The von Hippel-Lindau tumor suppressor protein controls ciliogenesis by orienting microtubule growth. J. Cell Biol. 2006;175:547–554. doi: 10.1083/jcb.200605092. [DOI] [PMC free article] [PubMed] [Google Scholar]
- 55.Thoma C.R., Frew I.J., Hoerner C.R., Montani M., Moch H., Krek W. pVHL and GSK3beta are components of a primary cilium-maintenance signalling network. Nat. Cell Biol. 2007;9:588–595. doi: 10.1038/ncb1579. [DOI] [PubMed] [Google Scholar]
- 56.Esteban M.A., Harten S.K., Tran M.G., Maxwell P.H. Formation of primary cilia in the renal epithelium is regulated by the von Hippel-Lindau tumor suppressor protein. J. Am. Soc. Nephrol. 2006;17:1801–1806. doi: 10.1681/ASN.2006020181. [DOI] [PubMed] [Google Scholar]
- 57.Lutz M.S., Burk R.D. Primary cilium formation requires von Hippel-Lindau gene function in renal-derived cells. Cancer Res. 2006;66:6903–6907. doi: 10.1158/0008-5472.CAN-06-0501. [DOI] [PubMed] [Google Scholar]
- 58.Pazour G.J., Dickert B.L., Vucica Y., Seeley E.S., Rosenbaum J.L., Witman G.B., Cole D.G. Chlamydomonas IFT88 and its mouse homologue, polycystic kidney disease gene tg737, are required for assembly of cilia and flagella. J. Cell Biol. 2000;151:709–718. doi: 10.1083/jcb.151.3.709. [DOI] [PMC free article] [PubMed] [Google Scholar]
- 59.Lin F., Hiesberger T., Cordes K., Sinclair A.M., Goldstein L.S., Somlo S., Igarashi P. Kidney-specific inactivation of the KIF3A subunit of kinesin-II inhibits renal ciliogenesis and produces polycystic kidney disease. Proc. Natl Acad. Sci. USA. 2003;100:5286–5291. doi: 10.1073/pnas.0836980100. [DOI] [PMC free article] [PubMed] [Google Scholar]
- 60.Mokrzan E.M., Lewis J.S., Mykytyn K. Differences in renal tubule primary cilia length in a mouse model of Bardet-Biedl syndrome. Nephron Exp. Nephrol. 2007;106:e88–e96. doi: 10.1159/000103021. [DOI] [PubMed] [Google Scholar]
- 61.Smith L.A., Bukanov N.O., Husson H., Russo R.J., Barry T.C., Taylor A.L., Beier D.R., Ibraghimov-Beskrovnaya O. Development of polycystic kidney disease in juvenile cystic kidney mice: insights into pathogenesis, ciliary abnormalities, and common features with human disease. J. Am. Soc. Nephrol. 2006;17:2821–2831. doi: 10.1681/ASN.2006020136. [DOI] [PubMed] [Google Scholar]
- 62.Ansley S.J., Badano J.L., Blacque O.E., Hill J., Hoskins B.E., Leitch C.C., Kim J.C., Ross A.J., Eichers E.R., Teslovich T.M., et al. Basal body dysfunction is a likely cause of pleiotropic Bardet-Biedl syndrome. Nature. 2003;425:628–633. doi: 10.1038/nature02030. [DOI] [PubMed] [Google Scholar]
- 63.Astrinidis A., Senapedis W., Henske E.P. Hamartin, the tuberous sclerosis complex 1 gene product, interacts with polo-like kinase 1 in a phosphorylation-dependent manner. Hum. Mol. Genet. 2006;15:287–297. doi: 10.1093/hmg/ddi444. [DOI] [PubMed] [Google Scholar]
- 64.Quarmby L.M., Parker J.D. Cilia and the cell cycle? J. Cell Biol. 2005;169:707–710. doi: 10.1083/jcb.200503053. [DOI] [PMC free article] [PubMed] [Google Scholar]
- 65.Pugacheva E.N., Jablonski S.A., Hartman T.R., Henske E.P., Golemis E.A. HEF1-dependent Aurora A activation induces disassembly of the primary cilium. Cell. 2007;129:1351–1363. doi: 10.1016/j.cell.2007.04.035. [DOI] [PMC free article] [PubMed] [Google Scholar]
- 66.Zhang H., Cicchetti G., Onda H., Koon H.B., Asrican K., Bajraszewski N., Vazquez F., Carpenter C.L., Kwiatkowski D.J. Loss of Tsc1/Tsc2 activates mTOR and disrupts PI3K-Akt signaling through downregulation of PDGFR. J. Clin. Invest. 2003;112:1223–1233. doi: 10.1172/JCI17222. [DOI] [PMC free article] [PubMed] [Google Scholar]
- 67.Garcia-Gonzalez M.A., Menezes L.F., Piontek K.B., Kaimori J., Huso D.L., Watnick T., Onuchic L.F., Guay-Woodford L.M., Germino G.G. Genetic interaction studies link autosomal dominant and recessive polycystic kidney disease in a common pathway. Hum. Mol. Genet. 2007;16:1940–1950. doi: 10.1093/hmg/ddm141. [DOI] [PMC free article] [PubMed] [Google Scholar]
- 68.Piontek K.B., Huso D.L., Grinberg A., Liu L., Bedja D., Zhao H., Gabrielson K., Qian F., Mei C., Westphal H., et al. A functional floxed allele of Pkd1 that can be conditionally inactivated in vivo. J. Am. Soc. Nephrol. 2004;15:3035–3043. doi: 10.1097/01.ASN.0000144204.01352.86. [DOI] [PubMed] [Google Scholar]
- 69.Hemann M.T., Fridman J.S., Zilfou J.T., Hernando E., Paddison P.J., Cordon-Cardo C., Hannon G.J., Lowe S.W. An epi-allelic series of p53 hypomorphs created by stable RNAi produces distinct tumor phenotypes in vivo. Nat. Genet. 2003;33:396–400. doi: 10.1038/ng1091. [DOI] [PubMed] [Google Scholar]
- 70.Robb V.A., Karbowniczek M., Klein-Szanto A.J., Henske E.P. Activation of the mTOR signaling pathway in renal clear cell carcinoma. J. Urol. 2007;177:346–352. doi: 10.1016/j.juro.2006.08.076. [DOI] [PubMed] [Google Scholar]
- 71.Karbowniczek M., Spittle C.S., Morrison T., Wu H., Henske E.P. mTOR is activated in the majority of malignant melanomas. J. Invest. Dermatol. 2008;128:980–987. doi: 10.1038/sj.jid.5701074. [DOI] [PubMed] [Google Scholar]
- 72.Nachury M.V., Loktev A.V., Zhang Q., Westlake C.J., Peranen J., Merdes A., Slusarski D.C., Scheller R.H., Bazan J.F., Sheffield V.C., et al. A core complex of BBS proteins cooperates with the GTPase Rab8 to promote ciliary membrane biogenesis. Cell. 2007;129:1201–1213. doi: 10.1016/j.cell.2007.03.053. [DOI] [PubMed] [Google Scholar]
- 73.Wilson C., Bonnet C., Guy C., Idziaszczyk S., Colley J., Humphreys V., Maynard J., Sampson J.R., Cheadle J.P. Tsc1 haploinsufficiency without mammalian target of rapamycin activation is sufficient for renal cyst formation in Tsc1+/− mice. Cancer Res. 2006;66:7934–7938. doi: 10.1158/0008-5472.CAN-06-1740. [DOI] [PubMed] [Google Scholar]
- 74.Davies D.M., Johnson S.R., Tattersfield A.E., Kingswood J.C., Cox J.A., McCartney D.L., Doyle T., Elmslie F., Saggar A., de Vries P.J., et al. Sirolimus therapy in tuberous sclerosis or sporadic lymphangioleiomyomatosis. N. Engl. J. Med. 2008;358:200–203. doi: 10.1056/NEJMc072500. [DOI] [PubMed] [Google Scholar]
- 75.Messina M.P., Rauktys A., Lee L., Dabora S.L. Tuberous sclerosis preclinical studies: timing of treatment, combination of a rapamycin analog (CCI-779) and interferon-gamma, and comparison of rapamycin to CCI-779. BMC Pharmacol. 2007;7:14. doi: 10.1186/1471-2210-7-14. [DOI] [PMC free article] [PubMed] [Google Scholar]
- 76.Kenerson H., Dundon T.A., Yeung R.S. Effects of rapamycin in the Eker rat model of tuberous sclerosis complex. Pediatr. Res. 2005;57:67–75. doi: 10.1203/01.PDR.0000147727.78571.07. [DOI] [PubMed] [Google Scholar]
- 77.Lee L., Sudentas P., Donohue B., Asrican K., Worku A., Walker V., Sun Y., Schmidt K., Albert M.S., El-Hashemite N., et al. Efficacy of a rapamycin analog (CCI-779) and IFN-gamma in tuberous sclerosis mouse models. Genes Chromosomes Cancer. 2005;42:213–227. doi: 10.1002/gcc.20118. [DOI] [PubMed] [Google Scholar]
- 78.Gui Y., He G.H., Walsh M.P., Zheng X.L. Predisposition to tetraploidy in pulmonary vascular smooth muscle cells derived from the Eker rats. Am. J. Physiol. Lung Cell. Mol. Physiol. 2007;293:L702–L711. doi: 10.1152/ajplung.00016.2007. [DOI] [PubMed] [Google Scholar]
- 79.Martignoni G., Bonetti F., Pea M., Tardanico R., Brunelli M., Eble J.N. Renal disease in adults with TSC2/PKD1 contiguous gene syndrome. Am. J. Surg. Pathol. 2002;26:198–205. doi: 10.1097/00000478-200202000-00006. [DOI] [PubMed] [Google Scholar]
- 80.Kleymenova E., Ibraghimov-Beskrovnaya O., Kugoh H., Everitt J., Xu H., Kiguchi K., Landes G., Harris P., Walker C. Tuberin-dependent membrane localization of polycystin-1: a functional link between polycystic kidney disease and the TSC2 tumor suppressor gene. Mol. Cell. 2001;7:823–832. doi: 10.1016/s1097-2765(01)00226-x. [DOI] [PubMed] [Google Scholar]
- 81.Low S.H., Vasanth S., Larson C.H., Mukherjee S., Sharma N., Kinter M.T., Kane M.E., Obara T., Weimbs T. Polycystin-1, STAT6 and P100 function in a pathway that transduces ciliary mechanosensation and is activated in polycystic kidney disease. Dev. Cell. 2006;10:57–69. doi: 10.1016/j.devcel.2005.12.005. [DOI] [PubMed] [Google Scholar]
- 82.Xu C., Rossetti S., Jiang L., Harris P.C., Brown-Glaberman U., Wandinger-Ness A., Bacallao R., Alper S.L. Human ADPKD primary cyst epithelial cells with a novel, single codon deletion in the PKD1 gene exhibit defective ciliary polycystin localization and loss of flow-induced Ca2+ signaling. Am. J. Physiol. Renal Physiol. 2007;292:F930–F945. doi: 10.1152/ajprenal.00285.2006. [DOI] [PMC free article] [PubMed] [Google Scholar]
- 83.Huston J., 3rd., Torres V.E., Sulivan P.P., Offord K.P., Wiebers D.O. Value of magnetic resonance angiography for the detection of intracranial aneurysms in autosomal dominant polycystic kidney disease. J. Am. Soc. Nephrol. 1993;3:1871–1877. doi: 10.1681/ASN.V3121871. [DOI] [PubMed] [Google Scholar]
- 84.Schneider L., Clement C.A., Teilmann S.C., Pazour G.J., Hoffmann E.K., Satir P., Christensen S.T. PDGFRalphaalpha signaling is regulated through the primary cilium in fibroblasts. Curr. Biol. 2005;15:1861–1866. doi: 10.1016/j.cub.2005.09.012. [DOI] [PubMed] [Google Scholar]
- 85.Shalom O., Shalva N., Altschuler Y., Motro B. The mammalian Nek1 kinase is involved in primary cilium formation. FEBS Lett. 2008;582:1465–1470. doi: 10.1016/j.febslet.2008.03.036. [DOI] [PubMed] [Google Scholar]
- 86.Tallila J., Jakkula E., Peltonen L., Salonen R., Kestila M. Identification of CC2D2A as a Meckel syndrome gene adds an important piece to the ciliopathy puzzle. Am. J. Hum. Genet. 2008;82:1361–1367. doi: 10.1016/j.ajhg.2008.05.004. [DOI] [PMC free article] [PubMed] [Google Scholar]
- 87.Corbit K.C., Shyer A.E., Dowdle W.E., Gaulden J., Singla V., Chen M.H., Chuang P.T., Reiter J.F. Kif3a constrains beta-catenin-dependent Wnt signalling through dual ciliary and non-ciliary mechanisms. Nat. Cell Biol. 2008;10:70–76. doi: 10.1038/ncb1670. [DOI] [PubMed] [Google Scholar]
- 88.Manning B.D., Tee A.R., Logsdon M.N., Blenis J., Cantley L.C. Identification of the tuberous sclerosis complex-2 tumor suppressor gene product tuberin as a target of the phosphoinositide 3-kinase/akt pathway. Mol. Cell. 2002;10:151–162. doi: 10.1016/s1097-2765(02)00568-3. [DOI] [PubMed] [Google Scholar]
- 89.Manning B.D., Cantley L.C. United at last: the tuberous sclerosis complex gene products connect the phosphoinositide 3-kinase/Akt pathway to mammalian target of rapamycin (mTOR) signalling. Biochem. Soc. Trans. 2003;31:573–578. doi: 10.1042/bst0310573. [DOI] [PubMed] [Google Scholar]
- 90.Cai S.L., Tee A.R., Short J.D., Bergeron J.M., Kim J., Shen J., Guo R., Johnson C.L., Kiguchi K., Walker C.L. Activity of TSC2 is inhibited by AKT-mediated phosphorylation and membrane partitioning. J. Cell Biol. 2006;173:279–289. doi: 10.1083/jcb.200507119. [DOI] [PMC free article] [PubMed] [Google Scholar]
- 91.Tee A.R., Anjum R., Blenis J. Inactivation of the tuberous sclerosis complex-1 and -2 gene products occurs by phosphoinositide 3-kinase/Akt-dependent and -independent phosphorylation of tuberin. J. Biol. Chem. 2003;278:37288–37296. doi: 10.1074/jbc.M303257200. [DOI] [PubMed] [Google Scholar]
- 92.Roux P.P., Ballif B.A., Anjum R., Gygi S.P., Blenis J. Tumor-promoting phorbol esters and activated Ras inactivate the tuberous sclerosis tumor suppressor complex via p90 ribosomal S6 kinase. Proc. Natl. Acad. Sci. USA. 2004;101:13489–13494. doi: 10.1073/pnas.0405659101. [DOI] [PMC free article] [PubMed] [Google Scholar]
- 93.Qian Q., Du H., King B.F., Kumar S., Dean P.G., Cosio F.G., Torres V.E. Sirolimus reduces polycystic liver volume in ADPKD patients. J. Am. Soc. Nephrol. 2008;19:631–638. doi: 10.1681/ASN.2007050626. [DOI] [PMC free article] [PubMed] [Google Scholar]
- 94.Shibazaki S., Yu Z., Nishio S., Tian X., Thomson R.B., Mitobe M., Louvi A., Velazquez H., Ishibe S., Cantley L.G., et al. Cyst formation and activation of the extracellular regulated kinase pathway after kidney specific inactivation of Pkd1. Hum. Mol. Genet. 2008;17:1505–1516. doi: 10.1093/hmg/ddn039. [DOI] [PMC free article] [PubMed] [Google Scholar]
- 95.Serra A.L., Kistler A.D., Poster D., Struker M., Wuthrich R.P., Weishaupt D., Tschirch F. Clinical proof-of-concept trial to assess the therapeutic effect of sirolimus in patients with autosomal dominant polycystic kidney disease: SUISSE ADPKD study. BMC Nephrol. 2007;8:13. doi: 10.1186/1471-2369-8-13. [DOI] [PMC free article] [PubMed] [Google Scholar]
- 96.Kwiatkowski D.J., Zhang H., Bandura J.L., Heiberger K.M., Glogauer M., el-Hashemite N., Onda H. A mouse model of TSC1 reveals sex-dependent lethality from liver hemangiomas, and up-regulation of p70S6 kinase activity in Tsc1 null cells. Hum. Mol. Genet. 2002;11:525–534. doi: 10.1093/hmg/11.5.525. [DOI] [PubMed] [Google Scholar]
Associated Data
This section collects any data citations, data availability statements, or supplementary materials included in this article.