Abstract
The use of visible-near infrared (NIR) spectroscopy was explored as a tool to discriminate two new tomato plant varieties in China (Zheza205 and Zheza207). In this study, 82 top-canopy leaves of Zheza205 and 86 top-canopy leaves of Zheza207 were measured in visible-NIR reflectance mode. Discriminant models were developed using principal component analysis (PCA), discriminant analysis (DA), and discriminant partial least squares (DPLS) regression methods. After outliers detection, the samples were randomly split into two sets, one used as a calibration set (n=82) and the remaining samples as a validation set (n=82). When predicting the variety of the samples in validation set, the classification correctness of the DPLS model after optimizing spectral pretreatment was up to 93%. The DPLS model with raw spectra after multiplicative scatter correction and Savitzky-Golay filter smoothing pretreatments had the best satisfactory calibration and prediction abilities (correlation coefficient of calibration (R c)=0.920, root mean square errors of calibration=0.196, and root mean square errors of prediction=0.216). The results show that visible-NIR spectroscopy might be a suitable alternative tool to discriminate tomato plant varieties on-site.
Keywords: Visible-NIR spectroscopy, Tomato plant variety, Discrimination, Principal component analysis (PCA), Discriminant analysis (DA), Discriminant partial least squares (DPLS)
INTRODUCTION
The development of agricultural science and technology is promoting a large range of commercial varieties in many important agricultural species. The identification of varieties of agricultural and horticultural crops is important during all stages of seed production, trading, and agricultural production and processing (Cooke, 1995b). The expansion of the international trade creates increasing interest in the descriptive characterization of plant varieties in the context of intellectual property protection, stimulated by the recent agreements within the framework of the World Trade Organization (Cooke, 1999). Traditionally, variety identification has been carried out using morphological characters. However, due to modern breeding technology, lack of phenotypic variation causes difficulties for variety identification by the conventional morphological methods. Moreover, modern crop production increasingly demands methods that are more rapid and discriminating. In recent years, a great deal of research has been done on various techniques for realizing a robust identification method, such as molecular markers (Cooke, 1995a; Lee et al., 2005; de Riek et al., 2007) and gene expression profiling (Ancillo et al., 2007), but these methods cannot perform on-site measuring. In addition, they are also expensive and time-consuming.
In previous studies, it was found that near infrared (NIR) spectroscopy has the potential to determine plant pathological conditions (Riedell and Blackmer; 1999; Xu et al., 2007) and to authenticate species based on samples’ spectral properties (Chen et al., 1998). Kim et al.(2000) used linear discriminant analysis (LDA) and non-linear techniques based on multilayer perceptrons (MLPs) with variations on back-propagation (BP) learning to classify kiwifruit grown under different conditions, using a range of features extracted from visible-NIR spectra. Results indicate that the performance of non-linear models was significantly better in comparison to the linear model, LDA. Noble and Crowe (2001) developed classifiers using five features extracted from diffuse reflectance spectra in the region of 250~2500 nm to distinguish six plant species. The accuracies were greater than 90%. Perez et al.(2001) used NIR reflectance spectroscopy to authenticate two green asparagus varieties using modified partial least square regression. In their results, the standard error of cross-validation and coefficient of determination were 0.082 and 0.97, respectively. Fu et al.(2007) explored the use of Fourier transform NIR spectrometry to discriminate three pear varieties, applying discriminant partial least squares (DPLS), discriminant analysis (DA) and probabilistic neural networks calibration models developed in the region of 800~2500 nm, and gained a high classification accuracy of 97.5%~100%. Wang and Paliwal (2006) used NIR spectroscopy to differentiate six classes of wheat by five classifiers. Classification was performed on principal component score (PCS), Fourier coefficients, and wavelet coefficients of the original spectral data. LDA combined with principal component analysis (PCA) as a pre-processing method had the best classification accuracies. Yee et al.(2006) used NIR spectra to identify the potato tuber variety based on LDA pattern recognition techniques. The success rate in separating the spectra into respective classes was 93%. Chen et al.(2007) studied the differentiation of three tea categories using support vector machine (SVM). The top five latent variables extracted by PCA were used as the input of SVM classifiers. The identification rates of the three teas were up to 90%, 100%, and 93.3%.
The objective of this study was to apply visible-NIR reflectance spectroscopy for discrimination of two new commercial tomato plant varieties in China (Zheza205 and Zheza207). The specific goals were: (1) to investigate the potential of visible-NIR reflectance spectroscopy in on-site plant varieties discrimination; (2) to compare the modeling performance of the three discriminant models based on PCA, DA, and DPLS.
MATERIALS AND METHODS
Experimental materials
Two new varieties of tomato plants (Zheza205 and Zheza207, bred by Zhejiang Academy of Agricultural Science, China) were cultivated in an environmentally controlled artificial climate chamber at Zhejiang University. Leaf-level reflectance measurements were made at the mid growth stage of tomato plant (about 20 cm height). We selected 82 top-canopy leaves of Zheza205 and 86 top-canopy leaves of Zheza207 to perform on-site measuring on the same day (at 30.4 °C with relatively humidity of 57.8%).
NIR spectra acquisition
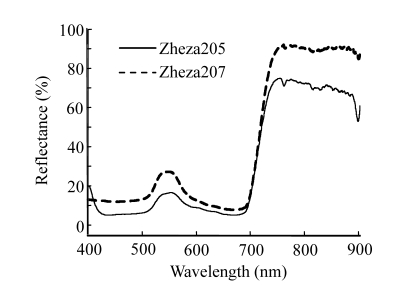
The visible-NIR reflectance spectra were collected by a commercial USB2000 spectrometer (Ocean Optics Inc., USA). The USB2000 spectrometer was equipped with a grating (600 lines blazed at 500 nm), a detector (350~1100 nm) with a resolution of 1.5 nm, and an optical fiber cable. The optical fiber was placed 5 mm away from the leaf and directed to the center of the illuminated area at 45° to the light fiber to collect the dispersed light from the leaf as described elsewhere (Cervantes-Martínez et al., 2002). The spectrum of each leaf sample was the average of 5 successive scans. Spectral data acquisition and manipulation were performed in real time with a microcomputer and commercially available software OOIBase32 (Ocean Optics Inc., USA). In this study, only the spectral information between 400~900 nm (Fig.1) was used for analyzing because the signal-to-noise ratio was very low beyond 900 nm.
Fig. 1.
Visible-NIR spectra of tomato plant samples of two varieties
Data processing and discriminant analysis
PCA, DA, and DPLS methods were performed using TQ Analyst v6.2.1 software (Thermo Electron Corp., USA). After spectral outliers removal using a standardized H value (Workman, 2001; Steuer et al., 2001), the remaining 164 samples’ spectra were analyzed using PCA and DA on the raw spectra with multiplicative scatter correction (MSC) pretreatment. For DPLS discriminant analysis, the remaining 164 samples were divided into two sets randomly, namely, a calibration set and a validation set, with each comprising 82 top-canopy leaves of Zheza205 or 82 top-canopy leaves of Zheza207. The derivative treatments “0, 5, 3” and “1, 5, 3” were used to reduce baseline variation and spectral smoothing after MSC pretreatment, respectively, where the 1st digit is the number of the derivative, the 2nd one is the length of the Savitzky-Golay filter, and the 3rd one is the polynomial order of the Savitzky-Golay filter (Perez et al., 2001).
PCA is a method to reduce the dimensionality of a dataset composed of a large number of variables by transforming the original dataset into a new set of variables, the PCS, which are orthogonal and uncorrelated to each other and are ordered so that the first few PCS retain most of the variation present in all of the original variables (Cozzolino et al., 2003; Lee et al., 2003). PCA was used in further analysis to examine the interrelationships between different variables, and to interpret sample patterns, groupings, similarities, or differences (Cozzolino et al., 2003; Cozzolino and Murray, 2004; Mouazen et al., 2006; Xie et al., 2007b).
DA is a qualitative tool used to group (or classify) spectra into pre-defined classes. In this study, DA was used to classify the two varieties of tomato plants, Zheza205 and Zheza207, by computing a sample’s distance from each class center in Mahalanobis distance (MD) units. The MD is the parameter that is calculated to determine how close to the center of gravity of its group an individual sample spectrum is. The closer MD is to zero, the better is the match. As such, the smallest MD is used to pick the group that the individual fits best.
In DPLS regression technique, analysis was performed using the dummy regression technique as described elsewhere (Perez et al., 2001; Cozzolino et al., 2003; Xie et al., 2007b). Each sample in the calibration and validation sets is assigned a dummy variable (1 or 2) as a reference value, an arbitrary number indicating whether the sample belongs to a particular group or not (Xie et al., 2007b). In this case, samples of Zheza205 were assigned a numeric value of 1 and samples of Zheza207 a numeric value of 2. The DPLS model was developed by regression of the spectral data (the first derivative) against the assigned reference value (dummy variable), and then was tested for accuracy by using it to predict the variety of samples in the validation set. A sample was classified as Zheza205 if its predicted value was between 0.5 and 1.5, and it was classified as Zheza207 if the value was between 1.5 and 2.5 as described by Cozzolino et al.(2003) and Xie et al.(2007b). The discriminant accuracy was described by the correlation coefficient of calibration (R c) and the root mean square errors of prediction (RMSEP).
The DPLS regression equation can be simply formulated as described by Alsberg et al.(1998):
| Y=XB, | (1) |
where X is the data matrix created with the spectra of samples. Each row of the matrix X contains the spectrum of a sample, and each column contains the intensity at each wavelength; the matrix Y constructed with dummy variables contains information about class memberships of samples; the matrix B represents the estimated regression coefficients (Wang et al., 1998).
And the RMSEP is done by
 , ,
|
(2) |
where ŷi represents the predicted value of the ith observation, yi represents the measured value of the ith observation, and N p is the number of observations in the prediction set.
Microscopy analysis
Tomato leaf tissues (1 mm×3 mm) of Zheza205 and Zheza207 were fixed with 2.5% (v/v) glutaraldehyde overnight at 4 °C and subsequently with 1% (w/v) osmium acid for 1~2 h. After fixation, the tissues were washed three times in phosphate buffer (pH=7.0) for 15 min each, and dehydrated in a graded ethanol series (50%, 70%, 80%, 90%, 95%, and 100%, v/v) for 15~20 min each and in 100% acetone for 20 min. The tissues were embedded in 1:1 (v/v) mixture of the embedding medium (Spurr epoxy resin) and 100% acetone for 1 h at room temperature, then in 3:1 (v/v) mixture of the embedding medium and 100% acetone for 3 h, and in 100% embedding medium overnight. Finally, the tissues were placed in capsules containing embedding medium at 70 °C overnight. The embedded material was sectioned into slices (70~90 nm) with a diamond knife on an ultra microtome (Reichert Ultracut E, Germany) and was stained by 50% (v/v) uranyl acetate and lead citrate for 15 min, respectively. Stained samples were observed with a JEM-1230 transmission electron microscope (JEOL Co., Ltd., Japan).
RESULTS
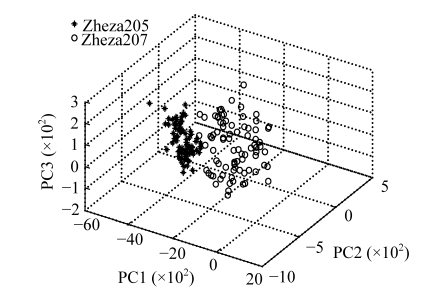
PCA was performed on the raw spectra to examine qualitative differences between the two tomato plant varieties. The first three PCS (95.422% of the variation explained) of the visible-NIR data were plotted in Fig.2. PC1 explained 66.342% of the total variation in the samples, PC2 26.859%, and PC3 2.222%. The three-dimension score plot showed two major clusters of samples related with the two different tomato plant varieties. This confirmed the assumptions that discrimination between varieties was possible and that different spectral attributes between samples were associated with characteristics of the tomato plants depending on the varieties (Cozzolino and Murray, 2004; Xie et al., 2007b). As PCA only indicates the visualizing dimension spaces, DA and DPLS were utilized for an improved discrimination as described elsewhere (Xie et al., 2007b).
Fig. 2.
The first three PCS used for discrimination between Zheza205 and Zheza207
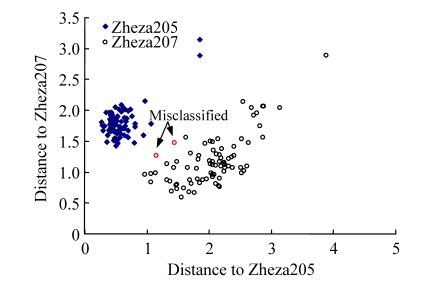
A DA model was developed on the first eight PCS resulting from the PCA as they covered most of the variation (99.9% of variation described) contained in the raw spectra. This model was used to classify the two tomato plant varieties. Two Zheza207 samples were misclassified as Zheza205; i.e., the MD to the center of the gravity of Zheza207 group is superior to that to the center of the gravity of Zheza205 group, and 100% of Zheza205 samples were classified correctly by the DA discriminant model (Fig.3).
Fig. 3.
Classification result of Zheza205 and Zheza207 using the DA method
The calibration and validation statistics and performances of the dummy classification models using PLS regression method are shown in Table 1. All the models developed had a coefficient of determination in calibration (R c) higher than 0.80 and most of the samples in calibration and prediction sets were classified correctly by the classification models (>93%). From Table 1, it is clear that models using the 1st derivative data led to high RMSEP values and relatively low root mean square errors of calibration (RMSEC) values compared with raw spectral data. These results generally could be due to overfitting of the calibration. Similar discrimination results were reported previously by Wang et al.(2006). The discrimination model by the “1, 5, 3” derivative treatment with three factors resulted in RMSEC=0.184 and RMSEP=0.239, which were better than those of the same derivative treatment with only one factor. Factor increase led to reduction of the RMSEC and improved the classification accuracy in calibration, but not as significant as in prediction. Overall, the results show that the model producing the best prediction is the one that combines MSC and Savitzky-Golay filter smoothing pretreatments in the range of 400~900 nm using raw visible-NIR spectra with three factors.
Table 1.
Statistics and performances of DPLS discriminant model for the two tomato plant varieties
| No. | Data pretreatment | Derivative treatment | Factors | Calibration |
Prediction |
|||||
| Rc | RMSEC | nc | Pc (%) | RMSEP | nc | Pc (%) | ||||
| 1 | MSC | “0, 5, 3” | 3 | 0.920 | 0.196 | 81 | 98.78 | 0.216 | 80 | 97.56 |
| 2 | MSC | “1, 5, 3” | 1 | 0.800 | 0.300 | 77 | 93.90 | 0.278 | 77 | 93.90 |
| 3 | MSC | “1, 5, 3” | 3 | 0.930 | 0.184 | 82 | 100 | 0.239 | 77 | 93.90 |
MSC: multiplicative scatter correction; R c: coefficient of determination in calibration; RMSEC: root mean square errors of calibration; RMSEP: root mean square errors of prediction; n c: number classified correctly; P c: percentage classified correctly
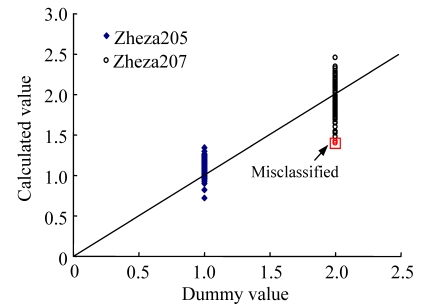
Fig.4 shows the visible-NIR predictions of the two tomato plant varieties in the calibration set (n=164) using the best DPLS model by the “0, 5, 3” derivative treatment. Fig.4 clearly shows that two Zheza207 samples were misclassified as Zheza205 (i.e., the calculated values below 1.5) but 100% of Zheza205 samples were classified correctly.
Fig. 4.
Dummy vs calculated values of Zheza205 and Zheza207 using DPLS model by the “0, 5, 3” derivative treatment (in calibration, n=164)
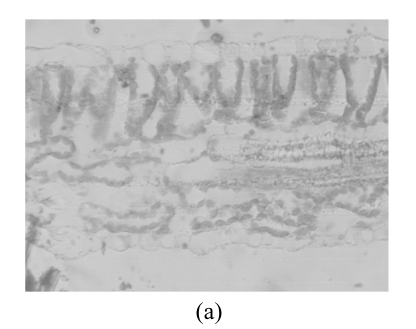
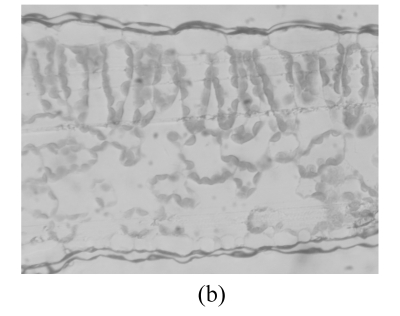
Fig.5 shows the transmission electron microscope (TEM) images of the sections of Zheza205 and Zheza207 tomato plant leaf tissues. As shown in the TEM images, there is a transparent waxy cuticle layer at the top of the Zheza207 tomato leaf (Fig.5b), but no waxy cuticle layer at the top of Zheza205 tomato leaf (Fig.5a). The cuticular wax plays a critical role in the interaction of light with the leaves (Holmes and Keiller, 2002), and is known to increase the reflectance of the leaves (Vogelmann, 1993). We also see from Fig.1 that reflectance was significantly higher from the Zheza207 tomato leaf with a waxy cuticle layer than from the Zheza205 tomato leaf.
Fig. 5.
TEM images of the sections of tomato plant leaf tissues. (a) Zheza205; (b) Zheza207
DISCUSSION
The ability of visible-NIR model to discriminate or identify plant varieties is based on the leaf spectral properties that are related to the leaf biochemical composition and structure, which depend on many factors such as the plant species, the development or microclimate position of the leaf on the plant (Jacquemoud and Ustin, 2001). The visible-NIR optical domain ranges can be divided into two parts: in the visible spectra (400~750 nm), leaf reflectance is low because of absorption by photosynthetic pigments (mainly chlorophylls and carotenoids); in the short-wavelength near infrared (SW-NIR) domain (750~1300 nm), where there are no strong absorption features, and the magnitude of reflectance is governed by structural discontinuities encountered in the leaf.
Leaf structure difference and physiological and ecological changes on plants caused by the influence of man or nature can affect the optical properties (Borregaard et al., 2000). Several studies on plant variety discrimination based on their optical properties have been carried out, such as authentication of green asparagus varieties (Perez et al., 2001), discrimination of different classes of wheat (Wang and Paliwal, 2006), identification of green, black and Oolong teas (Chen et al., 2007), and classification of nontransgenic and transgenic tomatoes (Xie et al., 2007a; 2007c). These studies have proven that visible-NIR spectroscopy is an accurate technology for identification and authentication of plant varieties.
CONCLUSION
This study shows that visible-NIR spectroscopy, together with chemometric techniques such as PCA, DA, and DPLS, could be used for the identification of plant varieties on-site. Our results indicate that an excellent classification can be obtained by DPLS method after optimizing spectral data pretreatment, with accuracy up to 93%. Further studies are needed to improve the calibration accuracy and robustness with more samples and to extend the discrimination to other plant varieties.
Footnotes
Project (No. 60405003) supported by the National Natural Science Foundation of China
References
- 1.Alsberg BK, Kell DB, Goodacre R. Variable selection in discriminant partial least-squares analysis. Anal Chem. 1998;70(19):4126–4133. doi: 10.1021/ac980506o. [DOI] [PubMed] [Google Scholar]
- 2.Ancillo G, Gadea J, Forment J, Guerri J, Navarro L. Class prediction of closely related plant varieties using gene expression profiling. J Exp Bot. 2007;58(8):1927–1933. doi: 10.1093/jxb/erm054. [DOI] [PubMed] [Google Scholar]
- 3.Borregaard T, Nielsen H, Nørgaard L, Have H. Crop-weed discrimination by line imaging spectroscopy. J Agric Eng Res. 2000;75(4):389–400. doi: 10.1006/jaer.1999.0519. [DOI] [Google Scholar]
- 4.Cervantes-Martínez J, Flores-Hernández R, Rodríguez-Garay B, Santacruz-Ruvalcaba F. Detection of bacterial infection of agave plants by laser-induced fluorescence. Appl Optics. 2002;41(13):2541–2545. doi: 10.1364/AO.41.002541. [DOI] [PubMed] [Google Scholar]
- 5.Chen LM, Carpita NC, Reiter WD, Wilson RH, Jeffries C, McCann MC. A rapid method to screen for cell-wall mutants using discriminant analysis of Fourier transform infrared spectra. Plant J. 1998;16(3):385–392. doi: 10.1046/j.1365-313x.1998.00301.x. [DOI] [PubMed] [Google Scholar]
- 6.Chen QS, Zhao JW, Fang CH, Wang DM. Feasibility study on identification of green, black and oolong teas using near infrared reflectance spectroscopy based on support vector machine. Spectrochim Acta A. 2007;66(3):568–574. doi: 10.1016/j.saa.2006.03.038. [DOI] [PubMed] [Google Scholar]
- 7.Cooke RJ. Gel electrophoresis for the identification of plant varieties. J Chromatogr A. 1995;698(1-2):281–299. doi: 10.1016/0021-9673(94)00649-T. [DOI] [Google Scholar]
- 8.Cooke RJ. Introduction: The Reasons for Variety Identification. In: Wrigley CW, editor. Identification of Food Grain Varieties. USA: AACC; 1995. pp. 1–18. [Google Scholar]
- 9.Cooke RJ. New approaches to potato variety identification. Potato Res. 1999;42(3-4):529–539. doi: 10.1007/BF02358169. [DOI] [Google Scholar]
- 10.Cozzolino D, Murray I. Identification of animal meat muscles by visible and near infrared reflectance spectroscopy. Lebensm-Wiss u-Technol. 2004;37(4):447–452. doi: 10.1016/j.lwt.2003.10.013. [DOI] [Google Scholar]
- 11.Cozzolino D, Smyth HE, Gishen M. Feasibility study on the use of visible and near infrared spectroscopy together with chemometrics to discriminate between commercial white wines of different varietal origins. J Agric Food Chem. 2003;51(26):7703–7708. doi: 10.1021/jf034959s. [DOI] [PubMed] [Google Scholar]
- 12.de Riek J, Everaert I, Esselink D, Calsyn E, Smulders MJM, Vosman B. Assignment tests for variety identification compared to genetic similarity-based methods using experimental datasets from different marker systems in sugar beet. Crop Sci. 2007;47(5):1964–1974. doi: 10.2135/cropsci2006.04.0265. [DOI] [Google Scholar]
- 13.Fu XP, Zhou Y, Ying YB, Lu HS, Xu HR. Discrimination of pear varieties using three classification methods based on near infrared spectroscopy. Trans ASABE. 2007;50(4):1355–1361. [Google Scholar]
- 14.Holmes MG, Keiller DR. Effects of pubescence and waxes on the reflectance of leaves in the ultraviolet and photosynthetic wavebands: a comparison of a range of species. Plant Cell Environ. 2002;25(1):85–93. doi: 10.1046/j.1365-3040.2002.00779.x. [DOI] [Google Scholar]
- 15.Jacquemoud S, Ustin SL. Leaf Optical Properties: A State of the Art; Proceedings of the 8th International Symposium on Physical Measurements and Signatures in Remote Sensing; Aussois, France: 2001. pp. 223–232. [Google Scholar]
- 16.Kim J, Mowat A, Poole P, Kasabov N. Linear and non-linear pattern recognition models for classification of fruit from visible-near infrared spectra. Chemometr Intell Lab Syst. 2000;51(2):201–216. doi: 10.1016/S0169-7439(00)00070-8. [DOI] [Google Scholar]
- 17.Lee D, Reeves JC, Cooke RJ. DNA profiling and plant variety registration: 1. the use of random amplified DNA polymorphisms to discriminate between varieties of oilseed rape. Electrophoresis. 2005;17(1):261–265. doi: 10.1002/elps.1150170145. [DOI] [PubMed] [Google Scholar]
- 18.Lee KH, Zhang NQ, Das S. Comparing Adaptive Neuro-fuzzy Inference System (ANFIS) to Partial Least-squares (PLS) Method for Simultaneous Prediction of Multiple Soil Properties. Las Vegas, Nevada, USA: 2003. ASAE Paper No. 033144. [Google Scholar]
- 19.Mouazen AM, Karoui R, Baerdemaeker JD, et al. Classification of Soils into Different Moisture Content Levels Based on VIS-NIR Spectra. Portland, USA: 2006. ASABE Paper No. 061067. [Google Scholar]
- 20.Noble SD, Crowe TG. Plant Discrimination Based on Leaf Reflectance. Sacramento, California, USA: 2001. ASABE Paper No. 011150. [Google Scholar]
- 21.Perez DP, Sanchez MT, Cano G, Garrido A. Authentication of green asparagus varieties by near infrared reflectance spectroscopy. J Food Sci. 2001;66(2):323–327. doi: 10.1111/j.1365-2621.2001.tb11340.x. [DOI] [Google Scholar]
- 22.Riedell WE, Blackmer TM. Leaf reflectance spectra of cereal aphid-damaged wheat. Crop Sci. 1999;39(6):1835–1840. [Google Scholar]
- 23.Steuer B, Schulz H, Lager E. Classification and analysis of citrus oils by NIR spectroscopy. Food Chem. 2001;72(1):113–117. doi: 10.1016/S0308-8146(00)00209-0. [DOI] [Google Scholar]
- 24.Vogelmann TC. Plant tissue optics. Annu Rev Plant Physiol Plant Mol Biol. 1993;44(1):231–251. doi: 10.1146/annurev.pp.44.060193.001311. [DOI] [Google Scholar]
- 25.Wang CY, Chen CT, Chiang CP, Young ST, Chow SN, Chiang HK. Partial least-squares discriminant analysis on autofluorescence spectra of oral carcinogenesis. Appl Spectrosc. 1998;52(9):1190–1195. doi: 10.1366/0003702981945002. [DOI] [Google Scholar]
- 26.Wang L, Frank Lee SC, Wang XR, He Y. Feasibility study of quantifying and discriminating soybean oil adulteration in camellia oils by attenuated total reflectance MIR and fiber optic diffuse reflectance NIR. Food Chem. 2006;95(3):529–536. doi: 10.1016/j.foodchem.2005.04.015. [DOI] [Google Scholar]
- 27.Wang W, Paliwal J. Spectral data compression and analyses techniques to discriminate wheat classes. Trans ASABE. 2006;49(5):1607–1612. [Google Scholar]
- 28.Workman J. NIR Spectroscopy Calibration Basics. In: Burns DA, Ciurczak EW, editors. Handbook of near Infrared Analysis. 2nd Ed. New York: Marcfl Dfkker, Inc; 2001. pp. 90–129. [Google Scholar]
- 29.Xie LJ, Ying YB, Ying TJ. Combination and comparison of chemometrics methods for identification of transgenic tomatoes using visible and near-infrared diffuse transmittance technique. J Food Eng. 2007;82(3):395–401. doi: 10.1016/j.jfoodeng.2007.02.062. [DOI] [Google Scholar]
- 30.Xie LJ, Ying YB, Ying TJ, Yu HY. Discrimination of transgenic tomatoes based on visible/near-infrared spectra. Anal Chim Acta. 2007;584(2):379–384. doi: 10.1016/j.aca.2006.11.071. [DOI] [PubMed] [Google Scholar]
- 31.Xie LJ, Ying YB, Ying TJ. Quantification of chlorophyll content and classification of nontransgenic and transgenic tomato leaves using visible/near-infrared diffuse reflectance spectroscopy. J Agric Food Chem. 2007;55(12):4645–4650. doi: 10.1021/jf063664m. [DOI] [PubMed] [Google Scholar]
- 32.Xu HR, Ying YB, Fu XP, Zhu SP. Near infrared spectroscopy in detecting leaf miner damage on tomato leaf. Biosyst Eng. 2007;96(4):447–454. doi: 10.1016/j.biosystemseng.2007.01.008. [DOI] [Google Scholar]
- 33.Yee N, Bussell WT, Coghill GG. Use of near infrared spectra to identify cultivar in potato (Solanum tuberosum) crisps. New Zeal J Crop Hort. 2006;34(2):177–181. [Google Scholar]


