Abstract
We provide quantitative anatomical data on the muscle–tendon architecture and geometry of the pelvic limb of an elite sprint athlete, the racing greyhound. Specifically, muscle masses, muscle lengths, fascicle lengths, pennation angles and muscle moment arms were measured. Maximum isometric force and power of muscles, the maximum muscle torque at joints and tendon stress and strain were estimated. We compare data with that published for a generalized breed of canid, and other cursorial mammals such as the horse and hare. The pelvic limb of the racing greyhound had a relatively large volume of hip extensor muscle, which is likely to be required for power production. Per unit body mass, some pelvic limb muscles were relatively larger than those in less specialized canines, and many hip extensor muscles had longer fascicle lengths. It was estimated that substantial extensor moments could be created about the tarsus and hip of the greyhound allowing high power output and potential for rapid acceleration. The racing greyhound hence possesses substantial specializations for enhanced sprint performance.
Keywords: architecture, biomechanics, greyhound, locomotion, moment arms, muscle, sprinting, tendon
Introduction
Greyhounds are elite sprinting athletes, having undergone intense artificial selection for high-speed running and aerobic stamina. They reach speeds of up to 17 m s−1 for short periods of time during racing (Jayes & Alexander, 1982; Usherwood & Wilson, 2005). One prerequisite to effective sprinting is the ability to rapidly accelerate. Acceleration requires a large amount of mechanical work to be performed to increase the kinetic energy of the body. The pelvic limb anatomy of cursorial quadrupeds appears to be specialized for ‘doing’ net work and achieving high power output (Payne et al. 2005). It is predominantly hip extensor muscles that are capable of this high power production – unsurprising as quadrupedal runners have been described as ‘rear-wheel drive’, relying on torque generation at the hip to propel the centre of mass forwards (Haxton, 1947; Usherwood & Wilson, 2005).
Muscle architecture is a primary determinant of muscle function (Lieber & Blevins, 1989; Lieber, 1993; Lieber & Friden, 2000). For example, obtainable muscle power is proportional to muscle volume (Zajac, 1989, 1992), whilst capacity for maximum isometric force generation, Fmax, can be estimated from the physiological cross-sectional area (PCSA) of a muscle. In addition, understanding of the dynamic role of the limb can be enhanced by obtaining measures of muscle moment arms (the perpendicular distance between the line of action of muscle force to the joint centre of rotation). Moment arms transform the linear forces developed by muscles into rotational moments that result in joint movements. Moment arms often vary with joint angle (Thorpe et al. 1999; Payne et al. 2006a) and so the relationship between linear and angular displacement, and hence muscle dynamics, varies through the stride cycle. The ground reaction force (GRF) moment arm may also vary through the stride, and as limb effective mechanical advantage (EMA) depends on both of the above it could change dramatically through a stride. This has important implications for the relationship between muscle force and velocity, and centre of mass force and velocity that could be important in achieving versatility of locomotor function. This is also important, as an increase in EMA decreases the mass-specific muscle force required to maintain support during postural and locomotor behaviours (Biewener, 1983).
Studies of muscle–tendon architecture in dogs have been performed previously; however, these were either undertaken in mixed-breed dogs (Shahar & Milgram, 2001) or examined only a few variables from a small selection of muscles (Jayes & Alexander, 1982; Pasi & Carrier, 2003). To obtain a full understanding of the functional design of the musculo-skeletal system, and thus locomotor capabilities of racing greyhounds, more detailed measurements are needed. Muscle–tendon architecture differs markedly between species and breeds that are adapted for different locomotor functions (Pasi & Carrier, 2003; Payne et al. 2006b). In addition, there is evidence that exercise training can alter muscle architecture (Kawakami et al. 1995; Abe et al. 2000; Aagaard et al. 2001; Blazevich et al. 2003). Here we will specifically consider racing greyhounds as an example of the canid most likely to show extreme adaptations for sprinting. We aim to provide detailed muscle and tendon architectural measures along with quantification of muscle moment arms. These will be analysed and compared with published data from other species of fast runner and from mixed-breed dogs, to reveal how the musculo-skeletal system of the racing greyhound is able to facilitate such an outstanding capacity for high-speed sprinting.
Materials and methods
Six racing greyhound cadavers (mass 31.8 ± 2.6 kg) of unknown age (though all were fully mature and young) were obtained less than 24 h after euthanasia by a greyhound racing track vet. All dogs had been racing competitively and training regularly until death, and were euthanized for a variety of reasons including racing injury (injured limbs were not dissected) and aggressive behaviour. Cadavers were immediately frozen at –20 °C and then stored at 4 °C for 48 h prior to dissection. Six left pelvic limbs were dissected to enable measurement of muscle–tendon architecture variables for all of the major pelvic limb muscles. Four right pelvic limbs were used to quantify muscle moment arms.
Muscle architecture
Muscles were systematically removed from the limbs. Incisions were made in the muscle bellies along the plane of the muscle fascicles (bundles of individual muscle fibres, visible to the naked eye). The lengths of a random selection of 10 fascicles, taken from different areas of the belly, were measured with digital callipers. The measurement of muscle fascicles allows an estimate, rather than microscopic measurement, of muscle fibre length. The tendons of origin and insertion (if present) were removed, and tendon- and muscle belly length and mass were measured [using a plastic-coated flexible tape measure and set of electronic scales (EKS)]. Resting pennation angle (to the nearest degree) was also measured using a clear plastic protractor, and was defined as the angle between the internal tendon (or aponeurosis) and the muscle fascicles.
Mean tendon cross-sectional area (CSA) was determined by dividing tendon volume [tendon mass divided by a published value for tendon density of 1.12 g cm−3 (Ker et al. 1988)] by tendon length. Muscle volume was determined by dividing muscle mass by a muscle density of 1.06 g cm−3 (Mendez & Keys, 1960). PCSA was calculated as muscle volume/fascicle length. Isometric Fmax was estimated by multiplying 0.3 MPa – the maximum isometric stress of vertebrate skeletal muscle (Wells, 1965; Medler, 2002) – by PCSA. Some studies correct calculations of PCSA (and consequently Fmax) for pennation angle, as an oblique pennation angle means that a muscle may experience a loss in vector force along its line of pull. In such cases, PSCA is calculated as (muscle mass × cos θ)/(muscle density × fibre length), where θ is the pennation angle. We present Fmax results for both methods here for comparison; however, values in our graphs and final discussions are conducted without the correction as most pennation angles are small (i.e. less than 30°, and thus θ remains close to one). In addition there is convincing evidence that pennation angle alters substantially during muscle contraction (e.g. Herbert & Gandevia, 1995; Azizi et al. 2008) and, also, the calculation of Fmax itself is not exactly precise due to the wide range of muscle stresses available in the literature. Architectural Index (AI) was calculated for muscles, which is an index that normalizes muscle fascicle lengths for muscle length. It is useful as it allows comparison of relative fascicle lengths in muscles of different sizes, giving information about the configuration and shape of the muscle. It is calculated as the ratio of muscle fascicle length to total muscle belly length.
Tendon stress at maximum isometric muscle force was estimated by dividing Fmax by the tendon CSA; this value was divided by the Young's modulus of tendon [taken to be 1.5 GPa as in Bennett et al. (1986) and Ker et al. (1988)] to obtain estimates of tendon strain. Tendon length change was estimated as the product of tendon resting length and tendon strain. Instantaneous muscle power was estimated as one tenth of the product of Fmax and maximum fibre contraction velocity, Vmax (Hill, 1938). A value of 3.8 Los−1 was taken as Vmax of dog muscle (Lo= muscle fibre resting length). This value was taken from in situ measurements from canine gastrocnemius muscle (Ameredes et al. 1992) and is the closest available estimate for this parameter. Of course this is only approximate; it is important to stress here that these calculations of Fmax and Vmax can only provide us with information regarding patterns of muscle functional capacity and not accurate quantitative values.
Muscle moment arms
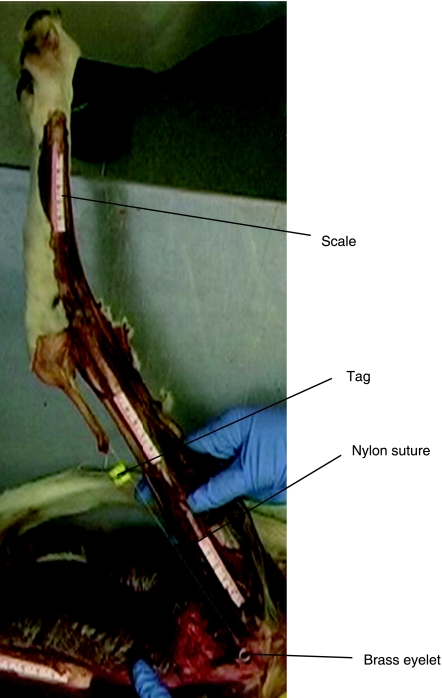
In a consistent order, flexion–extension moment arms of the major pelvic limb muscles at the hip, stifle and tarsus were obtained using the tendon travel method (Spoor & van Leeuwen, 1992). This method works on the principle that the distance a tendon moves while the limb travels through an angle in radians, is equal to the perpendicular distance between the tendon and joint axis (the moment arm). In simple terms, tendon displacement is determined with respect to the angle of the joint, enabling calculation of the ‘effective moment arm’. Muscle bellies were transected and nylon suture sewn into the stump of the muscle at its insertion. Millimetre scales were super-glued (Loctite, USA) onto the longitudinal axis of the long bones approximately in the plane of the tendon to allow calibration and measurement of the tendon excursion from photographs. Brass eyelets (0.5 mm diameter) were screwed into predrilled holes in the long bones at the origin of each muscle (or as close as possible), through which the suture nylon was passed. A 50-g weight was tied to the end of the suture nylon and allowed to hang over the edge of the dissection table to ensure the nylon remained taut throughout. A small marker was fixed to the nylon between the muscle stump and the eyelet. A digital camera (Nikon D70) was positioned perpendicular to the plane of joint motion, and digital images were acquired at 10° intervals, as the joint was moved from maximum joint extension to maximum joint flexion, and reverse. The marker, eyelet, and millimetre scales were visible on each image (see Fig. 1). Tendon travel was defined as the change in length between the marker and eyelet through joint motion. Joint angle was determined using the millimetre scales. Moment arms from muscles with wide origins were measured by using a number of eyelets at the origin, completing the procedure for each section of the origin, and obtaining an average measure for tendon travel based on the mean tendon travel at each origin/eyelet position. For muscles that crossed more than one joint, the joint not of primary interest was held in a fixed and neutral position throughout measurement.
Fig. 1.
Photograph depicting the experimental set-up for obtaining muscle moment arms. See text for full method.
Pictures were manually digitized using freeware software (ImageJ, National Institute of Health, Bethesda, MD, USA), and graphs of tendon excursion versus joint angle in radians were plotted. Only joint angles within a realistic range in terms of possible limb postures during locomotion were considered (30–180°). Linear or second/third order polynomial lines of best fit were plotted. These were determined by selecting the lowest order polynomial regression line that visually fitted the data. Plots were visually inspected, and individual estimates of moment arm were taken from photographs to ensure that regressions fitted the real trend of the data, and not just because a high order of polynomial was used. Resulting polynomial regression equations were differentiated to give the value for the moment arm (Hughes et al. 1998). For example a regression equation of y = aθ2 + bθ + c differentiates to give dy/dθ= 2aθ+b, which is the relationship between joint angle (θ) and instantaneous moment arm (y), given that moment arms change with joint angle. The maximum moment of force of a muscle about its joint, M, was calculated using additional information from dissections (see before) as
(1.1)
where σ is the maximum isometric stress of muscle (estimated at 0.3 MPa for vertebrate muscle Wells, 1965), A the cross-sectional area of the muscle, and r the maximum muscle moment arm.
Statistical analysis
Selected greyhound muscle and tendon architectural parameters were compared with those in a mixed-breed dog (Shahar & Milgram, 2001) via an independent samples Student's t-test (significance level of P < 0.05).
Results
Muscle anatomy and architecture
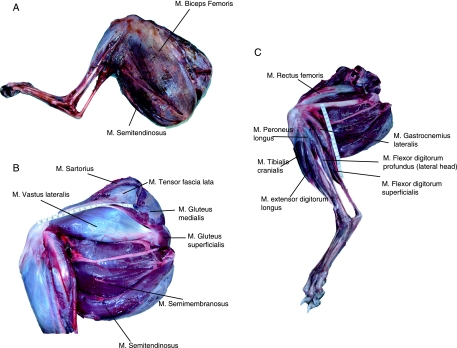
The mean total mass of the major muscles of the pelvic limb was 2769 ± 46 g (mean ± SD). When both pelvic limbs were accounted for, this represents 18.5 ± 0.3% of the total body mass of a racing greyhound. In total, 21 of the muscles of the pelvic limb were considered in this study; their locations within the limb are identified in Fig. 2, and abbreviations detailed in Table 1. Measured and calculated architectural parameters for each muscle are also given in Table 1. Muscle mass decreased distally within the limb; biceps femoris was by far the heaviest muscle within the limb (485 ± 58 g), constituting 18% of the total muscle mass of the limb. Fascicle length also decreased distally within the pelvic limb as did the AI. Gastrocnemius (medial and lateral heads), flexor digitorum profundus (FDP) and flexor digitorum superficialis (FDS) had the smallest AIs and these were all very similar in value (between 0.07 and 0.14). The largest AIs were found in the proximal limb, in particular semitendinosus, semimembranosus, and sartorius (0.70 to 0.88).
Fig. 2.
(A) Superficial musculature of the greyhound pelvic limb. (B) Proximal musculature of the greyhound pelvic limb (M. biceps femoris removed). (C) Deep musculature of the proximal pelvic limb and distal limb musculature of the racing greyhound. Ms. biceps femoris, tensor fascia lata, sartorius, vastus lateralis, gluteus superficialis, gluteus medius and gluteus profundus have been removed.
Table 1.
Muscle data: muscle mass, volume, belly length, fascicle length, physiological cross-sectional area (PCSA), pennation angle, and estimated maximum isometric force and power. Values obtained for muscle force and power were obtained as per methods described in text. Values indicate mean and SD (n = 6)
| Muscle | Abbreviation | Muscle mass (g) | Belly length (cm) | Fascicle length (cm) | PCSA (cm2) | Pennation angle (o) | Fmax (N) | CorrectedFmax (N) | Power (W) | ||||
|---|---|---|---|---|---|---|---|---|---|---|---|---|---|
| Gluteus superficialis | GSP | 158 | (59.5) | 11.7 | (1.8) | 5.3 | (1.3) | 28.1 | 18 | (16) | 840 | 800 | 17 |
| Gluteus medius | GMD | 120 | (82) | 12.3 | (2.3) | 5.2 | (2.5) | 21.8 | 30 | (18) | 650 | 565 | 13 |
| Gluteus profundus | GPF | 35.2 | (18.2) | 8.4 | (2.7) | 4.4 | (1.8) | 7.5 | 0 | (0) | 230 | 230 | 3 |
| Biceps femoris | BF | 485 | (57.9) | 26.9 | (1.8) | 14.3 | (4.6) | 32 | 0 | (0) | 960 | 960 | 50 |
| Semimembranosus | SM | 170 | (63.7) | 23.2 | (2.4) | 20.4 | (2.7) | 7.9 | 0 | (0) | 240 | 240 | 18 |
| Semitendinosus | ST | 196 | (90.5) | 21.5 | (2) | 15.4 | (2.9) | 12 | 0 | (5) | 360 | 360 | 20 |
| Adductor (combined) | AD | 270 | (158) | 18.8 | (2.3) | 9.9 | (7.2) | 25.7 | 9 | (14) | 770 | 760 | 30 |
| Gracilis | GRC | 160 | (84.9) | 18.3 | (4.3) | 5.2 | (4.3) | 29 | 14 | (12) | 870 | 820 | 17 |
| Sartorius | SRT | 207 | (70) | 25 | (4.8) | 19 | (7.9) | 10.3 | 5 | (11) | 310 | 310 | 10 |
| Tensor fascia latae | TFL | 79.5 | (35.3) | 15.4 | (4.1) | 7.3 | (5.1) | 10.3 | 17 | (23) | 310 | 295 | 7 |
| Vastus lateralis | VL | 137 | (47.1) | 19.8 | (2.7) | 12.8 | (8.5) | 10.1 | 12 | (13) | 300 | 300 | 15 |
| Vastus medialis | VM | 101 | (30) | 18.5 | (2) | 3.7 | (0.2) | 25.8 | 25 | (9) | 770 | 700 | 10 |
| Vastus intermedius | VI | 71.6 | (32) | 18 | (2.5) | 8 | (7.2) | 8.4 | 14 | (13) | 250 | 250 | 8 |
| Rectus femoris | RF | 267 | (138.8) | 20.5 | (2.2) | 9.6 | (6.5) | 26.2 | 20 | (17) | 790 | 740 | 30 |
| Gastrocnemius lateralis | GL | 40.9 | (17.2) | 14.2 | (1.5) | 1.7 | (0.6) | 22.7 | 25 | (14) | 680 | 620 | 4 |
| Gastrocnemius medialis | GM | 45.1 | (12) | 14.9 | (2.2) | 2.1 | (0.5) | 20.3 | 36 | (19) | 610 | 490 | 5 |
| Tibialis cranialis | TCN | 25.2 | (10.9) | 13.4 | (4.4) | 6 | (4.7) | 4 | 20 | (15) | 120 | 110 | 11 |
| Extensor digitorum longus | EDL | 36.3 | (12.7) | 15 | (1.3) | 6.6 | (4.9) | 5.2 | 6 | (8) | 155 | 155 | 3 |
| Peroneus longus | PL | 21.7 | (8) | 11.5 | (3.6) | 2.2 | (1.3) | 9.3 | 20 | (8) | 280 | 260 | 2 |
| Flexor digitorum profundus | FDP | 31.2 | (8.3) | 13.8 | (3.1) | 1.4 | (0.4) | 21 | 35 | (17) | 630 | 520 | 3 |
| Flexor digitorum superficialis | FDS | 53.4 | (20) | 16.1 | (3.3) | 1.2 | (0.6) | 42 | 32 | (12) | 1260 | 1070 | 6 |
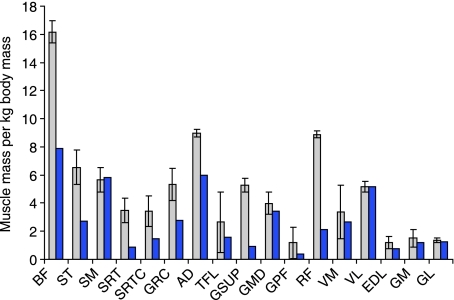
The muscle mass of each greyhound pelvic limb muscle was normalized to total body mass, and compared with published data (also normalized to body mass; Shahar & Milgram, 2001, for a mixed-breed dog; Fig. 3). Greyhound pelvic limb muscles were relatively larger in all but four muscles. Biceps femoris and semitendinosus (two major hip extensors) in a racing greyhound were in fact double the relative mass when compared to a ‘normal’ dog, as were many other muscles.
Fig. 3.
Muscle mass of individual pelvic limb muscles scaled to total body mass. Pale bars represent racing greyhound data from this study (mean ± SD), whilst dark bars show data from Shahar & Milgrim (2001) for a mixed-breed dog.
Tendons
All tendon data are provided in Table 2. Tendons of distal muscles were the longest (for example FDS and FDP; 27.8 ± 3.3 and 28.5 ± 4.5 cm, respectively), whereas proximal tendons tended to have larger cross-sectional areas (e.g. rectus femoris; 0.7 cm2).
Table 2.
Tendon data: mass, volume, and resting length, and estimated cross-sectional area (CSA), stress, strain, and length change of selected pelvic limb tendons. Estimated parameters calculated using methods described in the text. Data are means (n = 6). Values in brackets are standard deviations
| Muscle tendon unit | Mass (g) | Volume (cm3) | Rest length (cm) | CSA (cm2) | Stress (MPa) | Strain (%) | Length change (mm) | ||
|---|---|---|---|---|---|---|---|---|---|
| Semitendinosus | 1.0 | (0.8) | 1.8 | 7.5 | (1.5) | 0.2 | 15 | 1.0 | 0.8 |
| Gracilis | 2.5 | (0.7) | 2.2 | 5.4 | (0.9) | 0.4 | 21 | 1.4 | 0.8 |
| Sartorius | 1.0 | (0.5) | 0.9 | 3.2 | (1.0) | 0.3 | 5 | 0.4 | 0.1 |
| Tensor fascia latae | 6.5 | (2.2) | 5.8 | 16.5 | (2.8) | 0.4 | 7 | 0.5 | 0.8 |
| Rectus femoris | 8.5 | (4.9) | 6.9 | 10.4 | (3.5) | 0.7 | 12 | 0.8 | 0.8 |
| Vastus | 7.8 | (6.7) | 2.8 | 7.8 | (3.1) | 0.4 | 7 | 2.5 | 1.9 |
| Gastrocnemius | 18.4 | (2.5) | 5.5 | 15.4 | (5.0) | 0.4 | 37 | 2.5 | 3.8 |
| Peroneus longus | 2.8 | (1.2) | 1.7 | 19.4 | (3.0) | 0.1 | 26 | 1.7 | 3.4 |
| Tibialis cranialis | 1.2 | (1.0) | 1.9 | 15.7 | (3.6) | 0.1 | 40 | 2.7 | 4.2 |
| Extensor digitorum longus | 0.8 | (1.6) | 2.2 | 14.5 | (4.3) | 0.2 | 7 | 0.4 | 0.6 |
| Flexor digitorum profundus | 7.8 | (4.7) | 6.9 | 28.5 | (4.5) | 0.2 | 27 | 1.8 | 5.1 |
| Flexor digitorum superficialis | 9.2 | (5.4) | 8.2 | 27.8 | (3.3) | 0.3 | 43 | 2.8 | 7.9 |
Muscle moment arms
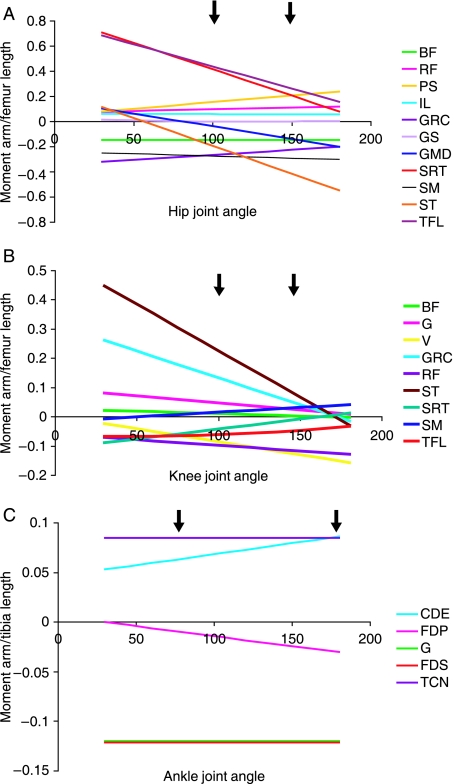
Moment arms were scaled by segment length as in previous studies (Williams et al. 2007a,b). Segment lengths for each subject can be found in Table 3 whilst moment arm curves are given in Fig. 4. These data are presented such that muscles acting to extend a joint have negative values, whereas flexors of a joint have positive values; however, only the absolute value is of concern here.
Table 3.
Pelvic limb segment lengths used to scale muscle moment arm measurements
| Dog Number | Sex (M/F) | Mass (kg) | Femur length (cm) | Tibia length (cm) |
|---|---|---|---|---|
| 1 | F | 27 | 19.0 | 23.0 |
| 2 | M | 34 | 20.0 | 27.0 |
| 3 | M | 33 | 20.5 | 27.0 |
| 4 | M | 28 | 20.0 | 26.0 |
Fig. 4.
Moment arm curves for individual pelvic limb muscles at (A) the hip, (B) the stifle and (C) the tarsus joints. Moment arms are scaled to limb segment lengths, as described in the text. Segment lengths can be found in Table 4.3. Positive values for moment arms indicate muscles that act to flex a joint, whereas negative values indicate joint extensors. Arrows indicate the functional range of joint motion during stance in galloping greyhounds (Williams, unpublished data).
Moment arms at the hip joint
The moment arm of BF at the hip (Fig. 4A,B) remained constant with changing joint angle. The moment arm of semimembranosus showed a small (linear) increase in moment arm as joint angle increased. Those of gluteus medius and semitendinosus were very small at maximum joint flexion, and increased linearly with increasing joint angle, both showing maximum moment arms at maximum joint extension. The moment arm of gracilis decreased linearly with increasing hip joint angle.
Moment arms at the stifle joint
Moment arms of semitendinosus, gracilis, gastrocnemius and biceps femoris all decreased linearly with increasing stifle extension. The mean maximum moment arm (Table 4) was greatest in semitendinosus (at maximum joint flexion), followed by gracilis – also at maximum stifle flexion. Biceps femoris had the smallest maximum moment arms at this joint. The moment arm of semimembranosus increased, however, with joint extension (linearly). Moment arms of the stifle flexors sartorius and tensor fascia lata decreased with joint extension, in contrast to those of the vastus group of muscles and rectus femoris, which increased along with stifle joint angle.
Table 4.
Mean maximum moment arms (range given in brackets), maximum joint moments (calculated as described in the text), and muscle fascicle length : moment arm ratios for greyhound pelvic limb muscles. Fascicle lengths for grouped muscles were calculated as weighted harmonic means (Alexander et al. 1981). Moment arms used for calculations are the mean of the maxima. n = 4
| Muscle–tendon unit | Joint of action | Joint angle of maximum moment arm (i.e. max flexion/extension) | Mean maximum muscle moment arm (cm) | Maximum joint moment of force (Nm) | Muscle fascicle length : moment arm ratio |
|---|---|---|---|---|---|
| Gluteus superficialis | Hip | Max. flexion | 0.3 | 0.2 | 17.7 |
| Gluteus medius | Hip | Max. extension | 4.0 | 2.7 | 1.3 |
| Gracilis | Hip | Max. flexion | 6.3 | 5.4 | 0.8 |
| Stifle | Max. flexion | 5.2 | 4.5 | 1.0 | |
| Sartorius | Hip | Max. flexion | 14.1 | 2.1 | 1.4 |
| Stifle | Max. flexion | 1.8 | 0.3 | 10.6 | |
| Tensor fascia latae | Hip | Max. flexion | 13.6 | 3.4 | 0.5 |
| Stifle | Max. flexion | 1.3 | 0.3 | 5.6 | |
| Biceps femoris | Hip | All | 2.9 | 2.8 | 4.9 |
| Stifle | Max. flexion | 0.4 | 0.4 | 34.1 | |
| Semimembranosus | Hip | Max. extension | 6.0 | 1.4 | 3.4 |
| Stifle | Max. extension | 0.8 | 0.2 | 24.3 | |
| Semitendinosus | Hip | Max. extension | 10.8 | 3.9 | 1.4 |
| Stifle | Max. flexion | 9.1 | 3.3 | 1.7 | |
| Rectus femoris | Hip | Max. extension | 2.4 | 1.9 | 3.9 |
| Stifle | Max. extension | 2.5 | 2.0 | 3.8 | |
| Vastus | Stifle | Max. extension | 3.1 | 4.1 | 2.6 |
| Gastrocnemius | Stifle | Max. flexion | 1.6 | 2.1 | 1.2 |
| Tarsus | All | 3.1 | 4.1 | 0.6 | |
| Tibialis cranialis | Tarsus | All | 2.2 | 1.0 | 2.8 |
| Extensor digitorum longus | Tarsus | Max. extension | 2.2 | 0.2 | 2.9 |
| Flexor digitorum profundus | Tarsus | Max. extension | 0.8 | 0.5 | 1.8 |
| Flexor digitorum superficialis | Tarsus | All | 3.1 | 3.9 | 0.4 |
Moment arms at the tarsus
The moment arms of gastrocnemius and FDS were large and constant throughout the tarsal joint range of motion. The moment arm of tibialis cranialis did not change with joint angle, and that of extensor digitorum communis became larger as the tarsus joint angle increased.
Discussion
Specialisations for high-speed sprinting: proximal muscles
The apparent augmentation of muscle volume in greyhounds may be an inherent genetically acquired characteristic, or due to the mechanism of skeletal muscle hypertrophy with training (Goldberg et al. 1975; Goldspink et al. 1995) – or a combination of both. However, this adaptation will clearly increase the potential for improved muscle power output (maximum muscle power is roughly proportional to muscle mass or volume). Similar results have been shown in a study between two extreme breeds of horse, with Quarter horses (sprinters) showing larger muscle volumes than Arabs (endurance) (Crook et al. 2008). The greyhound is of relatively leaner body form than ‘normal’ dogs, and so it is possible that differences in muscle mass relative to body mass can partly be attributed to this factor (although we cannot quantify to what extent). Some greyhound muscles appear to show larger amounts of hypertrophy than others, for example in the hamstrings, where both biceps femoris and semitendinosus appear specifically hypertrophied in the greyhound, whereas semimembranosus shows little difference in relative mass compared with the mixed-breed dogs. We suggest such differences highlight functional distinctions between muscles in this group (which are also highlighted by muscle moment arm data – see later). Perhaps semitendinosus and biceps femoris play a somewhat more important role in propulsion (hip/tarsus extension) than semimembranosus (which is more medially placed and so may have a more significant role in medial stabilization of the stifle or hip adduction). Without biomechanical analysis to compliment this data, however, we cannot be certain.
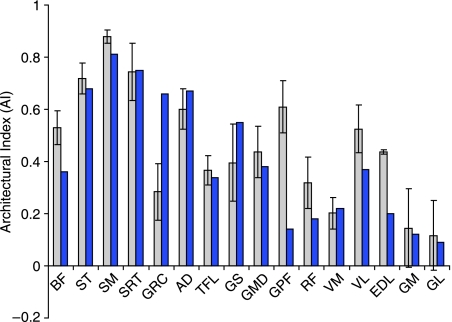
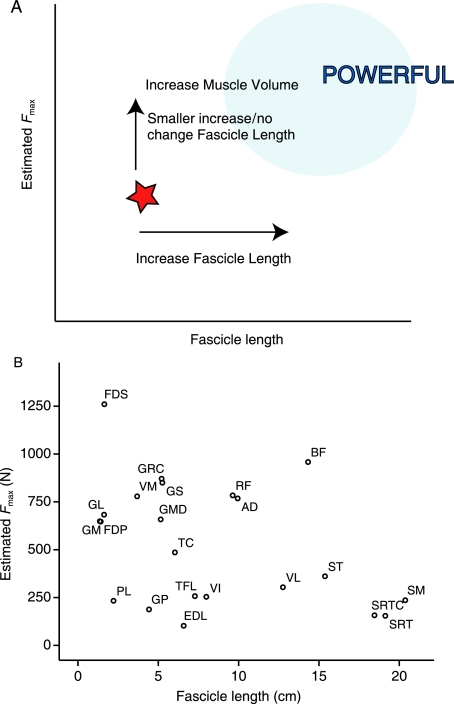
Architectural Index (Fig. 5) was not different between greyhounds and mixed breeds in many muscles. The exceptions were biceps femoris, gluteus profundus, extensor digitorum longus (EDL) and rectus femoris, all of which had higher AIs in the racing greyhounds, indicating relatively longer fascicles. With the exception of EDL, these muscles are all extensor muscles situated within the proximal pelvic limb. This trend towards longer fascicles here may be an adaptation again towards higher power output of these muscles, and mirrors the results from a study comparing fascicle lengths of extensor muscles in sprint and endurance human athletes (Abe et al. 2000). A marked increased muscle volume in the greyhound (see above), combined with a (lesser) increase in fascicle length will result in an increase in PCSA of the muscle. Hence the maximum amount of force the muscle can generate is increased (but only due to increased muscle volume). An increased fascicle length places the respective muscle further to the right, and into the ‘power producing’ region of the Fmax vs. fascicle length plot (Fig. 6A). A specialisation toward high power production would be beneficial for an elite sprinter as they require the capacity to perform increased amounts of muscle work to accelerate quickly and to maintain fast running speeds.
Fig. 5.
Architectural Index (calculated as described in the text) for individual pelvic limb muscles of greyhounds (pale bars) and a mixed-breed dog (dark bars; Shahar & Milgrim, 2001).
Fig. 6.
(A) Schematic representation of the effect of increased muscle volume and Architectural Index on muscle power output. The star represents the position of the hypothetical muscle on the plot. Arrows show how the position of the star is likely to move towards that of powerful muscles (pale blue region) with increased muscle volume and Architectural Index. (B) Fmax against fascicle length for individual racing greyhound pelvic limb muscles.
The previous study (Shahar & Milgram, 2001) used only one cadaver, and therefore variation in anatomical parameters between animals should be kept in mind when interpreting these results. Also in that study, fascicle lengths were taken via a different method (partial digestion) and it is not clear how this method compares with ours. Finally, when relating muscle architecture to power output of muscle, especially comparatively, the results must be considered carefully. Although muscle volume is roughly proportional to power output, fibre type compositions and contraction velocities differ between breeds, species and individual muscles within a limb (Snow & Guy, 1980; Guy & Snow, 1981). Thus, confounding factors exist which may complicate the picture presented here, and these should be taken into consideration when broadly comparing muscle function.
The greyhound has a large number of muscles that appear capable of generating substantial amounts of work (Fig. 6B). Net mechanical work (to increase the kinetic energy of the body, for example during acceleration or jumping) is likely to be achieved either by leg extension or via torque generation at the hip. The main contributors to potential power output of the limb are predominantly hip and leg extensor muscles supporting this concept. Biceps femoris and adductor – hip extensors – are the largest (and therefore most powerful). Rectus femoris (a stifle extensor/hip flexor) is also particularly powerful. It can also generate reasonable amounts of force, as it has relatively short fibres in relation to its muscle length. This architecture suggests that rectus femoris may have sufficient power and force generating capabilities to be a potential candidate for a muscle that is used in creating rapid hind limb protraction. Fast protraction of the hind limb may be as important as forelimb protraction to an animal locomoting at high speeds (Wilson et al. 2003).
Specialisations for high-speed sprinting: distal muscles
Unfortunately, it was not possible to perform a similar across-breed comparison for distal limb muscles, as no published data were available. However, it would be interesting to consider these muscles both in terms of potential differences in muscle architecture and the properties of their series-elastic elements between sprinting and generalist canids. Nevertheless, we can still consider the functional adaptations of the racing greyhound distal limb independently.
Gastrocnemius was seen to have high force generating potential in the greyhound [though it appears less impressive than in the hare (Williams et al. 2007a)]. This might be explained by the variation in limb postures between species (i.e. from an upright posture in large species to more crouched in smaller species). A crouched posture may increase torques at the tarsus, as the GRF seems to pass close to the knee in many animals, and therefore animals with such a posture might require increased reliance on the gastrocnemius muscle tendon unit (MTU). Conversely, as the GRF vector should always originate in the foot, the GRF moment at the metatarsophalangeal (MTP) joint will be determined predominantly by anatomy and whether the animal is unguligrade or digitigrade. An upright posture as seen for example in the horse may therefore predispose an animal to increased torques at the MTP joint and result in enhanced importance of the digital flexor musculature. Alternatively, the relative significance of the gastrocnemius (and FDS) muscles in generating force may be a distinction between animals that undergo mostly long distance steady-state economical locomotion (horse), and those more suited to unsteady activities and mechanical work production.
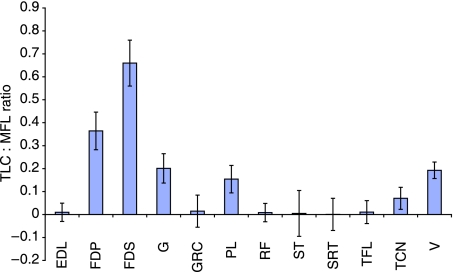
Tendon length change : muscle fascicle length (TLC : MFL) ratios were calculated for selected muscle–tendon units (Fig. 7). This ratio gives an indication of the relative active vs. passive contribution of the MTU during locomotor functions. For example, a high value indicates that an MTU has a high dependence on passive length change (tendon elongation), whereas a low value indicates a greater contribution of active length change (i.e. muscle shortening). Distal limb MTUs in the racing greyhound had the highest values for the TLC : MFL ratio (in particular the digital flexors), suggesting a greater amount of ‘compliance’ than their proximal counterparts. Traditionally, it has been suggested that MTUs with ratio values above 0.4 are those which function as ‘biological springs’, storing and releasing elastic energy during locomotion. The greyhound pelvic limb FDS exceeds all other pelvic limb muscles in terms of force generating capacity and has a TLC : MFL ratio of 0.66. It is likely therefore to act in a spring-like manner during locomotion, undergoing significant passive length change and energy storage.
Fig. 7.
Tendon length change: Muscle fascicle length (TLC : MFL) ratio for selected pelvic limb muscle tendon units. Tendon length change is based on that at Fmax.
The TLC : MFL ratio for FDP falls just below the 0.4 threshold (0.36; Fig. 7). Given that our values for tendon length change are based on several assumptions and estimations, there is substantial imprecision in this value and so it is probable that FDP stores some elastic energy. When compared to the same ratio in the horse (Payne et al. 2005), however, this value is certainly less than might be expected. Nonetheless, the hare FDP also has a relatively low value for this ratio [0.2 (Williams et al. 2007a)], and so it seems likely that FDP only properly functions as an elastic energy store in horses, and not in greyhounds and hares. This may be due to animal size effects, a greater reliance of the horse on energy-saving mechanisms for locomotion, or differing limb postures between species. Muscles with specialized architecture such as the FDP have been suggested to function as dampers, dissipating vibrations in the limb caused during locomotion (Wilson et al. 2001), and horses would have a greater need to damp these vibrations that occur at foot impact due to the rigid foot and preponderance of elastic tissues in the limb. Perhaps the absence of any ‘shock-absorbers’ on the feet in horses may be a factor in this – dogs have soft pads which damp much of the impact associated with foot contact. In addition, the relatively massive trunk which a horse must ‘carry’ (due to their large gut for processing vast amounts of energy-poor foods) adds considerably to body mass and thus increased in forces during locomotion.
The significance of moment arm measurements
Muscles create forces which cause the rotation of limb segments about joints. The rotational force (moment) about a joint is determined by a combination of the PCSA and maximum isometric stress of a muscle (i.e. Fmax), but also the moment arm of the muscle. This moment arm can vary with joint angle and hence posture [Fig. 4(Spoor et al. 1990; Payne et al. 2006a; Williams et al. 2007a,b)], and thus the ratio of muscle force and joint torque (and muscle velocity and joint velocity) can also vary. This means that a muscle may be able to function differently depending on the position of the joint/limb (and hence the stage of the stance phase/stride cycle).
Moment arms at the hip joint
There was no distinct trend for either increasing or decreasing moment arm with joint position for individual groups of hip muscles (i.e. flexors or extensors). Of the hip extensors, semitendinosus showed the greatest change throughout joint range of motion, and equally the greatest maximum moment arm of the hip extensors. This suggests semitendinosus has an important role in creating a large muscle torque at the hip joint, particularly when the hip is extended, such as during the propulsive phase of stance. Gluteus medius and semimembranosus exhibited a similar pattern to that observed in semitendinosus; however, maximum moment arms were less. The moment arm of biceps femoris did not change with joint angle. This may indicate a requirement for biceps femoris to produce high force throughout the stride cycle such that a constant moment arm is actually an adaptation towards increased versatility of the muscle. More likely, though, is that biceps femoris is an extremely large muscle and so finding the exact line of action is difficult within the constraints of the method used. Hence our results likely give a reasonable average moment arm for biceps femoris but may not truly represent the line of pull of this muscle across its entire belly. Biceps femoris is so large and arranged such that it is unlikely to act as a single functional unit – different regions of the muscle may perform distinct functions. The ratio of muscle fascicle length : moment arm length (MFL : MA) indicates the ability of a muscle to move a joint through large ranges (Thorpe et al. 1999; Payne et al. 2006a). This ratio was higher for biceps femoris at the hip than for any other major hip extensor muscle, save for gluteus superficialis, suggesting biceps femoris acts over a wide range of hip joint angles.
Moment arms at the stifle joint
All the stifle flexors, with the exception of semimembranosus, showed a decrease in moment arm with stifle extension, and maximum moment arms at full joint flexion. This suggests that whilst semimembranosus could create its greatest torque when stifle flexion is initiated (and thus may be important in this initial movement); the remaining stifle flexors create larger moments when the stifle is already flexed to maintain this posture.
The moment arms of both the vastus group of muscles and rectus femoris followed similar trends, being greatest at maximum joint extension. This appears to be a similar adaptation to that present in many of the hip extensor muscles, with the muscles being able to create their greatest torque during late stance, when the need for propulsion is greatest and the limb is at its most extended. This trend was opposed in both tensor fascia latae and sartorius, with the moment arms of these muscles decreasing with stifle joint extension. They may therefore be involved in initiation of stifle extension.
Moment arms at the tarsus joint
Neither the moment arm of gastrocnemius or FDS changed with tarsus joint angle. Both also had very similar moment arm lengths, unsurprising given their similar position within the limb. Nevertheless, the gastrocnemius muscle is able to create a maximum extensor moment of over 5 Nm at the tarsus joint (Table 4), greater than that of any other muscle, at any other joint. Both muscles have exceedingly small MFL : MA ratios, indicating that they do not move the tarsus joint through large ranges. This appears something of a paradox, given that one might expect that if a muscle were to function over a limited range of limb postures (as suggested by the MFL : MA ratio of both muscles), then the muscle moment arm would be greatest in this limited range, to create the greatest moment of force. The series elastic component of the muscles may confuse the issue here. Perhaps tendon elongation as opposed to muscle length change is enough to permit a larger range of motion at the tarsus, and so function over a wide range of postures is possible, which is why there appears to be no optimized MA length for a specific joint angle. It may be essential for a muscle to be able to function over a large range of tarsus joint angles. Changes in limb posture can influence the EMA of the limb (Biewener, 1990, 1991), which may change the mass-specific muscle force required during different locomotor tasks. Were such a strategy, to alter EMA for different activities, employed in an animal (for example to enable lesser musculo-skeletal specialisation towards a specific locomotor function), it might be advantageous to be able to create high torques across a wide range of joint positions. This concept of ‘dynamic gearing’ has been discussed in detail in previous work (Williams et al. 2007a), and may be particularly relevant for an elite sprinter such as the racing greyhound, to enable effective high-speed steady-state running and rapid acceleration. In addition, gastrocnemius is biarticular and this may have further implications for its function; for example, it may play a role in power transfer between limb segments. However, this is beyond the scope of this study.
Joint moments
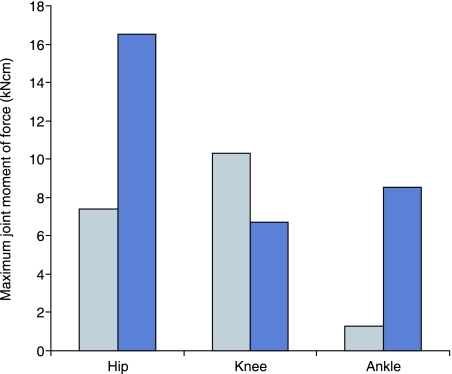
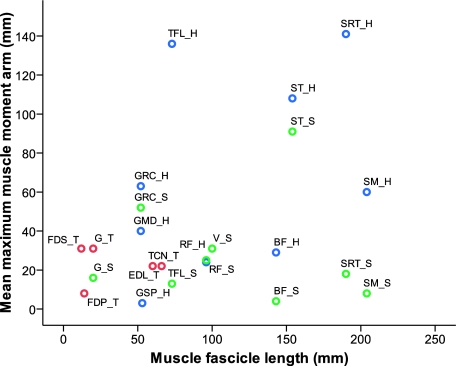
The total maximum torque that the combined pelvic limb musculature can produce at each joint (taken as the sum of each individual maximum muscle moment of force) is shown in Fig. 8. At both hip and tarsus joints the potential extensor moment is higher than the potential flexor moment. This is not the case at the stifle joint, which may reflect the presence of a large number of biarticular hip and tarsus extensor muscles that cross the flexor aspect of this joint. The highest moment generating capacity is in the hip extensor musculature, reflecting the commonly held view that quadrupeds power locomotion by a torque about the hip joint, created by the hip extensor musculature (Usherwood & Wilson, 2005). The ratio of muscle moment arm to muscle fascicle length (Fig. 9) gives us information regarding the roles of muscles in movement, and also corroborates this view. It distinguishes which muscles operate over a wide range of motion (bottom right) and which ones are more suited to ‘holding’ or maintaining posture (top left). Those which are capable of generating high torque over a wide range of postures are on the top right and include, amongst others, the hip extensors semitendinosus and semimembranosus. This highlights the ability of these muscles to produce high hip torques at many possible limb postures in this elite sprinter.
Fig. 8.
Total maximum isometric joint torque for flexor (pale) and extensor (dark) muscle groups at each joint within the racing greyhound pelvic limb.
Fig. 9.
Muscle moment arm length versus muscle fascicle length. This ratio gives information regarding the individual roles of muscles during movement. Abbreviations are given in Table 1. Blue symbols show muscles crossing the hip joint, green crossing the stifle, and red crossing the tarsus.
Conclusions
In conclusion, we have detailed the muscle–tendon architecture of the racing greyhound pelvic limb. We have compared our findings to those found in other fast quadrupedal runners, and have discussed the implications of the functional adaptations of the greyhound pelvic limb for sprinting performance. In addition, we compared results found here with those previously published in a mixed-breed dog, to illustrate specialisations for sprinting. We conclude the following:
Compared to ‘normal’ dogs, the racing greyhound benefits from extreme specialisation for propulsion. The hip extensors and rectus femoris in particular are capable of producing large amounts of power, and the hip extensors of generating high torques over a wide range of postures.
Some distal muscles appear specialised for elastic energy storage (FDS, gastrocnemius); however, FDP appears not to act as an elastic energy store in the greyhound pelvic limb.
The mechanism of elastic energy storage and release in compliant MTUs implies the greyhound maintains the ability to locomote efficiently at high speeds, whilst the architecture of proximal musculature and capacity to produce substantial extensor moments about the tarsus and hip allows high power output and hence rapid acceleration. The greyhound hence appears to possess substantial specialisations for sprint performance and appears to be outstandingly anatomically suited to its role as an elite sprint athlete.
Acknowledgments
We would like to express our thanks to Professors Peter Aerts and Steven Harridge for their comments on early versions of this work. We would also like to thank the BBSRC for funding. S.B.W. was funded by a Royal Veterinary College studentship. A.M.W. is holder of a BBSRC research development fellowship and a Royal Society Wolfson Research Merit Award.
References
- Aagaard P, Andersen JL, Dyhre-Poulsen P, et al. A mechanism for increased contractile strength of human pennate muscle in response to strength training: changes in muscle architecture. J Physiol. 2001;534:613–623. doi: 10.1111/j.1469-7793.2001.t01-1-00613.x. [DOI] [PMC free article] [PubMed] [Google Scholar]
- Abe T, Kumagai K, Brechue WF. Fascicle length of leg muscles is greater in sprinters than distance runners. Med Sci Sports Exerc. 2000;32:1125–1129. doi: 10.1097/00005768-200006000-00014. [DOI] [PubMed] [Google Scholar]
- Alexander RM, Jayes AS, Maloiy GM, Wathuta E. Allometry of the leg muscles of mammals. J Zool Lond Series A. 1981;194:227–267. [Google Scholar]
- Ameredes BT, Brechue WF, Andrew GM, Stainsby WN. Force-velocity shifts with repetitive isometric and isotonic contractions of canine gastrocnemius in situ. J Appl Physiol. 1992;73:2105–2111. doi: 10.1152/jappl.1992.73.5.2105. [DOI] [PubMed] [Google Scholar]
- Azizi E, Brainerd E, Roberts T. Variable gearing in pennate muscles. PNAS. 2008;105(5):1745–1750. doi: 10.1073/pnas.0709212105. [DOI] [PMC free article] [PubMed] [Google Scholar]
- Bennett MB, Ker RF, Dimery NJ, Alexander RM. Mechanical properties of various mammalian tendons. J Zool Lond. 1986;209:537–548. [Google Scholar]
- Biewener AA. Allometry of quadrupedal locomotion: the scaling of duty factor, bone curvature and limb orientation to body size. J Exp Biol. 1983;105:147–171. doi: 10.1242/jeb.105.1.147. [DOI] [PubMed] [Google Scholar]
- Biewener AA. Biomechanics of mammalian terrestrial locomotion. Science. 1990;250:1097–103. doi: 10.1126/science.2251499. [DOI] [PubMed] [Google Scholar]
- Biewener AA. Musculoskeletal design in relation to body size. J Biomech. 1991;24(Suppl. 1):19–29. doi: 10.1016/0021-9290(91)90374-v. [DOI] [PubMed] [Google Scholar]
- Blazevich AJ, Gill ND, Bronks R, Newton RU. Training-specific muscle architecture adaptation after 5-week training in athletes. Med Sci Sports Exerc. 2003;35:2013–2022. doi: 10.1249/01.MSS.0000099092.83611.20. [DOI] [PubMed] [Google Scholar]
- Crook TC, Cruickshank SE, McGowan CM, et al. Comparative anatomy and muscle architecture of selected hind limb muscles in the Quarter Horse and Arab. J Anat. 2008;212(2):144–152. doi: 10.1111/j.1469-7580.2007.00848.x. [DOI] [PMC free article] [PubMed] [Google Scholar]
- Goldberg AL, Etlinger JD, Goldspink DF, Jablecki C. Mechanism of work-induced hypertrophy of skeletal muscle. Med Sci Sports. 1975;7:185–198. [PubMed] [Google Scholar]
- Goldspink DF, Cox VM, Smith SK, et al. Muscle growth in response to mechanical stimuli. Am J Physiol. 1995;268:E288–E297. doi: 10.1152/ajpendo.1995.268.2.E288. [DOI] [PubMed] [Google Scholar]
- Guy PS, Snow DH. Skeletal muscle fibre composition in the dog and its relationship to athletic ability. Res Vet Sci. 1981;31(2):244–248. [PubMed] [Google Scholar]
- Haxton H. Muscles of the pelvic limb. A study of the differences between bipeds and quadrupeds. Anat Rec. 1947;98:337–346. doi: 10.1002/ar.1090980304. [DOI] [PubMed] [Google Scholar]
- Herbert RT, Gandevia SC. Changes in pennation with joint angle and muscle torque: in vivo measurements in human brachialis muscle. J Physiol. 1995;484:523–532. doi: 10.1113/jphysiol.1995.sp020683. [DOI] [PMC free article] [PubMed] [Google Scholar]
- Hill A. The heat of shortening and the dynamic constants of muscle. Proc R Soc Lond B Biol Sci. 1938;126:136. [Google Scholar]
- Hughes R, Nieber G, Liu J, An K. Comparison of two methods for computing abduction moment arms of the rotator cuff. J Biomech. 1998;31:157–160. doi: 10.1016/s0021-9290(97)00113-9. [DOI] [PubMed] [Google Scholar]
- Jayes AS, Alexander RM. Estimates of mechanical stresses in leg muscles of galloping Greyhounds (Canis familiaris. J Zool (Lond) 1982;198:315–328. [Google Scholar]
- Kawakami Y, Abe T, Kuno SY, Fukunaga T. Training-induced changes in muscle architecture and specific tension. Eur J Appl Physiol Occup Physiol. 1995;72:37–43. doi: 10.1007/BF00964112. [DOI] [PubMed] [Google Scholar]
- Ker R, Alexander R, Bennet M. Why are mammalian tendons so thick? J Zool (Lond) 1988;216:309–324. [Google Scholar]
- Lieber RL. Skeletal muscle architecture: implications for muscle function and surgical tendon transfer. J Hand Ther. 1993;6:105–113. [PubMed] [Google Scholar]
- Lieber RL, Blevins FT. Skeletal muscle architecture of the rabbit hindlimb: functional implications of muscle design. J Morphol. 1989;199:93–101. doi: 10.1002/jmor.1051990108. [DOI] [PubMed] [Google Scholar]
- Lieber RL, Friden J. Functional and clinical significance of skeletal muscle architecture. Muscle Nerve. 2000;23:1647–1666. doi: 10.1002/1097-4598(200011)23:11<1647::aid-mus1>3.0.co;2-m. [DOI] [PubMed] [Google Scholar]
- Medler S. Comparative trends in shortening velocity and force production in skeletal muscles. Am J Physiol Regul Integr Comp Physiol. 2002;283:R368–R378. doi: 10.1152/ajpregu.00689.2001. [DOI] [PubMed] [Google Scholar]
- Mendez J, Keys A. Density and composition of mammalian muscle. Metabolism. 1960;9:184–188. [Google Scholar]
- Pasi BM, Carrier DR. Functional trade-offs in the limb muscles of dogs selected for running vs. fighting. J Evol Biol. 2003;16:324–332. doi: 10.1046/j.1420-9101.2003.00512.x. [DOI] [PubMed] [Google Scholar]
- Payne RC, Hutchinson JR, Robilliard JJ, Smith NC, Wilson AM. Functional specialisation of pelvic limb anatomy in horses (Equus caballus) J Anat. 2005;206:557–574. doi: 10.1111/j.1469-7580.2005.00420.x. [DOI] [PMC free article] [PubMed] [Google Scholar]
- Payne RC, Crompton RH, Isler K, et al. Morphological analysis of the hindlimb in apes and humans. II. Moment arms. J Anat. 2006a;208:725–742. doi: 10.1111/j.1469-7580.2006.00564.x. [DOI] [PMC free article] [PubMed] [Google Scholar]
- Payne RC, Crompton RH, Isler K, et al. Morphological analysis of the hindlimb in apes and humans. I. Muscle architecture. J Anat. 2006b;208:709–724. doi: 10.1111/j.1469-7580.2006.00563.x. [DOI] [PMC free article] [PubMed] [Google Scholar]
- Shahar R, Milgram J. Morphometric and anatomic study of the hind limb of a dog. Am J Vet Res. 2001;62:928–933. doi: 10.2460/ajvr.2001.62.928. [DOI] [PubMed] [Google Scholar]
- Snow DH, Guy PS. Muscle fibre type composition of a number of limb muscles in different types of horse. Res Vet Sci. 1980;28(2):137–144. [PubMed] [Google Scholar]
- Spoor CW, van Leeuwen JL. Stifle muscle moment arms from MRI and from tendon travel. J Biomech. 1992;25:201–206. doi: 10.1016/0021-9290(92)90276-7. [DOI] [PubMed] [Google Scholar]
- Spoor CW, van Leeuwen JL, Meskers CG, Titulaer AF, Huson A. Estimation of instantaneous moment arms of lower-leg muscles. J Biomech. 1990;23:1247–1259. doi: 10.1016/0021-9290(90)90382-d. [DOI] [PubMed] [Google Scholar]
- Thorpe SK, Crompton RH, Gunther MM, Ker RF, McNeill Alexander R. Dimensions and moment arms of the hind- and forelimb muscles of common chimpanzees (Pan troglodytes) Am J Phys Anthropol. 1999;110:179–199. doi: 10.1002/(SICI)1096-8644(199910)110:2<179::AID-AJPA5>3.0.CO;2-Z. [DOI] [PubMed] [Google Scholar]
- Usherwood JR, Wilson AM. Biomechanics: no force limit on greyhound sprint speed. Nature. 2005;438:753–754. doi: 10.1038/438753a. [DOI] [PubMed] [Google Scholar]
- Wells JB. Comparison of mechanical properties between slow and fast mammalian muscles. J Physiol. 1965;178:252–269. doi: 10.1113/jphysiol.1965.sp007626. [DOI] [PMC free article] [PubMed] [Google Scholar]
- Williams SB, Payne R, Wilson A. Functional specialisation of the pelvic limb of the hare (Lepus europeus) J Anat. 2007a;210:472–490. doi: 10.1111/j.1469-7580.2007.00704.x. [DOI] [PMC free article] [PubMed] [Google Scholar]
- Williams SB, Payne RC, Wilson AM. Functional specialisation of the thoracic limb of the hare (Lepus europeus) J Anat. 2007b;210:491–505. doi: 10.1111/j.1469-7580.2007.00703.x. [DOI] [PMC free article] [PubMed] [Google Scholar]
- Wilson AM, McGuigan MP, Su A, van Den Bogert AJ. Horses damp the spring in their step. Nature. 2001;414:895–899. doi: 10.1038/414895a. [DOI] [PubMed] [Google Scholar]
- Wilson AM, Watson JC, Lichtwark GA. A catapult action for rapid limb protraction. Nature. 2003;421:35–36. doi: 10.1038/421035a. [DOI] [PubMed] [Google Scholar]
- Zajac FE. Muscle and tendon: properties, models, scaling, and application to biomechanics and motor control. Crit Rev Biomed Eng. 1989;17:359–411. [PubMed] [Google Scholar]
- Zajac FE. How musculotendon architecture and joint geometry affect the capacity of muscles to move and exert force on objects: a review with application to arm and forearm tendon transfer design. J Hand Surg [Am] 1992;17:799–804. doi: 10.1016/0363-5023(92)90445-u. [DOI] [PubMed] [Google Scholar]


