

Abstract
In wheat (Triticum aestivum L.), the crossover (CO) frequency increases gradually from the centromeres to the telomeres. However, little is known about the factors affecting both the distribution and the intensity of recombination along this gradient. To investigate this, we studied in detail the pattern of CO along chromosome 3B of bread wheat. A dense reference genetic map comprising 102 markers homogeneously distributed along the chromosome was compared to a physical deletion map. Most of the COs (90%) occurred in the distal subtelomeric regions that represent 40% of the chromosome. About 27% of the proximal regions surrounding the centromere showed a very weak CO frequency with only three COs found in the 752 gametes studied. Moreover, we observed a clear decrease of CO frequency on the distal region of the short arm. Finally, the intensity of interference was assessed for the first time in wheat using a Gamma model. The results showed m values of 1.2 for male recombination and 3.5 for female recombination, suggesting positive interference along wheat chromosome 3B.
IN most eukaryotes, meiotic recombination plays a key role in ensuring correct segregation of the chromosomes during gamete formation and for generating diversity in the progeny. Comparative analyses between a wide range of species including human, mouse, yeast, and Arabidopsis suggested a conserved process for recombination starting with the formation of a double-strand break (DSB) and proceeding through either crossover (CO) or non-CO pathways (for review see Anderson and Stack 2002; Hamant et al. 2006; Baudat and De Massy 2007; Cromie and Smith 2007). At least one CO per bivalent is required because the obligate chiasma constraint ensures a good segregation of chromosomes at meiosis. Additional COs are subjected to interference that inhibits the formation of a CO in the vicinity of another one (Jones and Franklin 2006). The number of COs on a chromosome is thus highly controlled, presumably because of the deleterious effect of having too many or too few COs (Jones and Franklin 2006). Their distribution can be analyzed by comparing physical and genetic maps or by studying linkage disequilibrium patterns. Studies performed in human, mouse, Arabidopsis, and rice (Wu et al. 2003; Drouaud et al. 2006; Arnheim et al. 2007) provided insight into some of the major features of recombination distribution with the identification of hot and cold regions of recombination along the chromosomes as well as a general suppression of COs in centromeric and pericentromeric regions (for a review see Jones 1987). In some plants with large genomes such as maize [2.5 Gigabase (Gb)], barley (5 Gb), and wheat (17 Gb), recombination was shown to follow particular patterns with a gradual increase from the centromeres to the telomeres (Lukaszewski and Curtis 1993; Kunzel et al. 2000; Tenaillon et al. 2001; Anderson et al. 2003).
To date, no consistent relationship has been established between recombination rate and sequence composition, i.e., gene or repetitive DNA content. This question was addressed in humans (Kong et al. 2002), where recombination rates were found to be significantly correlated with both cytogenetic structures (staining intensity of G bands) and sequence composition [GC content, CpG motifs, and poly(A)/poly(T) stretches]. In rice, hotspots are generally associated with high gene density (Wu et al. 2003) while in maize, Anderson et al. (2006) have shown that recombination is localized to the distal part of the chromosomes and is correlated strongly with the distribution of expressed sequenced tags (ESTs). Further, a recombination hotspot has been identified in a highly gene-rich region at the maize bz locus and characterized at a fine scale (Fu et al. 2001). In contrast, in Arabidopsis (Drouaud et al. 2006) fine-scale analysis failed to establish a correlation between recombination and gene density.
Previous studies in wheat indicated that recombination occurs mainly in the telomeric regions of the chromosomes with a gradient from the centromeres to the telomeres (Lukaszewski and Curtis 1993; Erayman et al. 2004; Sidhu and Gill 2004; See et al. 2006). The recombination gradient was proposed to be correlated with gene content. For example, Erayman et al. (2004) suggested that 95% of the recombination occurs in 48 gene-rich regions covering 29% of the physical size of the wheat genome. A striking example was observed for a gene-rich region encompassing only 4% of the long arm of chromosome 5B yet explaining at least 30% of the recombination of the entire chromosome (Faris et al. 2000). In addition, high recombination rates were found to be related to the decrease of synteny either between homeologous chromosomes (Akhunov et al. 2003a) or between wheat and rice orthologous chromosomes (Akhunov et al. 2003b). Chromosomal rearrangements such as deletions and duplications were also found to be more frequently located in highly recombinant regions (Dvorak et al. 2004; Dvorak and Akhunov 2005). To date, very little is known about the factors underlying the gradient of recombination along the wheat chromosomes as most of the studies were performed at low resolution with a limited number of markers and in the absence of physical maps (fingerprinted BAC libraries organized into genetically anchored contigs) and of a genome sequence for wheat.
In this work, we have used the largest hexaploid wheat chromosome (3B, 995 Mb) as a model to perform detailed recombination studies and identify factors that govern recombination in wheat. By comparing genetic and physical deletion maps, we established a fine-scale profile of CO distribution along the chromosome and confirmed that recombination is restricted mainly to distal regions with a decrease in the very telomeric regions. Comparison of male and female CO rates indicated an effect of both male and female meiosis on local CO variations. Finally, using the Gamma model, we provide the first evidence and characterization of positive interference on a wheat chromosome and discuss the implications of these finding for genetic mapping in wheat.
MATERIALS AND METHODS
Plant material and molecular analyses:
Genetic mapping populations:
The wheat cultivars Chinese Spring (Cs) and Renan (Re) were crossed and grains of the F1 individuals were dissected 20 days after pollination. Each embryo was cultivated on a rich medium (Muller) and grown in a growth chamber until the first two leaves emerged. Plants were then potted and grown for 2 weeks in cool conditions (17° day and 12° night, 12 hr of day) and then for 2 months at 24° day and 18° night with 16 hr of day. F1 plants were subsequently selfed and 376 seeds were sown to obtain the CsRe F2 population. This population was then used to study CO distribution along chromosome 3B.
Interference and sex-specific recombination were studied using two different doubled-haploid (DH) populations originating from the cross between Cs and Courtot (Ct). The androgenetic (CsCt-A) population is described in Felix et al. (1996) and a subset of 182 lines was used in the present study. For the gynogenetic population (CsCt-G), Chinese Spring and Courtot were crossed and F1 individuals were grown in a greenhouse. The spikes were emasculated and pollinated 1–3 days after with maize pollen (Laurie and Bennett 1988). Haploid seeds were then dissected and embryos were rescued and grown on rich medium until doubling with colchicine treatment. A set of 185 DH lines was used for the study.
Aneuploïd lines:
To assign markers to chromosome 3B, we used the nullisomic-tetrasomic line N3BT3A, two ditelocentric lines (Dt3BL and Dt3BS), and 14 chromosome 3B deletion lines described earlier (Sears 1954, 1966; Sears and Sears 1978; Endo and Gill 1996). Each deletion line is defined by the fraction length of the arm that remains present on the deleted chromosome (for example, line 3BS4-0.55 conserves the proximal 55% and lacks the distal 45% of the short arm of chromosome 3B). These deletion lines define 16 deletion bins: 3BL7-0.63-1.00, 3BL10-0.50-0.63, 3BL9-0.38-0.50, 3BL1-0.31-0.38, 3BL8-0.28-0.31, 3BL2-0.22-0.28, C-3BL2-0.022, C-3BS5-0.07, 3BS5-0.07-0.33, 3BS1-0.33-0.55, 3BS4-0.55-0.56, 3BS2-0.56-0.57, 3BS9-0.57-0.75, 3BS7-0.75-0.78, 3BS8-0.78-0.87, and 3BS3-0.87-1.00. Each deletion bin is defined by the fraction lengths of two successive deletion lines (for example, the deletion bin 3BS4-0.55-0.56 is the chromosome fragment covering the region between 55 and 56% of the short arm of chromosome 3B and delimited by deletion lines 3BS4-0.55 and 3BS2-0.56). The estimated sizes of the bins (in megabases) are indicated in Figure 1.
Figure 1.—

Distribution of COs along chromosome 3B. (A) Genetic map of chromosome 3B. Markers are indicated with the same color code as for the deletion bins. (B) Deletion map of chromosome 3B. The deletion bins used to assign markers are represented with the number of markers in each bin (left of the chromosome) and the size of the bin in megabases (right). (C) Schematic representation of the CO frequency along chromosome 3B. CO frequency calculated in centimorgans per megabase is represented by a colored bar for each bin. The two gray bars indicate bins with no markers that were grouped together. The plotted lines represent the average CO frequency for the chromosome.
DNA extraction:
DNA was extracted using a sodium metabisulfite protocol. Briefly, 100 mg of fresh tissue were ground in fine powder in liquid nitrogen. Then 600 μl of extraction buffer (0.1 m Tris, 0.05 m EDTA, 0.5 m NaCl, 0.02 m sodium metabisulfite, 0.2 m RNAse) were added, mixed, and incubated for 45 min at 95°. After centrifugation, 430 μl of the supernatant were collected and added to 425 μl of isopropanol/ammonium acetate 7.5 m (16/1 vol/vol). After centrifugation DNA pellets were washed in 70% ethanol and resuspended in 100 μl of Tris 1 mm-EDTA 0.1 mm buffer.
Markers and PCR conditions:
A total of 102 molecular markers (76 SSRs and 26 insertion site-based polymorphisms, ISBPs) for the CsRe population and 32 SSR markers for the two CsCt populations were selected for linkage analysis on the basis of their distribution in the different deletion bins (Table 1).
TABLE 1.
Detailed analysis of the comparison between the chromosome 3B cytogenetic map and the F2 CsRe genetic map
| Deletion bins | 3BS3-0.87– 1.00 | 3BS8-0.78– 0.87 | 3BS7-0.75–0.78 | 3BS9- 0.57–0.75 | 3BS2- 0.56–0.57 | 3BS4- 0.55–0.56 | 3BS1- 0.33–0.55 | 3BS5- 0.07–0.33 | C- 3BS5–0.07 | C- 3BL2–0.022 | 3BL2- 0.22–0.28 | 3BL8-0.28–0.31 | 3BL1-0.31–0.38 | 3BL9- 0.38–0.50 | 3BL10 -0.50–0.63 | 3BL7- 0.63–1.00 | Chra |
|---|---|---|---|---|---|---|---|---|---|---|---|---|---|---|---|---|---|
| Marker no. | 5 | 27 | 4 | 9 | 0 | 2 | 5 | 3 | 4 | 5 | 0 | 0 | 4 | 2 | 4 | 28 | 102 |
| Size of the bin (Mb) | 56 | 39 | 13 | 78 | 4 | 4 | 95 | 108 | 34 | 124 | 33 | 17 | 39 | 67 | 73 | 208 | 992 |
| % of physical size per arm | 12.93 | 9.01 | 3.00 | 18.01 | 0.92 | 0.92 | 21.94 | 24.94 | 7.85 | 22.06 | 5.87 | 3.02 | 6.94 | 11.92 | 12.99 | 37.01 | |
| % of physical size per chromosome | 5.65 | 3.93 | 1.31 | 7.86 | 0.40 | 0.40 | 9.58 | 10.89 | 3.43 | 12.50 | 3.33 | 1.71 | 3.93 | 6.75 | 7.36 | 20.97 | |
| Recombination values on the F2 CsRe map (cM) | 5.20 | 33.05 | 4.85 | 13.35 | — | 0.65 | 1.55 | 0.85 | 0.00 | 1.55 | 1.55 | 1.55 | 6.20 | 4.15 | 3.45 | 104.15 | 179 |
| % of recombination per arm | 8.74 | 55.55 | 8.15 | 22.44 | — | 1.09 | 2.61 | 1.43 | 0.00 | 1.30 | 1.30 | 1.30 | 5.19 | 3.47 | 2.89 | 87.15 | |
| % of recombination per chromosome | 2.91 | 18.46 | 2.71 | 7.46 | — | 0.36 | 0.87 | 0.47 | 0.00 | 0.87 | 0.87 | 0.87 | 3.46 | 2.32 | 1.93 | 58.18 | |
| Marker/Mb/bin | 11.30 | 1.44 | 3.25 | 8.67 | — | 2.00 | 19.00 | 36.00 | 8.50 | 34.80 | 34.80 | 34.80 | 9.75 | 33.50 | 18.25 | 7.43 | 9.73 |
| Crossover frequency (cM/Mb) | 0.09 | 0.85 | 0.37 | 0.17 | — | 0.08 | 0.02 | 0.01 | 0.00 | 0.01 | 0.01 | 0.01 | 0.16 | 0.06 | 0.05 | 0.50 | 0.18 |
Chr, whole chromosome.
Ninety SSRs originating from different sources were amplified using either the M13 protocol (Nicot et al. 2004) or the cresol red protocol (Hodges et al. 1997). The 26 ISBP (Paux et al. 2006) markers were amplified using either the SYBR GREEN protocol or the cresol red protocol (supplemental Table S1).
For the M13 protocol, PCR reactions were carried out in 6.5 μl of 0.2 units Taq, 50 nm forward-M13-tailed primer, 500 nm reverse primer, 3.4 pmol labeled M13 primer, and 5.4 nmol dNTP. Amplification was done following a touchdown procedure (Paux et al. 2006). Amplification products were visualized using an ABI PRISM 3100 Genetic Analyzer (Applied Biosystems, Foster City, CA).
For the SYBR GREEN protocol, PCR reactions were carried out in 10 μl of 0.25 units Taq, 0.5 μm for each primer, 1× SYBR Green, 0.4 mm for each dNTP, and 1 m betaine. Amplification was done with the same touchdown program as for condition 1 (Paux et al. 2006). Visualization of PCR products was done using a quantitative PCR machine (ABI7900HT, Applied Biosystems) by analyzing dissociation curves with SDS 2.2.1 software.
For the Cresol red protocol, PCR reactions were carried out in 10 μl of 0.25 units of Taq, 0.5 μm of each primer, 0.4 mm of each dNTP, and 1 μm cresol red. Amplification was done using a classical PCR protocol (94° for 5 min; 30 cycles of 94° for 30 sec, 60° for 30 sec, and 72° for 30 sec; and a final step of 72° for 5 min). PCR products were directly visualized on a 4% agarose gel stained with Ethidium Bromide.
Statistical analyses:
Algorithmic procedures for statistical analyses are presented in supplemental material 1.
Linkage analysis:
Genetic maps were constructed with the Mapmaker software (Lander et al. 1987). Linkage groups were obtained using default parameters. The “order” command was used to order the loci and the “map” function was further used to generate the genetic map, using the Kosambi (1944) mapping function. When markers were not placed on the map at LOD < 2, the function “compare” was used and the best order was retained. The “error detection” and “genotypes” commands permitted us to identify potential genotyping errors. The individuals concerned were scored again to check and eliminate these potential genotyping errors.
Comparison of CO frequency:
The significance of the differences interval-by-interval between male and female genetic maps was tested using a P-value approach. We determined the probability of having recombination rate differences at least as large as the values we found in our data sets under the hypothesis H0 that the recombination rate is sex independent (supplemental material 1). For multiple testing, we used Bonferroni correction (Hochberg 1988).
Test of the no-interference hypothesis:
The no-interference hypothesis  was tested via the statistics of distances between recombination events. In this procedure, the (theoretically derived) histogram of these distances was established and tested to determine whether it is compatible with the experimental histogram, from which it is possible to derive a P-value (supplemental material 1).
Coefficient of coincidence:
Interference strength was estimated using the coefficient of coincidence C4 that is the frequency of observed double COs divided by their theoretical frequency in the absence of interference. For this measure, we consider two nonoverlapping intervals associated with locus pairs (A, B) and (C, D). If rAB and rCD are the recombination rates for intervals (A, B) and (C, D), the coefficient of coincidence is
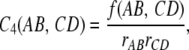 |
where f(AB, CD) is the frequency of double COs. By construction and in absence of interference, C4 = 1 while interference effects are strong when C4 is close to 0. To display the putative distance dependence of C4, we defined the distance d4, as the distance between the two midpoints of the intervals. Since small intervals may result in large statistical errors in the estimations of rAB or rCD, leading to erroneous C4 values, we did not consider intervals for which r < 0.05. From the list of C4 values, we performed a binning on d4 and computed the mean C4 in each of the 30 bins. The error bars on these mean values are given by the standard deviation divided by the square root of the number of C4 values contributing to each bin.
Gamma model:
The Gamma model (McPeek and Speed 1995; Broman and Weber 2000) can be considered as an extension of the counting model (Stahl et al. 2004), allowing for noninteger values of m (supplemental material 1). The advantage over the counting model is that m is continuous, allowing for a broader range of interference effects. When m = 0, the model reduces to Haldane's (1919) model of no interference. For each m value (taken in practice in steps of 0.1 or 0.2), we simulated the statistical properties of recombination events and compared the simulated values to the experimental ones. The simulations produced 107 gametes using the Gamma model. We constructed the histogram of the distances between recombinant intervals, restricted to gametes where there are exactly two recombinant intervals (A, B) and (C, D), where A and B are adjacent, just as C and D are. Letting this histogram of binned distances have the frequencies f1, f2, f3, … , we can then associate the likelihood fj to a DH plant that has two recombinant events at a distance falling in the bin j. The LOD score for a given m is then the sum of the logarithm of each plant's likelihood. The best fit is obtained for the value of m that maximizes this score (see supplemental material 1).
Confidence interval for the estimate of m:
Let m be the interference parameter obtained by fitting to the experimental data and N be the number of experimental DH plants (182 plants for male meiosis and 185 for female meiosis). We generated 105 simulated data sets, each one producing N gametes via the Gamma model of parameter m. The fitting was done for each data set, i.e., for the current set of N simulated crosses. The best adjusted interference parameter me was found through scanning. By simulations, 105 realizations of this random variable m were generated. The confidence interval on m was then given by the two values m− and m+ such that the probability of finding me < m− or me > m+ is 0.025. Significance of male–female differences in interference strength was tested through the H0 hypothesis (the same interference parameter describes the male and female data sets) by the bootstrap method based on data reshuffling (supplemental material 1).
RESULTS
CO distribution along chromosome 3B:
To study the distribution of COs in wheat, comparisons were made between genetic and physical maps of the largest (995 Mb) hexaploid wheat chromosome (3B). Since no particular CO distribution has been observed previously for chromosome 3B compared to other wheat chromosomes (Lukaszewski and Curtis 1993; Akhunov et al. 2003b), this chromosome provides a good model to study CO distribution in wheat.
Linkage analysis using an F2 Chinese Spring × Renan population with 102 selected markers resulted in a genetic map of 179.1 cM in length (Figure 1), which is in the range of the genetic map length reported for chromosome 3B in the literature (Quarrie et al. 2005; Suenaga et al. 2005; Akbari et al. 2006). This represented an average of 1 marker for every 1.75 cM. On this genetic map, a strong concentration of markers was found in the proximal part of the chromosome and a few gaps remained at the distal end of the long arm, in particular between loci Xgpw3233 and Xgwm247, where a gap of 30 cM was observed (Figure 1). No segregation distortion was observed among the 102 loci.
Physical mapping was performed using aneuploid stocks of chromosome 3B developed from cv. Chinese Spring by Sears (1954, 1966; Sears and Sears 1978) and Endo and Gill (1996). The chromosome 3B deletion map consisted of 16 deletion bins, ranging from 4 Mb (3BS4-0.55–0.56 and 3BS2-0.56–0.57) to 208 Mb (3BL7-0.63–1.00) with an average size of 62 Mb (Figure 1, Table 1). The density of markers per bin ranged from one marker per 1.4 Mb in bin 3BS8-0.78–0.87 to one marker per 36 Mb in bin 3BS5-0.07-0.33, with an average of one marker per 9.7 Mb. Very good correlation was found between the physical and genetic maps as all markers assigned to the same deletion bin were linked on the genetic map and the bin order was conserved on the genetic map.
CO frequency (centimorgans per megabase) was calculated for each bin (Figure 1, Table 1) and ranged from 0 in the centromeric region (C-3BS5-0.20, C-3BL2-0.22) to 0.85 in the terminal bin of the short arm (3BS8-0.78–0.87) with an average of 0.18 cM/Mb for the entire chromosome 3B. Crossovers occurred mostly in the distal 40% of the chromosome arms, with the two distal bins 3BS8-0.78–0.87 and 3BL7-0.63–1.00 corresponding to 25% of the physical size of the chromosome accounting for 77% of the COs. There were no COs in the most proximal centromeric regions (bins C-3BL2-0.22 and C-3BS5-0.07) and only three were observed in bin 3BS5-0.07–0.30 (Table 1, Figure 1). Interestingly, slight differences were found between the two arms in terms of both average CO frequency and CO distribution. The short arm displayed an average CO frequency of 0.14 cM/Mb and a clear gradient of CO from the centromere to the telomere with a peak (0.85 cM/Mb) in bin 3BS8-0.78–0.87 (Figure 1). In addition, CO frequency decreased dramatically in the most telomeric bin 3BS3-0.87–1.00 with a value of 0.1 cM/Mb only. In the long arm, the average CO frequency was higher (0.21 cM/Mb) with 87% of the crossovers occurring in bin 3BL7-0.63–1.00 (58% of the whole chromosome CO). In contrast to the short arm, no decrease in the CO frequency was observed in the telomeric part of the long arm. However, the large size of the terminal deletion bin (208 Mb) precluded the fine-scale study of the CO gradient in the telomeric region and possibly prevented the identification of such a decrease. Finally, bin 3BL1-0.31–0.38 showed a higher CO rate than bins 3BL9-0.38–0.50 and 3BL10-0.50–0.63 (Figure 1), though it was difficult to draw any conclusion due to the paucity of markers in these regions.
Similar results were observed using androgenetic and gynogenetic CsCt DH populations with a distribution of COs in bins 3BS8-0.78–0.87 and 3BL7-0.63–1.00 explaining 74% of the COs in the male and 81% in the female maps (supplemental Figure 1). Interestingly, the same decrease in CO number was observed in both maps at the end of the short arm of chromosome 3B.
These results clearly demonstrate that COs on chromosome 3B are localized mainly in two distal regions (bins 3BS8-0.78–0.87 and 3BL7-0.63–1.00) that represent 247 Mb and 25% of the chromosome and that 27% of the chromosome in the centromeric region is devoid of crossovers. In addition, the decrease of CO frequency observed in bin 3BS3-0.87–1.00 and the average rate observed in bin 3BL1-0.31–0.38 strongly suggest that the density of COs is not increasing uniformly from the centromere to the telomere.
Positive interference along chromosome 3B:
To study the interference between COs and potential differences between male and female meiosis, we used two mapping populations produced by andro- or gynogenesis from the cultivars Chinese Spring and Courtot.
No significant difference between the two populations was noted in terms of map size (190.3 and 193.8 cM; supplemental Figure 1) and average number of COs per gamete (male, 1.82; female, 1.87). However, among the 31 intervals studied, one from the distal region of the long arm (Xwmm1133-Xwmm702, P-value = 10−4; supplemental Figure 2) showed a 17-fold increase in female CO rate, suggesting a local impact of sex on CO distribution.
Figure 2.—

Frequency distribution of distances between two COs referred to as intercrossover distances estimated from recombinant intervals. Distances are relative to chromosome genetic map length, which is 190 cM in the male map and 194 cM in the female map. Open bars, female meiosis; hatched bars, male meiosis; wide bars, experimental data; narrow bars, distribution of simulated gametes generated using the Gamma model (see materials and methods). Curves: theoretical expectations under the hypothesis of no crossover interference for male (hatched line and open symbols) and female (solid line and symbols) meiosis.
These 31 intervals (mean size 6.2 cM; range 0.5–27.2 cM) were then used for interference analysis. In the absence of interference, COs produced during meiosis are independent. The noninterference hypothesis H0 (expected CO distribution without interference equals observed CO distribution) was tested using the frequency of the distance between two crossovers, referred as intercrossover distances on the CtCs andro- and gynogenetic maps (Figure 2). H0 P-values of 0.084 for male and 3.6 × 10⁻⁴ for female recombination suggested interference in both male and female meioses with a larger effect in female than in male meiosis.
The intensity of interference was computed using the Gamma model in which the parameter m provides a measure of the degree of interference on the basis of the genetic distances between successive COs. Positive interference, i.e., the inhibition of crossovers by nearby crossovers, is indicated by m values >0. We used the frequency of the genetic distance between two crossovers for male and female meiosis (Figure 2) and compared it with the theoretical distribution obtained with the Gamma model. For male meiosis, the fitted value for m was 1.2, ranging from 0 to 6.1 with a 95% confidence interval. For female meiosis, m varied from 0.95 to 12.75 with a fitted value of 3.5. While these results confirmed the previously suggested greater interference in female meiosis than in male meiosis, the difference was too weak to be statistically significant when tested by bootstrap analysis (P-value = 0.25). Interference was further investigated using the coefficient of coincidence (C), which corresponds to the ratio between the frequency of observed double recombinants and the expected frequency in the absence of interference. Here, we used the C4 parameter (see materials and methods) that allows evaluating the distance range in which interference is effective. The results showed that positive interference is strong within short distances (<10 cM, Figure 3) and decreases with distance to the point where it becomes very weak at distances >45 cM ( > 0.75).
Figure 3.—

Variation of coefficient of coincidence C4 as a function of the distance d4 between intervals. Distances are relative to chromosome genetic map length, which is 190 cM in the male map and 194 cM in the female map. Each point represents the mean value of C4 for all interval pairs with d4 falling into the bin. Solid lines and symbols, female meiosis; dashed lines and open symbols, male meiosis. Circles, all interval pairs; triangles, only interval pairs spanning the centromere (one interval on the short arm and one on the long arm). The dashed horizontal line indicates the expected value of C4 in the absence of interference.
The results also indicated small C4 values <1 for intervals spanning the centromere in male meiosis (Figure 3), suggesting that interference extends through the centromere and that CO formation in the two arms of chromosome 3B is not independent. Moreover, and in contrast to the other regions of the chromosome, interference in the centromeric regions acts on long genetic distances of at least 31 cM (Figure 3). No such pattern was observed for female meiosis.
DISCUSSION
CO distribution along chromosome 3B:
The construction of a dense genetic map of wheat chromosome 3B comprising 102 markers well distributed across the genetic and deletion maps was challenging in a species with a large genome of 17 Gb (Zonneveld et al. 2005), consisting of ∼90% of repeated sequence (Flavell and Smith 1977; Li et al. 2004; Paux et al. 2006), for which no genome sequence is available and showing a low level of polymorphism (Chao et al. 1989; Kam-Morgan et al. 1989; Cadalen et al. 1997). The development of the CsRe genetic map of chromosome 3B was facilitated greatly by the construction of a BAC-based physical map (Paux et al. 2008) that provided a large source of markers well distributed along the minimal tiling path (MTP) of this chromosome. ISBP markers (Paux et al. 2006) derived from the BAC end sequences of the MTP were particularly useful for filling gaps on the genetic map and ensuring a homogeneous marker distribution along the chromosome.
Comparison of the CsRe genetic map with the physical deletion map showed that the order of the loci is highly conserved between the two maps. This is probably due to the fact that Chinese Spring was used as one of the parents in our mapping population and for the construction of the physical map. Thus, the CsRe mapping population seems very well adapted for ordering contigs of the physical maps from the other chromosomes of cv. Chinese Spring that are currently under construction in the framework of the International Wheat Genome Sequencing Initiative (see http://www.wheatgenome.org for further information).
Analysis of the CO distribution along chromosome 3B showed a recombination gradient from the centromere to the telomeres on both arms and a suppression of COs in 27% of the chromosome in the proximal regions. This latter phenomenon was observed in the first-generation deletion bin maps of group-7 chromosomes (Werner et al. 1992) and the other homeologous group chromosomes of wheat (for review see Erayman et al. 2004). The absence of CO at the centromere is a general feature of most of the species studied so far independently of their genome size and complexity (Anderson et al. 2003; Wu et al. 2003; Jensen-Seaman et al. 2004; Drouaud et al. 2006). Thus, our results on chromosome 3B confirm the general trend and demonstrate that even if it is the largest chromosome (995 Mb), the CO pattern is representative of all other wheat chromosomes.
Interestingly, the high resolution of the maps allowed us to observe a dramatic decrease in the COs' gradient at the very distal end of the short arm, suggesting suppressed recombination in this region. This decrease was also observed in the cross between Courtot and Chinese Spring (Figure 1 in supplemental material 2) as well as in an unrelated population developed between the cultivars Arche and Recital (data not shown), suggesting that the pattern observed in the CsRe map reflects a general behavior of CO distribution on chromosome 3B. A possible explanation could be the lack of markers close to the telomere that would lead to an underestimation of the total CO number and of the CO frequency for the terminal bin. However, synteny with rice suggests that the most distal marker (Xgwm389) is very close to the telomere. Indeed, although the synteny with Xgwm389 could not be determined because it is a microsatellite, two BAC contigs located proximal to Xgwm389 and carrying the SSR markers Xgwm1034 and cfb6012 and also ESTs BE404656 and BJ302829 correspond to sequences containing the orthologous genes OS01G01960 and OS01G03100 located on positions 500 kb–1 Mb, respectively, on rice chromosome 1 (data not shown). Thus, these results suggest that the whole deletion bin is covered and that most of the COs occurring in the telomeric bin are included in our genetic map. Another possibility to explain the reduced or suppressed recombination in the terminal region is the high heterochromatin content of the telomeric end of wheat chromosome 3B (Gill et al. 1991), with heterochromatin being well known to inhibit crossover formation (Gaut et al. 2007). Our findings, observed on four different populations, conflict with the previous study of Erayman et al. (2004), who observed high recombination frequency in the most distal bin (3BS3-0.87–1.00) and no recombination in the subterminal bin 3BS8-0.78–0.87. The discrepancy probably originates from differences in the relative position of markers on the genetic and deletion maps between the two studies that likely result from the use of a consensus deletion map from the A, B, and D group-3 chromosomes and a nonsystematic assignation of markers in deletion bins by Erayman et al. (2004).
In contrast, no decrease in CO number was observed at the telomere of the long arm of chromosome 3B. Lukaszewski and Curtis (1993) showed that the CO frequency was higher in the subtelomeric region of the long arm of chromosome 3B, suggesting a pattern similar to the one we observed on the short arm. Probably the size of terminal deletion bin 3BL7-0.63–1.00 (208 Mb) precluded the detection of such a decrease in our study. Decreasing CO number at the end of chromosomes was also reported in a cross between rye and wheat (Lukaszewski et al. 2004) and in the telomeric parts of chromosome 3, in the orthologous chromosome of wheat chromosome 3B, in a cross between Lolium and Festuca (King et al. 2002, 2007). Additional mapping data on chromosome 3B and other wheat chromosomes for which high-resolution genetic and physical maps are underway at the international level (http://www.wheatgenome.org) will help to confirm the CO pattern in the telomeric ends of the chromosomes. The fact that 70% of the recombination occurs in the most distal part (23 Mb) of the long arm of chromosome 4B (See et al. 2006) may indicate that each chromosome has a specific pattern of recombination distribution in the telomeric regions.
In addition to the decrease of CO frequency in the distal part of the short arm, we observed an increase of CO frequency in the middle part of the long arm (bin 3BL1-0.31–0.38). Thus, it appears that at least along chromosome 3B, CO frequency does not follow a simple gradient from the centromeres to the telomeres. This implies that cloning a gene in a distal position on a wheat chromosome may sometimes be more difficult than expected while cloning a gene in the middle part would be possible without developing very large segregating populations.
CO distribution was shown to be correlated with genes in human (Kong et al. 2002), mouse (Paigen et al. 2008), rice (Wu et al. 2003), and maize (Anderson et al. 2006). In wheat, Erayman et al. (2004) showed that seven gene-rich regions (GRRs) are present on a consensus chromosome 3 map (three on the short arm and four on the long arm) and that most of the recombination occurs within the GRRs. In our study, we also observed a correlation between the CO frequency and the presence of the GRRs on the long arm. Especially, the increase of CO frequency that was found in bin 3BL1-0.31–0.38 corresponded exactly to the major GRR (3L0.3) mentioned by Erayman et al. (2004) in the middle of this arm. In contrast, we did not find the same correlation on the short arm. Maximal recombination was observed in bin 3BS8-0.78–0.87, which does not correspond to one of the GRR regions that was defined on the short arm of chromosome 3B. As discussed previously, this is likely due to the nonsystematic assignment by Erayman et al. (2004) of markers in deletion bins and the identification of the GRR on the short arm might need to be reassessed with more markers and on individual chromosomes.
If a large recombination gradient can be observed in large genome species such as wheat, barley (Kunzel et al. 2000), and maize (Anderson et al. 2003), recombination is more evenly distributed in species with smaller genomes such as rice (Wu et al. 2003). In the small genome species Arabidopsis thaliana, no gradient has been observed (Drouaud et al. 2006), suggesting that the pattern of CO distribution is correlated with genome size. In species displaying a CO gradient, the high CO rates observed in subtelomeric regions are explained generally by the distal position of these regions. This hypothesis is supported by the fact that chromosomes with terminal deletions show increased CO number in regions that were formerly proximal (Jones et al. 2002; Qi et al. 2002). Higher CO rates in distal subtelomeric regions of chromosomes have been related to the onset of meiosis with the bouquet formation occurring in the vicinity of these regions thereby favoring CO formation (Corredor et al. 2007). This feature, however, is a common feature of meiosis and thus also appears in species with small genomes that do not show such contrast in CO rate between distal and proximal regions. Moreover, very recently, Lukaszewski (2008) showed that a rye chromosome with an inverted long arm where the telomeric regions are located at the centromere exhibited simultaneously an inverted pattern of chiasma distribution; i.e., recombination was higher close to the neocentromeric regions. He concluded that CO frequency along a chromosome is not position dependent but sequence dependent. In contrast to species with small genomes, those with large genomes show extensive chromosome remodeling in their subterminal chromosomal regions (Dawe et al. 1994; Prieto et al. 2004), thereby suggesting that high CO rates are due to remodeling in these regions. A recent study (Colas et al. 2008) of the meiotic behavior of translocated rye chromosomes showed that when chromosome remodeling is inhibited in the heterozygous subterminal regions of rye chromosome 1R in a 1BL.1RS wheat–rye translocation line, COs are also inhibited. To confirm this hypothesis, it would be interesting to study whether remodeling is observed in new distal regions of deleted chromosomes or chromosomes with inverted arms.
Positive interference along chromosome 3B:
In addition to the frequency of individual CO formation, recombination is influenced by interference, i.e., the effect of one CO on the occurrence of other COs in its vicinity. Here, we analyzed for the first time in wheat the intensity of the interference on a chromosome, using a Gamma model. Estimates of the interference parameter m of 1.2 for male meiosis and 3.5 for female meiosis were found. In tomato, late recombination nodules observations indicated m values of 1.3 and 1.9 for chromosomes 1 and 2, respectively (Lhuissier et al. 2007). Similar values were obtained from genetic mapping data, in human (m = 2.3) (Broman and Weber 2000) and Arabidopsis (m = 3–9) (Copenhaver et al. 2002), whereas m values between 5.0 and infinity were observed in mouse (Broman et al. 2002). Understanding the molecular basis of interference intensity difference is a very challenging task that is under progress in model species such as yeast and Arabidopsis.
On the basis of the coefficient of coincidence, our results indicated strong positive interference at distances <10 cM. We confirmed this interference in a different cross where the screening of >1400 F2 CsRe using two markers separated by 12 cM and localized in the distal part of the short arm showed an absence of double COs (P-value = 0.015, data not shown). In wheat and barley, Peng et al. (2000) and Esch and Weber (2002) reported negative interference within short distances. However, in contrast to our study that is based on doubled-haploid populations, Peng et al. (2000) used F2 plants. Estimation of the coefficient of coincidence with this type of population is biased because two independent gametes are considered as one. To deal with dependency, an expectation-maximization (EM) procedure needs to be used on F2 populations for distinguishing independent meiotic events present in an F2 individual. In any case, using an F2 population results in substantial loss of statistical power to detect interference compared to DH populations in which individual gametes are considered. Moreover, in their studies, Peng et al. (2000) and Esch and Weber (2002) considered intervals with very small numbers of recombinants (<10), thereby introducing another bias in the measurement of the coefficient of coincidence and leading to potentially large overestimations (Martin and Hospital 2006). Thus using an F2 population and analyzing small intervals result in an overestimation of double recombination events, in high values for the coefficient of coincidence (C > 1), and, finally, in what appears to be negative interference.
The coefficient of coincidence analysis also shows that interference acts across the centromere in male meiosis, a phenomenon that has been seen already in other species (Colombo and Jones 1997; Drouaud et al. 2007; Lian et al. 2008). Our results suggest that, in wheat, the interference range differs between proximal and distal regions by acting on longer genetic distances around the centromere (30 cM) compared to the other regions (10 cM). In humans and mice (Codina-Pascual et al. 2006; Petkov et al. 2007), interference was shown to be correlated with the synaptonemal complex length and therefore was constant on physical distances measured in micrometers along the entire chromosome. However, distances estimated in micrometers depend on chromatin compaction, implying that 1 μm represents a longer physical distance measured in megabases in condensed regions compared to less condensed regions. As proximal regions of chromosome 3B are rich in heterochromatin (Gill et al. 1991), they are probably highly condensed and 1 μm in these regions represents a much larger physical size in megabases compared to 1 μm in the distal regions. Consequently, more COs can occur in the large physical (megabases) proximal regions, which could explain the longer genetic interval observed for the interference range around the centromere.
Genetic mapping in wheat:
The CsRe mapping data presented in this article showed that chromosome 3B exhibits on average 3.60 COs per bivalent at each meiosis. This is slightly higher than the 2.97 chiasmata observed by Sallee and Kimber (1978) and is probably due to the difficulty to accurately estimate chiasma number on this very large chromosome since the frequency of two close COs on the same arm is more frequent than on short chromosomes. However, it confirms that the coverage of the genetic map was complete and took into account all the possible CO events. With 48.3 chiasma suggested for the entire genome (Sallee and Kimber 1978), the size of a wheat genetic map should be ∼2400 cM. Considering the slight underestimation of chiasma number, the size should rather be between 2400 and 3000 cM. Wheat genetic maps that were developed initially were smaller than expected (1700–1800 cM; for a review see Varshney et al. 2004). However, these maps covered only poorly the whole genome with sometimes chromosomes that were not represented (Cadalen et al. 1997). The actual sizes of wheat genetic maps range from 2500 to 4000 cM (Sourdille et al. 2003; Quarrie et al. 2005; Suenaga et al. 2005; Akbari et al. 2006; Torada et al. 2006; Xue et al. 2008), indicating that some of them exceed the expected value. This may suggest genotyping errors, the use of not well-adapted mapping functions, or differences in CO frequencies between different wheat varieties and provides a note of caution on the quality of the genetic maps of wheat. Analysis of the coefficient of coincidence showed that interference is strong at short distances, inhibiting the formation of double COs. This was proved by the size of our genetic map that was similar to previously published maps even though a larger number of markers (102) were used in our study. Thus, these results confirm that the size increase of genetic maps that results from the addition of markers reflects genotyping errors rather than double COs.
Conclusions:
In this work, we analyzed the recombination gradient and the interference, two factors that influence recombination on wheat chromosome 3B. At least one additional factor affects recombination distribution and rate: sequence similarity between the homologous chromosomes. This was demonstrated in yeast (Datta et al. 1997), in mammalian cells (Lukacsovich and Waldman 1999), and in Arabidopsis (Opperman et al. 2004). In wheat, genetic maps obtained from interspecific crosses are shorter than those issued from intraspecific crosses (Luo et al. 2000), suggesting lower recombination rates in the former case. Moreover, recombination is known to be reduced at the level of introgressed segments (Ji and Chetelat 2007). The direct effect of sequence similarity has not been studied so far in wheat because large stretches of sequence from different varieties are not available yet. Crossover distribution is best studied in species for which whole genome sequences are available. To better study this essential phenomenon in wheat, we are currently sequencing and comparing large stretches of DNA originating from recombinant and nonrecombinant regions in different wheat varieties.
Acknowledgments
We thank J. Philippon and D. Boyer for their technical help. We also thank G. Gay, M. R. Perretant, S. Bernard, and A. Madeore for the development of populations. We are grateful to C. Mezard, B. S. Gill, and S. Faure for critical reading of the manuscript and to K. Eversole for editing. Génoplante, Rouergue Auvergne Gévaudan Tarnais, and Syngenta are greatly acknowledged for providing, respectively, the gpw, wmm, and nw/dw SSRs. We thank also the members of the GENTYANE genotyping platform of the UMR GDEC 1095 for their technical support during genotyping. This work has been supported by grants from the Agence Nationale de la Recherche (ANR-05-BLANC-0258-01 and ANR-07-BLANC-COPATH) and from the Institut National de la Recherche Agronomique. C.S. is funded by a grant from the French Ministry of Research.
References
- Akbari, M., P. Wenzl, V. Caig, J. Carling, L. Xia et al., 2006. Diversity arrays technology (DArT) for high-throughput profiling of the hexaploid wheat genome. Theor. Appl. Genet. 113 1409–1420. [DOI] [PubMed] [Google Scholar]
- Akhunov, E. D., A. R. Akhunova, A. M. Linkiewicz, J. Dubcovsky, D. Hummel et al., 2003. a Synteny perturbations between wheat homoeologous chromosomes caused by locus duplications and deletions correlate with recombination rates. Proc. Natl. Acad. Sci. USA 100 10836–10841. [DOI] [PMC free article] [PubMed] [Google Scholar]
- Akhunov, E. D., A. W. Goodyear, S. Geng, L. L. Qi, B. Echalier et al., 2003. b The organization and rate of evolution of wheat genomes are correlated with recombination rates along chromosome arms. Genome Res. 13 753–763. [DOI] [PMC free article] [PubMed] [Google Scholar]
- Anderson, K. A., and S. M. Stack, 2002. Meiotic recombination in plants. Curr. Genomics 3 507–525. [Google Scholar]
- Anderson, L. K., G. G. Doyle, B. Brigham, J. Carter, K. D. Hooker et al., 2003. High-resolution crossover maps for each bivalent of Zea mays using recombination nodules. Genetics 165 849–865. [DOI] [PMC free article] [PubMed] [Google Scholar]
- Anderson, L. K., A. Lai, S. M. Stack, C. Rizzon and B. S. Gaut, 2006. Uneven distribution of expressed sequence tag loci on maize pachytene chromosomes. Genome Res. 16 115–122. [DOI] [PMC free article] [PubMed] [Google Scholar]
- Arnheim, N., P. Calabrese and I. Tiemann-Boege, 2007. Mammalian meiotic recombination hot spots. Annu. Rev. Genet. 41 369–399. [DOI] [PubMed] [Google Scholar]
- Baudat, F., and B. de Massy, 2007. Regulating double-stranded DNA break repair towards crossover or non-crossover during mammalian meiosis. Chromosome Res. 15 565–577. [DOI] [PubMed] [Google Scholar]
- Broman, K. W., and J. L. Weber, 2000. Characterization of human crossover interference. Am. J. Hum. Genet. 66 1911–1926. [DOI] [PMC free article] [PubMed] [Google Scholar]
- Broman, K. W., L. B. Rowe, G. A. Churchill and K. Paigen, 2002. Crossover interference in the mouse. Genetics 160 1123–1131. [DOI] [PMC free article] [PubMed] [Google Scholar]
- Cadalen, T., C. Boeuf, S. Bernard and M. Bernard, 1997. An intervarietal molecular marker map in Triticum aestivum L. em. Thell. and comparison with a map from a wide cross. Theor. Appl. Genet. 94 367–377. [Google Scholar]
- Chao, S., P. J. Sharp, A. J. Worland, E. J. Warham, R. M. D. Koebner et al., 1989. RFLP-based genetic maps of wheat homoeologous group 7 chromosomes. Theor. Appl. Genet. 78 495–504. [DOI] [PubMed] [Google Scholar]
- Codina-Pascual, M., M. Campillo, J. Kraus, M. R. Speicher, J. Egozcue et al., 2006. Crossover frequency and synaptonemal complex length: their variability and effects on human male meiosis. Mol. Hum. Reprod. 12 123–133. [DOI] [PubMed] [Google Scholar]
- Colas, I., P. Shaw, P. Prieto, M. Wanous, W. Spielmeyer et al., 2008. Effective chromosome pairing requires chromatin remodeling at the onset of meiosis. Proc. Natl. Acad. Sci. USA 105 6075–6080. [DOI] [PMC free article] [PubMed] [Google Scholar]
- Colombo, P. C., and G. H. Jones, 1997. Chiasma interference is blind to centromeres. Heredity 79 214–227. [DOI] [PubMed] [Google Scholar]
- Copenhaver, G. P., E. A. Housworth and F. W. Stahl, 2002. Crossover interference in Arabidopsis. Genetics 160 1631–1639. [DOI] [PMC free article] [PubMed] [Google Scholar]
- Corredor, E., A. J. Lukaszewski, P. Pachon, D. C. Allen and T. Naranjo, 2007. Terminal regions of wheat chromosomes select their pairing partners in meiosis. Genetics 177 699–706. [DOI] [PMC free article] [PubMed] [Google Scholar]
- Cromie, G. A., and G. R. Smith, 2007. Branching out: meiotic recombination and its regulation. Trends Cell Biol. 17 448–455. [DOI] [PubMed] [Google Scholar]
- Datta, A., M. Hendrix, M. Lipsitch and S. Jinks-Robertson, 1997. Dual roles for DNA sequence identity and the mismatch repair system in the regulation of mitotic crossing-over in yeast. Proc. Natl. Acad. Sci. USA 94 9757–9762. [DOI] [PMC free article] [PubMed] [Google Scholar]
- Dawe, R. K., J. W. Sedat, D. A. Agard and W. Z. Cande, 1994. Meiotic chromosome pairing in maize is associated with a novel chromatin organization. Cell 76 901–912. [DOI] [PubMed] [Google Scholar]
- Drouaud, J., C. Camilleri, P. Y. Bourguignon, A. Canaguier, A. Berard et al., 2006. Variation in crossing-over rates across chromosome 4 of Arabidopsis thaliana reveals the presence of meiotic recombination “hot spots”. Genome Res. 16 106–114. [DOI] [PMC free article] [PubMed] [Google Scholar]
- Drouaud, J., R. Mercier, L. Chelysheva, A. Berard, M. Falque et al., 2007. Sex-specific crossover distributions and variations in interference level along Arabidopsis thaliana chromosome 4. PLoS Genet. 3 e106. [DOI] [PMC free article] [PubMed] [Google Scholar]
- Dvorak, J., and E. D. Akhunov, 2005. Tempos of gene locus deletions and duplications and their relationship to recombination rate during diploid and polyploid evolution in the Aegilops-Triticum alliance. Genetics 171 323–332. [DOI] [PMC free article] [PubMed] [Google Scholar]
- Dvorak, J., Z. L. Yang, F. M. You and M. C. Luo, 2004. Deletion polymorphism in wheat chromosome regions with contrasting recombination rates. Genetics 168 1665–1675. [DOI] [PMC free article] [PubMed] [Google Scholar]
- Endo, T. R., and B. S. Gill, 1996. The deletion stocks of common wheat. J. Hered. 87 295–307. [Google Scholar]
- Erayman, M., D. Sandhu, D. Sidhu, M. Dilbirligi, P. S. Baenziger et al., 2004. Demarcating the gene-rich regions of the wheat genome. Nucleic Acids Res. 32 3546–3565. [DOI] [PMC free article] [PubMed] [Google Scholar]
- Esch, E., and E. Weber, 2002. Investigation of crossover interference in barley (Hordeum vulgare L.) using the coefficient of coincidence. Theor. Appl. Genet. 104 786–796. [DOI] [PubMed] [Google Scholar]
- Faris, J. D., K. M. Haen and B. S. Gill, 2000. Saturation mapping of a gene-rich recombination hot spot region in wheat. Genetics 154 823–835. [DOI] [PMC free article] [PubMed] [Google Scholar]
- Felix, I., J. P. Martinant, M. Bernard, S. Bernard and G. Branlard, 1996. Genetic characterization of storage proteins in a set of F1-derived haploid lines in bread wheat. Theor. Appl. Genet. 92 340–346. [DOI] [PubMed] [Google Scholar]
- Flavell, R. B., and D. B. Smith, 1977. Hyperpolymer formation during renaturation of DNA from genomes with different sequence organisation. Nucleic Acids Res. 4 2429–2444. [DOI] [PMC free article] [PubMed] [Google Scholar]
- Fu, H., W. Park, X. Yan, Z. Zheng, B. Shen et al., 2001. The highly recombinogenic bz locus lies in an unusually gene-rich region of the maize genome. Proc. Natl. Acad. Sci. USA 98 8903–8908. [DOI] [PMC free article] [PubMed] [Google Scholar]
- Gaut, B. S., S. I. Wright, C. Rizzon, J. Dvorak and L. K. Anderson, 2007. Recombination: an underappreciated factor in the evolution of plant genomes. Nat. Rev. Genet. 8 77–84. [DOI] [PubMed] [Google Scholar]
- Gill, B. S., B. Friebe and T. R. Endo, 1991. Standard karyotype and nomenclature system for description of chromosome bands and structural aberrations in wheat (Triticum aestivum). Genome 34 830–839. [Google Scholar]
- Haldane, J. B. S., 1919. The combination of linkage values and the calculation of distance between the loci of linked factors. J. Genet. 8 299–309. [Google Scholar]
- Hamant, O., H. Ma and W. Z. Cande, 2006. Genetics of meiotic prophase I in plants. Annu. Rev. Plant Biol. 57 267–302. [DOI] [PubMed] [Google Scholar]
- Hochberg, Y., 1988. A sharper Bonferonni procedure for multiple tests of significance. Biometrika 75 800–803. [Google Scholar]
- Hodges, E., S. M. Boddy, S. Thomas and J. L. Smith, 1997. Modification of IgH PCR clonal analysis by the addition of sucrose and cresol red directly to PCR reaction mixes. Mol. Pathol. 50 164–166. [DOI] [PMC free article] [PubMed] [Google Scholar]
- Jensen-Seaman, M. I., T. S. Furey, B. A. Payseur, Y. Lu, K. M. Roskin et al., 2004. Comparative recombination rates in the rat, mouse, and human genomes. Genome Res. 14 528–538. [DOI] [PMC free article] [PubMed] [Google Scholar]
- Ji, Y., and R. T. Chetelat, 2007. GISH analysis of meiotic chromosome pairing in Solanum lycopersicoides introgression lines of cultivated tomato. Genome 50 825–833. [DOI] [PubMed] [Google Scholar]
- Jones, E., K. Rybka and J. Lukaszewski, 2002. The effect of a deficiency and a deletion on recombination in chromosome 1BL in wheat. Theor. Appl. Genet. 104 1204–1208. [DOI] [PubMed] [Google Scholar]
- Jones, G. H., 1987. Chiasmata. Academic Press, New York.
- Jones, G. H., and F. C. Franklin, 2006. Meiotic crossing-over: obligation and interference. Cell 126 246–248. [DOI] [PubMed] [Google Scholar]
- Kam-Morgan, L. N. W., B. S. Gill and S. Muthukrishnan, 1989. DNA restriction fragment length polymorphisms: a strategy for genetic mapping of D genome of wheat. Genome 32 724–732. [Google Scholar]
- King, J., I. P. Armstead, I. S. Donnison, H. M. Thomas, R. N. Jones et al., 2002. Physical and genetic mapping in the grasses Lolium perenne and Festuca pratensis. Genetics 161 315–324. [DOI] [PMC free article] [PubMed] [Google Scholar]
- King, J., I. P. Armstead, I. S. Donnison, L. A. Roberts, J. A. Harper et al., 2007. Comparative analyses between Lolium/Festuca introgression lines and rice reveal the major fraction of functionally annotated gene models is located in recombination-poor/very recombination-poor regions of the genome. Genetics 177 597–606. [DOI] [PMC free article] [PubMed] [Google Scholar]
- Kong, A., D. F. Gudbjartsson, J. Sainz, G. M. Jonsdottir, S. A. Gudjonsson et al., 2002. A high-resolution recombination map of the human genome. Nat. Genet. 31 241–247. [DOI] [PubMed] [Google Scholar]
- Kosambi, D. D., 1944. The estimation of map distances from recombination values. Ann. Eugen. 12 172–175. [Google Scholar]
- Kunzel, G., L. Korzun and A. Meister, 2000. Cytologically integrated physical restriction fragment length polymorphism maps for the barley genome based on translocation breakpoints. Genetics 154 397–412. [DOI] [PMC free article] [PubMed] [Google Scholar]
- Lander, E. S., P. Green, J. Abrahamson, A. Barlow, M. J. Daly et al., 1987. MAPMAKER: an interactive computer package for constructing primary genetic linkage maps of experimental and natural populations. Genomics 1 174–181. [DOI] [PubMed] [Google Scholar]
- Laurie, D. A., and M. D. Bennett, 1988. The production of haploid wheat plants from wheat x maize crosses. Theor. Appl. Genet. 3 393–397. [DOI] [PubMed] [Google Scholar]
- Lhuissier, F. G., H. H. Offenberg, P. E. Wittich, N. O. Vischer and C. Heyting, 2007. The mismatch repair protein MLH1 marks a subset of strongly interfering crossovers in tomato. Plant Cell 19 862–876. [DOI] [PMC free article] [PubMed] [Google Scholar]
- Li, W., P. Zhang, J. P. Fellers, B. Friebe and B. S. Gill, 2004. Sequence composition, organization, and evolution of the core Triticeae genome. Plant J. 40 500–511. [DOI] [PubMed] [Google Scholar]
- Lian, J., Y. Yin, M. Oliver-Bonet, T. Liehr, E. Ko et al., 2008. Variation in crossover interference levels on individual chromosomes from human males. Hum. Mol. Genet. 17 2583–2594. [DOI] [PubMed] [Google Scholar]
- Lukacsovich, T., and A. S. Waldman, 1999. Suppression of intrachromosomal gene conversion in mammalian cells by small degrees of sequence divergence. Genetics 151 1559–1568. [DOI] [PMC free article] [PubMed] [Google Scholar]
- Lukaszewski, A., and C. A. Curtis, 1993. Physical distribution of recombination in B-genome chromosome of tetraploid wheat. Theor. Appl. Genet. 86 121–127. [DOI] [PubMed] [Google Scholar]
- Lukaszewski, A. J., 2008. Unexpected behavior of an inverted rye chromosome arm in wheat. Chromosoma 117 569–578. [DOI] [PubMed] [Google Scholar]
- Lukaszewski, A. J., K. Rybka, V. Korzun, S. V. Malyshev, B. Lapinski et al., 2004. Genetic and physical mapping of homoeologous recombination points involving wheat chromosome 2B and rye chromosome 2R. Genome 47 36–45. [DOI] [PubMed] [Google Scholar]
- Luo, M. C., Z. L. Yang, R. S. Kota and J. Dvorak, 2000. Recombination of chromosomes 3A(m) and 5A(m) of Triticum monococcum with homeologous chromosomes 3A and 5A of wheat: the distribution of recombination across chromosomes. Genetics 154 1301–1308. [DOI] [PMC free article] [PubMed] [Google Scholar]
- Martin, O. C., and F. Hospital, 2006. Two- and three-locus tests for linkage analysis using recombinant inbred lines. Genetics 173 451–459. [DOI] [PMC free article] [PubMed] [Google Scholar]
- McPeek, M. S., and T. P. Speed, 1995. Modeling interference in genetic recombination. Genetics 139 1031–1044. [DOI] [PMC free article] [PubMed] [Google Scholar]
- Nicot, N., V. Chiquet, B. Gandon, L. Amilhat, F. Legeai et al., 2004. Study of simple sequence repeat (SSR) markers from wheat expressed sequence tags (ESTs). Theor. Appl. Genet. 109 800–805. [DOI] [PubMed] [Google Scholar]
- Opperman, R., E. Emmanuel and A. A. Levy, 2004. The effect of sequence divergence on recombination between direct repeats in Arabidopsis. Genetics 168 2207–2215. [DOI] [PMC free article] [PubMed] [Google Scholar]
- Paigen, K., J. P. Szatkiewicz, K. Sawyer, N. Leahy, E. D. Parvanov et al., 2008. The recombinational anatomy of a mouse chromosome. PLoS Genet. 4 e1000119. [DOI] [PMC free article] [PubMed] [Google Scholar]
- Paux, E., D. Roger, E. Badaeva, G. Gay, M. Bernard et al., 2006. Characterizing the composition and evolution of homoeologous genomes in hexaploid wheat through BAC-end sequencing on chromosome 3B. Plant J. 48 463–474. [DOI] [PubMed] [Google Scholar]
- Paux, E., P. Sourdille, J. Salse, C. Saintenac, F. Choulet et al., 2008. A physical map of the 1Gb bread wheat chromosome 3B. Science 322 101–104. [DOI] [PubMed] [Google Scholar]
- Peng, J., A. B. Korol, T. Fahima, M. S. Roder, Y. I. Ronin et al., 2000. Molecular genetic maps in wild emmer wheat, Triticum dicoccoides: genome-wide coverage, massive negative interference, and putative quasi-linkage. Genome Res. 10 1509–1531. [DOI] [PMC free article] [PubMed] [Google Scholar]
- Petkov, P. M., K.W. Broman, J. P. Szatkiewicz and K. Paigen, 2007. Crossover interference underlies sex differences in recombination rates. Trends Genet. 23 539–542. [DOI] [PubMed] [Google Scholar]
- Prieto, P., P. Shaw and G. Moore, 2004. Homologue recognition during meiosis is associated with a change in chromatin conformation. Nat. Cell Biol. 6 906–908. [DOI] [PubMed] [Google Scholar]
- Qi, L. L., B. Friebe and B. S. Gill, 2002. A strategy for enhancing recombination in proximal regions of chromosomes. Chromosome Res. 10 645–654. [DOI] [PubMed] [Google Scholar]
- Quarrie, S. A., A. Steed, C. Calestani, A. Semikhodskii, C. Lebreton et al., 2005. A high-density genetic map of hexaploid wheat (Triticum aestivum L.) from the cross Chinese Spring x SQ1 and its use to compare QTLs for grain yield across a range of environments. Theor. Appl. Genet. 110 865–880. [DOI] [PubMed] [Google Scholar]
- Sallee, P. J., and G. Kimber, 1978. An analysis of the pairing of wheat telocentric chromosomes. Proceedings of the 5th International Wheat Genetics Symposium, edited by S. Ramanujam, pp. 408–419. Indian Society of Genetics and Plant Breeding, New Delhi.
- Sears, E. R., 1954. The aneuploids of common wheat. Univ. Mo. Res. Bull. 572 1–58. [Google Scholar]
- Sears, E. R., 1966. Nullisomic-tetrasomic combinations in hexaploid wheat, pp. 29–45 in Chromosome Manipulations and Plant Genetics, edited by R. Riley and K. R. Lewis. Oliver & Boyd, London.
- Sears, E. R., and L. M. S. Sears, 1978. The telocentric chromosomes of common wheat. Proceedings of the 5th International Wheat Genetics Symposium, edited by S. Ramanujam, pp. 389–407. Indian Society of Genetics and Plant Breeding, New Delhi.
- See, D. R., S. Brooks, J. C. Nelson, G. Brown-Guedira, B. Friebe et al., 2006. Gene evolution at the ends of wheat chromosomes. Proc. Natl. Acad. Sci. USA 103 4162–4167. [DOI] [PMC free article] [PubMed] [Google Scholar]
- Sidhu, D., and K. S. Gill, 2004. Distribution of genes and recombination in wheat and other eucaryotes. Plant Cell Tissue Organ Cult. 79 257–270. [Google Scholar]
- Sourdille, P., T. Cadalen, H. Guyomarc'h, J. W. Snape, M. R. Perretant et al., 2003. An update of the Courtot x Chinese Spring intervarietal molecular marker linkage map for the QTL detection of agronomic traits in wheat. Theor. Appl. Genet. 106 530–538. [DOI] [PubMed] [Google Scholar]
- Stahl, F. W., H. M. Foss, L. S. Young, R. H. Borts, M. F. Abdullah et al., 2004. Does crossover interference count in Saccharomyces cerevisiae? Genetics 168 35–48. [DOI] [PMC free article] [PubMed] [Google Scholar]
- Suenaga, K., M. Khairallah, H. M. William and D. A. Hoisington, 2005. A new intervarietal linkage map and its application for quantitative trait locus analysis of “gigas” features in bread wheat. Genome 48 65–75. [DOI] [PubMed] [Google Scholar]
- Tenaillon, M. I., M. C. Sawkins, A. D. Long, R. L. Gaut, J. F. Doebley et al., 2001. Patterns of DNA sequence polymorphism along chromosome 1 of maize (Zea mays ssp. mays L.). Proc. Natl. Acad. Sci. USA 98 9161–9166. [DOI] [PMC free article] [PubMed] [Google Scholar]
- Torada, A., M. Koike, K. Mochida and Y. Ogihara, 2006. SSR-based linkage map with new markers using an intraspecific population of common wheat. Theor. Appl. Genet. 112 1042–1051. [DOI] [PubMed] [Google Scholar]
- Varshney, R. K., V. Korzun and A. Börner, 2004. Molecular maps in cereals: methodology and progress, pp. 35–82 in Cereal Genomics, edited by P. K. Gupta and R. K. Varshney. Kluwer Academic Publishers, Dordrecht, The Netherlands.
- Werner, J. E., T. R. Endo and B. S. Gill, 1992. Toward a cytogenetically based physical map of the wheat genome. Proc. Natl. Acad. Sci. USA 89 11307–11311. [DOI] [PMC free article] [PubMed] [Google Scholar]
- Wu, J., H. Mizuno, M. Hayashi-Tsugane, Y. Ito, Y. Chiden et al., 2003. Physical maps and recombination frequency of six rice chromosomes. Plant J. 36 720–730. [DOI] [PubMed] [Google Scholar]
- Xue, S., Z. Zhang, F. Lin, Z. Kong, Y. Cao et al., 2008. A high-density intervarietal map of the wheat genome enriched with markers derived from expressed sequence tags. Theor. Appl. Genet. 117 181–189. [DOI] [PubMed] [Google Scholar]
- Zonneveld, B. J., I. J. Leitch and M. D. Bennett, 2005. First nuclear DNA amounts in more than 300 angiosperms. Ann. Bot. 96 229–244. [DOI] [PMC free article] [PubMed] [Google Scholar]