

Abstract
This study evaluates the event-related potential (ERP) components in a single outcome gambling task that involved monetary losses and gains. The participants were 50 healthy young volunteers (25 males and 25 females). The gambling task involved valence (loss and gain) and amount (50¢ and 10¢) as outcomes. The outcome-related negativity (ORN/N2) and outcome-related positivity (ORP/P3) were analyzed and compared across conditions and gender. Monetary gain (compared to loss) and higher amount (50¢ compared to 10¢) produced higher amplitudes and shorter latencies in both ORN and ORP components. Difference wave plots showed that earlier processing (200-400 ms) is dominated by the valence (loss/gain) while later processing (after 400 ms) is marked by the amount (50¢/10¢). Functional mapping using Low Resolution Electromagnetic Tomography (LORETA) indicated that the ORN separated the loss against gain in both genders, while the ORP activity distinguished the 50¢ against 10¢ in males. This study further strengthens the view that separate brain processes/circuitry may mediate loss and gain. Although there were no gender differences in behavioral and impulsivity scores, ORN and ORP measures for different task conditions had significant correlations with behavioral scores. This gambling paradigm may potentially offer valuable indicators to study outcome processing and impulsivity in normals as well as in clinical populations.
Keywords: Outcome-related negativity (ORN), Outcome-related positivity (ORP), Medial Frontal Negativity (MFN), N2, P3, gambling task, LORETA, impulsivity
1. Introduction
In recent years, there has been a focused research interest to examine the event-related potential (ERP) components in gambling-type paradigms. This trend is a continuation of numerous studies on error-related negativity (ERN or Ne), a sharp negative deflection in the ERP waveform with a frontocentral scalp distribution peaking around 100 ms following an erroneous response in choice-reaction tasks [1-14]. Medial frontal negativity (MFN), a closely related phenomenon to ERN, was recently reported by Gehring & Willoughby [15]. MFN occurred around 250 ms after outcome stimuli that informed human participants about gains and losses in a two-choice two-outcome (TCTO) gambling task. While various researchers have referred to this component as feedback-related negativity (FRN) [16] or feedback ERN (fERN) [17], we propose that this component be labeled as outcome-related negativity (ORN) for the following reasons: 1) the term outcome in ORN correctly denotes the quality (loss/gain) and quantity (large/small) of the outcome event that has a reinforcement value, 2) the term error in ERN and fERN may only be attributable for error-related paradigms, 3) the term MFN indicates the brain area of its origin (medial frontal area) but not the attributable function, and 4) the term feedback in FRN and fERN is a general term that may denote both error and outcome. Similarities and differences between these two negativities (i.e. ERN and ORN) are well described [18, 19].
Since the report by Gehring & Willoughby [15], who maintained that the negativity in the gambling paradigm was specific to the loss/gain dimension and not related to the error/correct dimension, several studies have examined the sensitivity and functional significance of the ORN in gambling tasks. For example, Nieuwenhuis et al. [19] used two experiments (emphasizing either loss/gain or error/correct dimension) and determined that the sensitivity of the negativity is dependent on which dimension is most salient. This phenomenon was termed context dependence. Functional magnetic resonance imaging (fMRI) of this feature elicited activations in prefrontal cortex, striatum, posterior cingulate, and inferior parietal lobule [20]. According to the context dependence hypothesis, the loss and gain (in the TCTO paradigms) were not based on the outcome of the chosen amount but rather on its ‘relative’ outcome compared to the other unchosen or alternative amount(s) [21]. For example, when 10 is chosen (between 10 and 50) and the Chosen Outcome Stimuli (COS) is +10 (a gain of 10), and the outcome of the unchosen Alternative Outcome Stimuli (AOS) is +50 (a gain of 50), the relative or ‘net’ outcome is −40 (a loss of 40); on the other hand, if the COS is −10 and the AOS is −50, then the net outcome is +40 (a gain of 40). This phenomenon of ‘net-loss’ and ‘net-gain’ was evident even for the neutral (no loss and no gain) COS which could elicit an ORN as large as that elicited by a negative COS, and thus the ORN was thought to reflect the binary evaluation of resultant good versus bad outcomes [16, 17]. Yeung & Sanfey [22] reported that the ORN was found to be greater after losses than after gains but it was not significantly different between higher and lower amounts. Toyomaki & Murohashi [23] made an observation that the ORN elicited for the loss and neutral was larger than that of the gain condition, and the ORN was not affected by the magnitude of the bet. Interestingly, Yeung et al. [24] elicited ORNs in simple gambling tasks even when the participants made no active choices and made no overt actions. Further, Donkers et al. [25], using a simple slot-machine task, elicited the ORN for the subjective experience of loss and gain in the absence of active selection of choices. Masaki et al. [26] found that the interplay of preceding outcome and current choice influenced the ORN. They reported that the ORN amplitude was larger when the preceding outcome was gain and the current choice was 50 Yen (out of 50 and 10 Yen). Using a passive outcome paradigm, Potts et al. [27] found that the ORN trough was more negative (deeper) for the ‘unpredicted no-reward’ condition than the ‘predicted no-reward’ and ‘predicted reward’ conditions.
Apart from ORN, the P3 component of the ERP has also been studied to analyze whether this positivity is sensitive to valence (loss/gain) and amount (small or large). As previously discussed, we propose to term this positivity as Outcome-related Positivity (ORP). ORP can be defined as a large positivity occurring between 275-700 ms in response to outcome stimuli usually presented in gambling tasks. Very few studies have examined the ORP and ORN together. Yeung & Sanfey [22] reported that the ORP was sensitive to reward amount but insensitive to reward valence (with the ORN showing the opposite pattern), apart from the finding that the ORP (but not the ORN) showed sensitivity to the reward value of alternative outcomes. Apart from the finding that the peak-to-peak ORN amplitude of loss and neutral conditions were significantly larger than that of win conditions, Toyomaki & Murohashi [28] reported two important observations on ORP to imply that ORP was sensitive to both the quality (loss/gain) and quantity (larger/smaller) of the bet: 1) The ORP peak amplitudes of win conditions were larger than those of lose and neutral conditions, and 2) ORP peak amplitude of the 500 Yen condition was larger than those of 10 and 100 Yen conditions. Despite these prominent studies, the functional nature of ORP (in terms of quality and quantity of outcomes) is still unclear, maybe due to the paucity of studies, as the gambling paradigm is relatively new. On the other hand, a similar component in an error paradigm, called the error positivity (Pe), has been relatively well studied [29]. Pe is shown to reflect conscious recognition and motivational significance of the error in choice-reaction paradigms [29, 30]. On the other hand, the positivity in gambling paradigms (ORP) is considered to index the subjective evaluation of the magnitude of outcome in gambling tasks [22, 28]. However, the functional significance of ORP has not yet been validated by diverse gambling paradigms.
The nature, sensitivity and functional significance of outcome-related ERP components (specifically relating to the loss/gain dimension) have not yet been unequivocally established, perhaps because of the following reasons: 1) there has been no study that has used a gambling task to measure the loss/gain dimension without the confound of the error/correct dimension, 2) the sample size in general has been very small in reported studies, and 3) the gender effect in evaluative processing has not been analyzed in detail, although gender has considerable influence on behavioral and electrophysiological variables; e.g., ORP has been found to be larger in females than in males [31]. The present study has taken all of these issues into consideration.
Further, it is of interest to study aspects of impulsivity in the context of behavioral and ERP measures in a gambling paradigm, as it has already been shown in the error-related paradigms that the amplitude of the negative (Ne) and/or positive (Pe) component was sensitive to the level of impulsivity [13, 32-34]. Using a gambling task, a few studies have examined impulsivity related measures. For example, Gehring & Willoughby [15] showed the correspondence between risk-taking behavior and outcome processing in their finding on ORN (MFN) that the choices made after losses were riskier and were associated with greater loss-related activity than choices made after gains. Similarly, Yeung & Sanfey [22] reported that individual differences in the amplitude of the ORN correlated with individual differences in risk-taking behavior observed after monetary losses, whereas individual differences in ORP amplitude were related to behavioral adjustments observed in response to alternative or unchosen outcomes.
The main aim of the current study is to analyze ORN and ORP components of a single outcome gambling task (without the complexity and confound of the error/correct aspect) in the context of several key factors/dimensions, viz., loss/gain, 50/10, gender, impulsivity and behavioral measures. Our study therefore has been designed with the following objectives: 1) to analyze the ORN and ORP components in the context of valence (loss/gain) and amount (50/10) of outcomes, 2) to see the areas of neural activity (in terms of topography of surface potentials and current density) during different task conditions, 3) to analyze the behavioral and impulsivity variables that may be correlated with ORN and ORP, and 4) to evaluate gender differences, if any, in the ERP waveforms, topography, current density, and behavioral/impulsivity measures. Based on the previous findings and views, the hypotheses of the present study were four-fold: 1) the gain conditions will produce higher amplitude and shorter latency than the loss conditions in ORN and ORP components, 2) the larger amount will produce higher amplitude than the smaller amount in ORN and ORP components, 3) the higher the impulsivity related scores, the lower the amplitude and the shorter the latency of ORN and ORP components, 4) there will be gender differences while processing the quality and quantity of outcomes in ORN and ORP components, as well as in the impulsivity/behavioral measures. In the following sections, the terms ORN and ORP will, wherever appropriate, replace the terms N2 and P3 respectively. Further, the present study also examined the view that the loss and gain are mediated by separate and distinct brain regions, apart from the common areas associated with the reward circuitry [20]. As this study involved both surface potential and current density measures in each gender, it was expected to shed light on the understanding of gender differences with regard to the neurocognitive correlates of monetary loss and gain and of impulsivity.
2. Materials and Methods
2.1. Participants
The sample consisted of 50 healthy volunteers (25 males and 25 females) within the age range of 18-25 years. The participants were recruited through advertisements, and the study was conducted at SUNY Downstate Medical Center at Brooklyn, NY, USA. Individuals with hearing or visual impairment, severe medical (e.g., liver diseases, recent surgery, chronic pain conditions that may interfere with the performance of the task), neurological (e.g., dementia, delirium, head injury, degenerative diseases, cerebrovascular diseases/conditions), psychiatric illnesses (e.g., schizophrenia, depression, bipolar disorders, other psychoses) or drug/alcohol dependence were excluded from the study. Subjects who had major childhood behavioral disorders (e.g., ADHD, conduct disorder, oppositional defiant disorder, and autism) were also excluded from the study. Individuals who had a family history of major psychiatric illnesses and alcohol/substance dependence were also excluded. Those who at the time of the study were on any medication that could affect the central nervous system were not included in this study. The data of those individuals with severe cognitive deficits based on their score on the mini mental state examination (MMSE) [35] were not used for this study. Experimental procedures and ethical guidelines were in accordance with approval from the institutional review board (IRB).
2.2. The gambling task
The Single Outcome Gambling task used in the study is illustrated in Fig. 1. At the start of each trial, a choice stimulus (CS) with two numbers 10 (left box) and 50 (right box), corresponding to equivalent monetary value in US cents, was displayed for 800 ms. The subject was instructed to select one number by pressing the left button for ‘10’ or the right button for ‘50’. The outcome stimulus (OS) appeared 700 ms after the CS offset and lasted 800 ms. The OS comprised the selected number inside a green box (to indicate a gain) or a red box (to indicate a loss). Thus, there were four possible outcomes: namely, gain 50 (+50), loss 50 (−50), gain 10 (+10), and loss 10 (−10). The subject had to respond by selecting either 10¢ or 50¢ within 1000 ms of CS onset. The OS would not appear if the subject did not respond/select within the specified time (1000 ms), and the next trial would commence. While the occurrence of loss (in red) or gain (in green) in the OS was maintained at equal probability (50%), the order of appearance was pseudo-randomized. The choice was always between 10 and 50 on every trial; 10 always occurred on the left and 50 on the right. The subjects were not made aware of the probability of loss/gain or sequence of the task prior to the experiment. There were a total of 172 trials and the inter-trial interval was 3000 ms throughout the experiment. The task was presented in two blocks with each block (with 86 trials) lasting for 4 minutes; the procedure was identical in both blocks. At the end of each block, the status of overall ‘loss’ or ‘gain’ for the entire block was displayed on the monitor screen. The next block was started by the operator when the subject was ready. At the end of the experiment, all the participants actually received the monetary rewards which they had accrued.
Fig. 1.
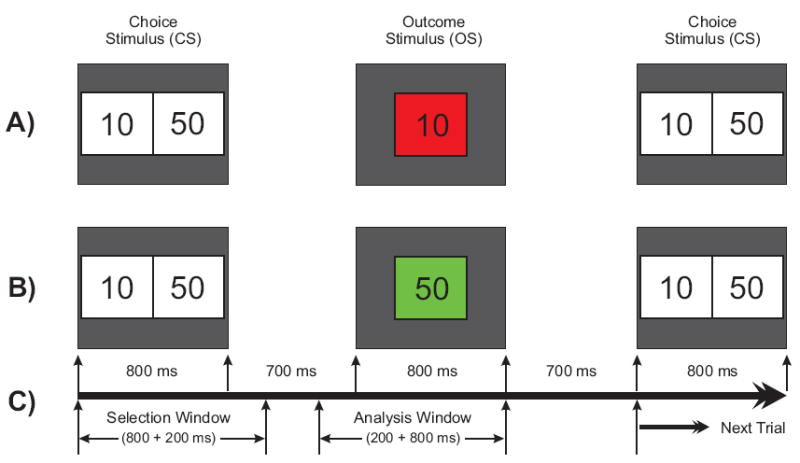
Schematic illustration of the gambling task used in this experiment. One of the two numbers (10 or 50) in the choice stimulus (800 ms) is to be selected by the subject. The selected amount appears as the outcome stimulus (800 ms) either in red (to indicate a loss) or in green (to indicate a gain). A) a typical trial showing a loss of 10 in red box; B) another trial having a gain of 50 in green box; and C) the time duration for the task events: the selection window (1000 ms) wherein the subject selects either of the numbers and the analysis window (200 ms prestimulus + 800 ms poststimulus) represents the time segment that was used for the ERP analysis.
2.3. Measures of impulsivity
All the scores that were derived from impulsivity measures are listed in Table 1. There were two impulsivity measures used in the study: 1) Barratt impulsiveness scale, version 11 (BIS-11) [36, 37], a self-rated measure that assesses trait-related impulsivity, and 2) task-related behavioral (TRB) scores as derived from the performance of the gambling task. The BIS-11 consists of thirty items yielding a total score, and additional scores for three subcategories: motor impulsivity (acting without thinking), cognitive impulsivity (making decisions quickly), and non-planning (lack of prior planning or of future orientation). The TRB scores were of 3 categories: 1) reaction time for the task conditions and responses, 2) number of impulsive responses (IR), viz. IR-1 (selecting 50 after a single event of loss) and IR-2 (selecting 50 after two consecutive events of loss), and 3) selection frequency that represents the number of times a particular amount (10 or 50) was chosen after a losing or gaining trend in the previous 2 to 4 trials. The gaining and losing trends were computed based on the resultant outcome of the cumulative account of the preceding outcomes. For example, if the previous three outcomes were −10, −10, and +50, then the trend was considered to be a gain (of 30¢), whereas if the previous three outcomes were +10, +10, and −50 then the trend would be considered as a loss (of 30¢).
Table 1.
Comparison of impulsivity scores between male (N=25) and female (N=25) groups. Mean, standard deviation (SD), t-value and p-value are shown.
| Variables | Male | Female | t | p | ||
|---|---|---|---|---|---|---|
| Mean | SD | Mean | SD | |||
| BIS Total score | 60.00 | 11.46 | 59.28 | 9.34 | 0.24 | 0.8102 |
| BIS Non-planning | 22.04 | 4.20 | 21.84 | 4.45 | 0.16 | 0.8712 |
| BIS Motor Impulsivity | 23.42 | 7.44 | 22.28 | 4.43 | 0.65 | 0.5171 |
| BIS Cognitive Impulsivity | 14.54 | 3.11 | 15.28 | 3.40 | -0.79 | 0.4318 |
| Number of Impulsive Responses-1 (IR-1) | 38.44 | 3.54 | 36.24 | 4.99 | 1.80 | 0.0785 |
| Number of Impulsive Responses-2 (IR-2) | 18.88 | 5.75 | 17.56 | 4.70 | 0.89 | 0.3788 |
| SF for 50 after a losing trend of previous 2 trials | 30.96 | 8.42 | 28.16 | 6.67 | 1.30 | 0.1988 |
| SF for 10 after a losing trend of previous 2 trials | 27.16 | 6.77 | 26.12 | 7.95 | 0.50 | 0.6207 |
| SF for 50 after a gaining trend of previous 2 trials | 49.52 | 12.10 | 50.36 | 8.25 | -0.29 | 0.7755 |
| SF for 10 after a gaining trend of previous 2 trials | 49.04 | 13.04 | 46.20 | 7.34 | 0.95 | 0.3474 |
| SF for 50 after a losing trend of previous 3 trials | 38.12 | 11.00 | 36.80 | 7.38 | 0.50 | 0.6205 |
| SF for 10 after a losing trend of previous 3 trials | 37.12 | 10.22 | 34.64 | 11.15 | 0.82 | 0.4164 |
| SF for 50 after a gaining trend of previous 3 trials | 41.84 | 8.51 | 41.20 | 6.60 | 0.30 | 0.7676 |
| SF for 10 after a gaining trend of previous 3 trials | 38.60 | 11.29 | 37.20 | 6.94 | 0.53 | 0.5997 |
| SF for 50 after a losing trend of previous 4 trials | 32.80 | 9.61 | 31.84 | 6.72 | 0.41 | 0.6840 |
| SF for 10 after a losing trend of previous 4 trials | 31.08 | 8.84 | 27.40 | 9.79 | 1.40 | 0.1695 |
| SF for 50 after a gaining trend of previous 4 trials | 46.68 | 11.14 | 45.76 | 8.01 | 0.34 | 0.7388 |
| SF for 10 after a gaining trend of previous 4 trials | 44.12 | 13.44 | 43.84 | 8.23 | 0.09 | 0.9296 |
| RT following −50 trials | 334.74 | 89.16 | 369.45 | 84.39 | -1.41 | 0.1638 |
| RT following −10 trials | 327.93 | 79.02 | 379.23 | 82.40 | -2.25 | 0.0293β |
| RT following +50 trials | 338.77 | 80.87 | 373.80 | 79.52 | -1.54 | 0.1291 |
| RT following +10 trials | 339.27 | 73.53 | 371.63 | 75.55 | -1.54 | 0.1314 |
| RT following loss trials (−50 and −10) | 332.37 | 82.35 | 375.38 | 80.32 | -1.87 | 0.0677 |
| RT following gain trials (+50 and +10) | 338.38 | 75.57 | 372.65 | 76.76 | -1.59 | 0.1183 |
| RT for trials of higher amount (−50 and +50) | 336.17 | 83.26 | 372.16 | 80.71 | -1.55 | 0.1273 |
| RT for trials of lower amount (−10 and +10) | 333.78 | 75.40 | 375.91 | 77.12 | -1.95 | 0.0567 |
| RT for Impulsive Responses-1 (IR-1) | 336.58 | 79.82 | 380.46 | 104.21 | -1.67 | 0.1012 |
| RT for Impulsive Responses-2 (IR-2) | 341.78 | 77.79 | 381.55 | 84.56 | -1.73 | 0.0899 |
The significance was lost after Bonferronni correction for multiple testing; BIS, Barratt Impulsivity Scale; IR-1, Impulsive response-1 (selecting 50 after a single event of loss); IR-2, Impulsive response-1 (selecting 50 after two consecutive events of loss); RT, Reaction time; SF, Selection frequency (refers to the number of times a particular amount was selected)
2.4. EEG data acquisition and signal analysis
The subjects were comfortably seated in front of the computer monitor placed one meter away. EEG was recorded on a Neuroscan system (Version 4.1) using a 61-channel electrode cap which included 19 electrodes of the 10-20 International System and 42 additional electrodes (see Fig. 2). The electrodes were referenced to the tip of the nose and the ground electrode was at the forehead (i.e. 2 cm above the nasion). A supraorbital vertical lead and a horizontal lead on the external canthus of the left eye recorded the electrooculogram (EOG) in order to detect the eye movements. Electrode impedance was maintained below 5 kΩ. The EEG signals were recorded continuously with a bandpass at 0.02–100 Hz and amplified 10,000 times using a set of amplifiers (Sensorium, Charlotte, VT). The data were collected at sampling rates of either 256 Hz or 512 Hz, and were resampled at 256 Hz for the sake of uniformity in signal analysis. The continuous EEG was segmented into epochs of 100 ms pre-stimulus (for baseline correction) plus 800 ms post-stimulus of the outcome stimuli. Digital low-pass filtering was performed at 32 Hz for ‘peak-picking’ and at 16 Hz for the display of waveforms. All segments exceeding ±75 μV threshold were rejected as artifacts. The percentage of trials exceeded the threshold of 75 μV ranged from 4% to 12% with the average of approximately 5%. Only those ERP data that had a minimum of 15 trials in each of the conditions (−50, −10, +50, +10) were selected for the analyses. The grand averaged ERPs of each individual were further screened visually for further artifact rejection. The averaged waveforms of two male subjects were excluded from the study based on the peak activity at FP1 and FP2. The trials with EOG activity were removed rather than corrected using the EOG reduction algorithms for two reasons: 1) these algorithms sometimes introduce artifactual data, principally because the eye recording does not accurately represent the actual EOG effect on the EEG, and 2) there were very few trials that had EOG contamination. Further, those averaged waveforms either with ‘atypical’ morphology of ERP waves/components (e.g., flat P3 or P2 larger than P3) or with suppressed/flat response (e.g., very low voltage ERP components shaped like uniform sine waves of about 2-4 μV in amplitude) were also rejected from further analysis. Only the trials with proper response (i.e. button press within the selection window) were averaged.
Fig. 2.
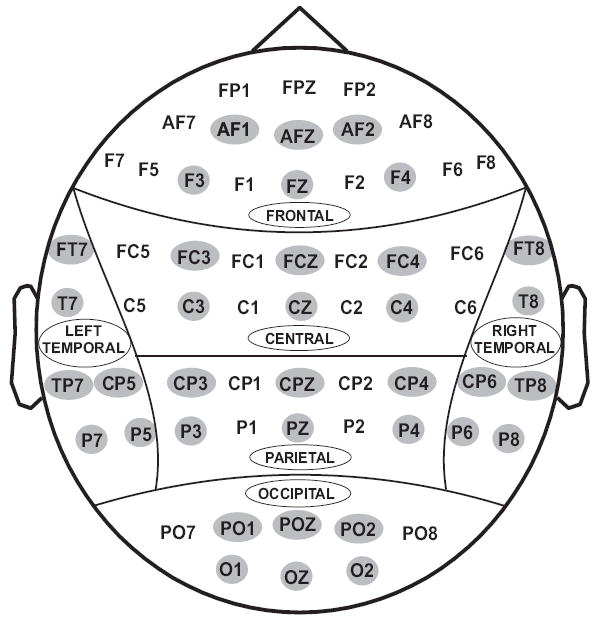
Sixty one electrodes as recorded from the surface of the scalp. For statistical analyses, only 36 electrodes (as highlighted) were selected to represent 6 electrodes in 6 regions of the brain viz., frontal, central, parietal, occipital, left-temporal and right-temporal.
The data analysis window or the “outcome window” (1500 ms) began with the onset of OS, as the objective of the study is to analyze the outcome-related potentials of the ERPs. The peaks and troughs of ERP components were marked using a semiautomatic peak-picking program wherein the maximum positive or negative activity is ‘picked’ automatically within the manually specified time window. The ORP amplitude was measured as the voltage difference from the pre-stimulus baseline to the largest positive going peak in the latency window 275–700 ms after the stimulus onset, whereas the ORN was measured as a baseline-trough within post-stimulus 200–275 ms (Fig. 3). Although some researchers have measured ORN as a peak-to-trough (P2-N2) amplitude in the context where the ORP is so much stronger than the ORN component that the ORN component is subsumed and not apparent in the ERP signal, as in our study and in Toyomaki & Murohashi’s [28] study, we found that peak-to-trough measurement was not feasible. While band-pass filtering was an option for restoring the ORN component, the obvious difference between the conditions disappeared when it was implemented, perhaps because the ORN involves a wide range of frequencies. While the filter was used for the display of topography, the statistical analysis involved the actual ‘peak-picked’ values. Although the entire experiment consisted of two identical blocks, the analysis was done on all trials by combining the trials from both blocks. The statistical analyses were performed on the amplitude and latency data of ORN and ORP components.
Fig. 3.
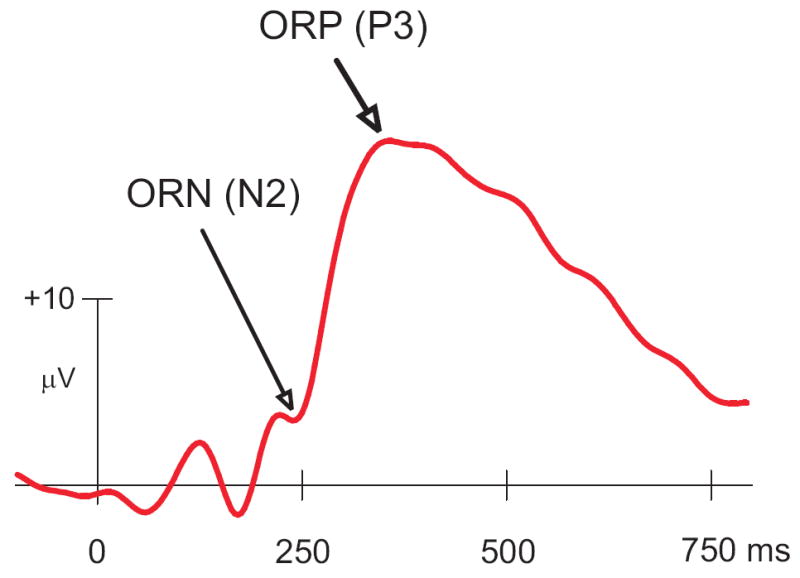
Typical ERP waveform at CZ electrode as produced by a SOG task. The ORN component that occurs approximately between 200 ms and 275 ms and ORP component that lies approximately between 275 ms and 700 ms are considered to be important in the evaluative processes during loss and gain.
2.5. Functional mapping using LORETA
The current density maps for the ERP data were created using LORETA. LORETA is a functional imaging method based on certain electrophysiological and neuroanatomical constraints as described by Pascual-Marqui et al. [38, 39]. The cortex has been modeled as a collection of volume elements (voxels) in the digitized Talairach atlas provided by the Brain Imaging Center, Montreal Neurological Institute. LORETA algorithm solves the inverse problem by assuming related orientations and strengths of neighboring neuronal sources (represented by adjacent voxels). The technical details of LORETA are given at http://www.unizh.ch/keyinst/NewLORETA/LORETA01.htm. The LORETA has been widely used as an efficient tool for functional mapping, since it is consistent with physiology and localization [38-40]. In the present study, the current density maps (in amperes per square meter, A/m2) were created for the grand mean data of each gender separately. The time frame of LORETA images for each condition was selected based on the peak (current density) activity in ORN and ORP components. Statistical analyses involved a voxel-wise Statistical non-Parametric Mapping (SnPM) in order to determine significant regional statistical differences in current density between two groups or conditions. The SnPM method calculates the t-values using the permutation approach and offers the exact (i.e., corrected for multiple comparisons) critical t-values [41] for each voxel. These values are calculated via a randomization method [42], and the SnPM approach controls for Type I error [43]. Since numerous voxels in each comparison were statistically significant, only few of the highly significant ones have been reported in the study.
2.6. Statistical analysis of ERP data
Only 36 electrodes that represented 6 scalp regions were selected for the statistical analyses (see Fig. 2). The ERP data were analyzed by performing a linear mixed model of the Analysis of Variance (ANOVA) using the Statistical Analysis System (SAS, version 9.2) (SAS Institute Inc., NC 27513, USA). The values with ±4 standard deviations were considered as outliers and removed from the data before the analysis. The covariance structure used in the model was ‘Compound Symmetry’ which has a constant variance and constant covariance. The model included five factors as fixed effects: Valence (loss, gain), Amount (50¢, 10¢), Region (frontal, central, parietal, occipital, left-temporal, and right-temporal), Electrode (6 electrodes) as within-subjects factors, and Gender as a between-subjects factor. We treated electrodes as nested within region as we were interested in the “region” effects but not in the individual “electrode” effects. The pairwise comparisons for each main and interaction effect was calculated using the least means square values.
The BIS and TRB variables were compared across genders using t-tests. The correlations between ERP variables and Behavioral measures were analyzed in a 3-step procedure: 1) Factor analysis, using principal component analysis and varimax rotation, was performed to reduce the ERP variables (N = 144) as well as the TRB variables (N = 24) into a few specific factors; 2) Pearson (bivariate) correlations were performed to analyze the relationship between behavioral factors and ERP factors; and 3) Bonferroni corrections were applied for multiple testing across factors. ERP variables for the factor analysis comprised of nine electrode sites (F3, FZ, F4, C3, CZ, C4, P3, PZ, P4), four conditions (+50, +10, −50, −10), two components (ORN, ORP), and two measures (amplitude, latency). The optimal number of factors was determined based on the shape of the scree plots (i.e. components lie on the steep slope). However, factor analysis was not done on BIS scores as they were only a few and already factorized as the subcategories were factorized in the original work [36, 37].
3. Results
3.1. Behavioral data
Table 1 shows the comparison of behavioral measures across gender using t-tests. There was no significant difference between males and females in any of the variables after correcting for multiple testing using the Bonferroni method. However, before this correction, reaction time for the trials following −10 trials was significantly (p = 0.0293) longer in females. Females in general had longer reaction time than males for many variables, although they were not statistically significant.
The factors obtained from TRB and ERP variables are explained in Table 2. The first factor of the TRB variables represented all the reaction time variables, while the second and third factors accounted for the selection frequency for 50 and 10 respectively following losing trends. On the other hand, the first ERP factor involved amplitudes of ORP and ORN components during both loss and gain conditions, the second ERP factor entailed latencies of ORP during +50 and +10 conditions as well as latencies of ORN during both loss and gain conditions, and the third ERP factor represented latencies of ORP during the −50 condition.
Table 2.
Description of factors obtained from TRB variables and ERP variables. Eigen value, percentage of variance accounted for, and the detail and the number (N) of variables that had significantly high positive (r ≥ +0.5) and negative (r ≤ −0.5) loadings with the factor have been listed.
| Factors | Eigen Value | Accounted variance (in %) | Variables with significantly high positive loadings (N) | Variables with significantly high negative loadings (N) |
|---|---|---|---|---|
| TRB Factor 1 | 10.69 | 41.11 | All the RT variables (10) | None |
| TRB Factor 2 | 6.73 | 25.87 | Number of times selecting 50 following losing trends/trials (5) | None |
| TRB Factor 3 | 2.89 | 11.13 | Number of times selecting 10 following losing trends (3) | None |
| ERP Factor 1 | 39.16 | 27.19 | Amplitudes of ORN and ORP components during all outcomes representing all (nine) scalp regions (66) | Latencies of ORP during +50 and +10 conditions (13) |
| ERP Factor 2 | 24.39 | 16.94 | Latencies of ORN during both loss and gain conditions (36) | None |
| ERP Factor 3 | 11.83 | 8.22 | Latencies of ORP during −50 condition (7) | None |
The correlations between the behavioral factors/variables and the ERP factors are shown in Table 3. After correcting for multiple testing, the only significance (p < 0.05) observed was a positive correlation between the first factor of the ERP (i.e. primarily the amplitudes of ORN and ORP components) and the first factor of TRB measures (i.e. the reaction time variables). Four originally significant correlations lost significance due to Bonferroni corrections: 1) negative correlation between ERP factor 3 (i.e. latencies of ORP during −50 condition and TRB factor 1; 2) negative correlation between ERP factor 1 and motor impulsivity of BIS, 3) negative correlation between ERP factor 2 and Motor impulsivity; and 4) positive correlation between ERP factor 3 and cognitive impulsivity of BIS.
Table 3.
Correlation between ERP factors and Impulsivity factors are shown. Correlation coefficient (r, top number within the cell) and the level of significance (p, bottom number within the cell) before correcting for multiple testing. The significant correlations (highlighted in bold font) that remained significant after Bonferroni correction has been marked with an asterisk and the correlations that lost significance have been indicated with the symbol ‘β’. The minus sign (−) indicates a negative correlation.
| TRB Factors | BIS variables | |||||
|---|---|---|---|---|---|---|
| Factor 1 | Factor 2 | Factor 3 | Non-planning | Motor Impulsivity | Cognitive Impulsivity | |
| ERP Factor 1 |
0.3636 0.0047* |
−0.0257 0.4296 |
0.1312 0.1820 |
−0.0909 0.2672 |
−0.2380 0.0498β |
−0.1052 0.2359 |
| ERP Factor 2 | −0.1088 0.2260 |
−0.0608 0.3376 |
−0.1284 0.1871 |
0.0047 0.4873 |
−0.3141 0.0140β |
−0.0656 0.3271 |
| ERP Factor 3 |
−0.2472 0.0418β |
0.0064 0.4823 |
0.1789 0.1069 |
0.2048 0.0790 |
−0.1117 0.2223 |
0.2778 0.0266β |
p < 0.05 after Bonferroni correction
The significance was lost after Bonferronni correction
3.2. ERP waveforms
The typical ERP waveform in a gambling paradigm is shown in Fig. 3. The task used in this study also produced similar waveforms as shown in Fig. 4. It can be observed that males have produced the highest ORP amplitudes for the amount 50¢ (+50 and −50) in the central region (at CZ electrode) while females have the highest ORP amplitudes for the outcome of gain (+50 and +10) in the same region. The ORN amplitude showed a maximum difference between +50 and −10 waveforms in both genders. However, the gender differences in the waveforms have been more obvious in ORP amplitude. The females had higher ORP amplitude for the gain conditions (+50 and +10) at central and parietal sites as well as for the loss conditions (−50 and −10) at parietal site.
Fig. 4.

The ERP waveforms showing the comparison across genders (left panel) and conditions (right panel). Both genders had the highest ORP amplitude for the larger gain (+50). Males (M) had higher ORP amplitudes for the higher amounts (+50 and −50) regardless of valence while females (F) had higher ORP amplitudes for the gain (+50 and +10), mainly reflected at FCZ and CZ electrodes.
In order to (visually) amplify the difference among conditions, difference waveforms were created by subtracting the waveform of each condition from the mean waveform of all four conditions (Fig. 5). These waveforms showed that both male and female subjects had maximum separation among conditions at the time window of 200–400 ms wherein both ORN and ORP have their peaks. However, the separation of positive/gain outcomes from the negative/loss ones is more robust in females. After about 400 ms, the separation (that lasted until about 800 ms) is more obvious for the amount, especially in males, although this phenomenon has not been statistically validated here as the current study mainly analyzes the ORN and ORP components.
Fig. 5.

The waveforms represent the difference waves (i.e. deviation from the mean) of all four conditions. At the time window of 200–400 ms, the separation of waves is based on the valence (loss vs. gain) and is more robust in females. After 400 ms, this separation is based on the amount (50¢ vs. 10¢) and is more robust in males. The vertical lines represent the ORN and ORP peaks (225 ms and 350 ms) respectively.
3.3. ERP measures in the mixed model
The statistical results of the mixed model ANOVA are listed in Table 4. As shown in Table 4, the Gender as a main effect is not significant. However, gender has interaction effects with Valence, Amount, and Region. While the main effects for Valence, Amount, and Region are significant in all four ERP measures, all the 2-way interactions were significant in at least two of the four measures. On the other hand, the 3-way interactions were significant in only one of the ORN measures (i.e. either ORN amplitude or ORN latency) and the ORP measures were not significant. Figure 6 illustrates the bar graphs of Bonferroni adjusted pairwise comparisons for each of the 2-way interactions for the ORN and ORP measures. In terms of Loss vs. Gain, the Gain condition produced significantly higher amplitude and shorter latency (than the Loss condition) in all four ERP measures in both males and females (1st row), in both larger and smaller Amounts (3rd row) and in all the regions (5th row). The larger Amount produced significantly higher ORN amplitude and shorter ORN latency (than the smaller amount) in males; ORP amplitudes were higher for larger Amount in both genders but ORP latencies were not significant between the Amounts (Fig. 6, 2nd row). Only the amplitudes (and not the latencies) of ORN and ORP significantly differentiated the Amounts in many of the scalp regions (Fig. 6, 6th row). No gender effect was observed in any of the scalp regions (Fig.6, 4th row).
Table 4.
The F-value, p-value, and significance level of main and interaction effects for Gender, Valence, Amount, and Region are shown. The statistical significance is marked with asterisks.
| ORN Amplitude | ORP Amplitude | ORN Latency | ORP Latency | |||||
|---|---|---|---|---|---|---|---|---|
| F | p | F | p | F | p | F | p | |
| Gender | 0.05 | 0.8203 | 3.05 | 0.0872 | 0.80 | 0.3769 | 0.26 | 0.6156 |
| Valence | 402.32 | < 0.0001*** | 254.45 | < 0.0001*** | 428.17 | < 0.0001*** | 770.95 | < 0.0001*** |
| Amount | 66.83 | < 0.0001*** | 161.39 | < 0.0001*** | 8.86 | 0.0046** | 4.21 | 0.0458* |
| Region | 116.16 | < 0.0001*** | 398.52 | < 0.0001*** | 31.17 | < 0.0001*** | 83.48 | < 0.0001*** |
| Gender × Valence | 1.45 | 0.2345 | 77.14 | < 0.0001*** | 70.76 | < 0.0001*** | 37.63 | < 0.0001*** |
| Gender × Amount | 21.22 | < 0.0001*** | 1.42 | 0.2400 | 14.03 | 0.0005*** | 2.33 | 0.1333 |
| Valence × Amount | 74.72 | < 0.0001*** | 2.48 | 0.1217 | 27.21 | < 0.0001*** | 23.15 | < 0.0001*** |
| Gender × Region | 0.76 | 0.5808 | 16.65 | < 0.0001*** | 8.33 | < 0.0001*** | 4.64 | 0.0005*** |
| Valence × Region | 6.49 | < 0.0001*** | 2.98 | 0.0124* | 4.52 | 0.0006*** | 2.60 | 0.0259* |
| Amount × Region | 3.06 | 0.0106* | 2.26 | 0.0493* | 0.40 | 0.8519 | 0.76 | 0.5762 |
| Gender × Valence × Amount | 10.38 | 0.0023** | 0.05 | 0.8222 | 0.01 | 0.9199 | 3.86 | 0.0552 |
| Gender × Valence × Region | 1.62 | 0.1563 | 1.45 | 0.2057 | 2.41 | 0.0370* | 1.78 | 0.1184 |
| Gender × Amount × Region | 0.38 | 0.8625 | 0.25 | 0.9400 | 1.82 | 0.1098 | 2.06 | 0.0714 |
| Valence × Amount × Region | 0.76 | 0.5787 | 1.07 | 0.3788 | 0.18 | 0.9701 | 1.78 | 0.1183 |
| Electrode (Region) | 9.96 | < 0.0001*** | 33.70 | < 0.0001*** | 1.48 | 0.0465* | 4.00 | < 0.0001*** |
p < 0.05
p < 0.01
p < 0.001
Fig. 6.

The bar graphs show the post-hoc pair-wise comparisons of least squares means of the ERP measures for the 2-way interaction effects: 1) Gender × Valence, 2) Gender × Amount, 3) Valence × Amount, 4) Gender × Region, 5) Valence × Region, and 6) Amount × Region. The Bonferroni corrected significance level is marked with asterisks (*p < 0.05, **p < 0.01, and ***p < 0.001). The error bars represent 1 Standard Error (SE). Refer the text for detailed explanation.
3.4. Topography of the ERP amplitude and current density
The topography at peak amplitude of the ORN and ORP components are illustrated in Fig. 7. The ORN activity of females showed more negativity (or deeper troughs) than males. Furthermore, the locations of peak activities were topographically different across gender. In the ORP component, females showed higher amplitudes than males in all conditions. Females showed a parietal focus in all conditions while males had a fronto-central peak in loss conditions and a centro-parietal peak in gain conditions.
Fig. 7.

The topographic maps of ORN and ORP components at peak amplitudes (in μV). ORN component has been plotted after performing a high-pass filter at 2 Hz (only for the display of topography). The surface potentials (Panel A) and the Z-score (in numerical units) of these potentials (Panel B) are shown for both ORN and ORP components. The Z-scores, calculated across 61 electrodes for each map separately, elicit the shape of the activity by masking the amplitude differences. Therefore, the values in the color scale of Z-score maps may represent different amplitude values in each map. These maps were generated at the peak of following electrodes: 1) ORN for −50 and −10 conditions at FZ; 2) ORN for +50 and +10 conditions at CZ; 3) ORP for −50 and −10 conditions at CZ; and 4) ORP (for +50 and +10 conditions) at PZ.
LORETA images for the ORN and ORP components at the ERP peak amplitudes in male and female groups are shown in Fig. 8. During the ORN activity, the maximal current density (or source) during loss was found in medial frontal gyrus (Brodmann Area, BA 10, 11) and anterior cingulate cortex (BA 32). The gain condition, on the other hand, showed maximal activity in posterior cingulate cortex (BA 31) in both males and females; females activated both anterior and posterior areas during loss and gain while males activated either anterior (for loss) or posterior areas (for gain). In the current density during the ORP activity, while males had significantly higher activity in medial frontal gyrus (BA 10, 11) and anterior cingulate cortex (BA 32) for the larger amounts of loss and gain (i.e. +50 and −50) than for the smaller amounts (+10 and −10), females did not show any significant difference. While females showed maximum current density in anterior cingulate (BA 32), medial frontal gyrus (BA 10, 11), and orbital gyrus (BA 11), males had the highest activity in posterior cingulate cortex (BA 30, 31) and precuneous (BA 23, occipital lobe). Although maximum current density during ORP activity was different across genders (i.e. anterior versus posterior), both anterior and posterior areas were activated in all conditions. Topography of both ERP amplitude and current density also shared a common feature: ORN during the loss was associated with greater anterior activation (especially in males), while the ORN during the gain was associated with greater posterior activation.
Fig. 8.

LORETA images for the ORN and ORP components at the peak amplitudes in male and female groups. During the ORN activity, the maximum activity for the loss is in medial frontal areas while the maximum activity for the gain is in medial posterior areas in both males and females, although females activate both anterior as well as posterior areas in all conditions. During the ORP activity, females had the maximum activity in anterior areas whereas males had the highest activity in posterior areas. The axial slices differ between males and females because they were derived from the maximum current density for each gender. The color intensity scale shows current density in ampere per square meter (A/m2).
The voxel-by-voxel t-statistics comparisons between genders and outcomes identified several brain regions (see Fig. 9). Gender differences were more evident in −50 and +50 conditions, especially for the ORP component. In the ORP component during −50 and +50 conditions, females activated right temporal pole (BA-38) more than males, while males had increased activity at bilateral occipital areas (BA-17 & 18). In the ORN activity during the −50 condition, females had increased acticity at bilateral superior frontal gyrus (BA-6) than males. During the +50 condition, males had increased ORN activity at left angular gyrus (BA-39) while females had increased activity at right angular gyrus and supramarginal gyrus (BA-39 & 40) and left paralimbic temporal area (BA-38). Robust diffences in valence (loss vs. gain) were also found. In both male and female groups, loss had more anterior activation and gain had more posterior (parietal) activation in ORN as well as ORP components. In terms of differential processing for amount (50 vs. 10), increased frontal activity of the 50 condition (relative to the 10 condition) was observed only in females.
Fig. 9.

LORETA images of voxel-by-voxel t-statistics comparisons between genders and outcomes for the ORN (left column) and ORP (right column). Five views are shown for each comparison: 1) left view of the left hemisphere, 2) right view of the left hemisphere, 3) right view of the right hemisphere, 4) left view of the right hemisphere, and 5) inferior view of both hemispheres. Statistically significant increase and decrease of activity (in the voxels) in the first versus the second of the comparison are represented in red and blue respectively. All the t-values were subjected to Holmes’ correction for multiple comparisons.
3.5. Summary of Gender differences
There were no gender differences in behavioral and/or impulsivity measures. Statistically, the only statistically significant gender difference was elicited by the ORN component in terms of differential processing of amount (i.e. larger vs. smaller): Males had higher ORN amplitude and shorter ORN latency for the higher amount than for the lower amount while females did not differ in terms of amounts (Fig. 6, 2nd row). On the other hand, prominent gender differences were observed in the waveforms and topography of ORN and ORP: 1) females produced higher amplitudes than males, especially in the gain condition (Figs. 4 & 7); 2) the peak ORP amplitude was located at the central region in males whereas females had the peak amplitude in the parietal area (Fig. 7); and 3), the separation of ERP activity (between loss and gain conditions) were more well-defined in females than in males at around 300 ms, while after 400 ms the separation was more well-defined in males than females (Fig. 5).
Further, as shown in Figs. 8 & 9, major gender differences observed in LORETA were: 1) during both loss and gain conditions, females activated both anterior and posterior areas while males activated either anterior or posterior areas, 2) differences across task conditions in the ORP activity were observed in males (the larger amounts of loss and gain (i.e. +50 and −50) had significantly higher activity in medial frontal gyrus (BA 10, 11) and anterior cingulate cortex (BA 32) as compared to the smaller amounts (+10 and −10) but not in females, and 3) Specific brain areas have been activated during the comparisons within gender, valence, and amount.
4. Discussion
The main aim of the present study was to analyze ORN and ORP components of a single outcome gambling task (without the complexity and confound of the error/correct aspect) in the context of several key factors/dimensions, viz., valence, amount, gender, impulsivity and behavioral measures. Since our study has used a “single-outcome” gambling task (SOG), a novel paradigm, it is primarily exploratory in nature. While findings related to valence (loss/gain) and amount (50/10) dimensions (including the morphology and topography of ORN and ORP) are possibly unique to the SOG paradigm, comparisons are also made with previous findings of “two-outcome” tasks in order to elicit paradigm-specific features in the outcome related ERP components.
The major findings of the present study were as follows:
The monetary gain (as compared to the loss) produced higher amplitudes and shorter latencies in both ORN and ORP components (Figs. 3, 4, 6, 7);
The difference (from mean) waveforms indicated that while the earlier time window (200-400 ms) based on valence (loss vs. gain) was more robust in females, the later window (after 400 ms) based on amount (50 vs. 10) was more evident in males (Fig. 5);
The larger amount (i.e. 50) produced significantly higher amplitudes than the smaller amount (i.e. 10) in both genders for the ORP, but only in males for the ORN (Fig. 6, 2nd row);
The loss-related anterior activity and gain-related posterior activity has been observed in surface potential topography (Fig. 7) and confirmed by the LORETA images (Fig. 8);
There were no gender differences observed in any of the behavioral/impulsivity scores (Table 1); and
There was a significant positive correlation between an ERP factor (representing 66 variables of ORN and ORP amplitudes and 13 variables of ORP latencies) and a factor of TRB measures (comprised of 10 variables of reaction times), apart from several trends of possible relationship among ERP factors and behavioral/impulsivity factors (Table 3).
4.1. Morphology and topography of the ORN and ORP
As the waveforms in Fig. 4 indicate, the ORN components in the current study have followed the same order as shown by Gehring & Willoughby [15] and by Nieuwenhuis et al [19] and the morphology of ORN and ORP components in our study matched Toyomaki & Murohashi’s [28] study. Although many studies that have used gambling tasks measured/reported the negativity at FCZ [15, 19] and the positivity at PZ [22, 28], we found that both ORN and ORP were maximal at the CZ electrode. The topography of ORN and ORP components (see Fig. 7) has shown interesting differences. The finding that loss conditions were more anteriorized than gain conditions suggests that the loss-related processing may be more involved with the frontal lobe (especially anterior cingulate cortex) functioning than the gain processing. This is consistent with the findings from source modeling, fMRI, and single-unit recording studies that the ORN (or feedback negativity) is generated in the medial frontal cortex, and probably in the anterior cingulate cortex [cf. 44]. While the gender difference in the outcome processing is explained separately in the following section, the topographic difference for loss and gain conditions demand further explanation. Using a simple monetary gambling task, Nieuwenhuis et al. [20] reported ‘reward-sensitive activity’ in a number of brain areas that were previously implicated in reward processing, including the striatum, prefrontal cortex, posterior cingulate, and inferior parietal lobule. Since the “reward network” involves posterior areas as well, it is possible that the gain condition is mediated more by the posterior areas than by the anterior/frontal areas of this network. On the other hand, the reverse may be true for the loss condition. The functional mapping through LORETA has helped to further explain this phenomenon as discussed separately in the next section.
4.2. Functional mapping and brain activation during the loss and gain
The current density (LORETA) maps showed that ORN activity during the loss condition was marked by more activation in frontal/anterior areas than in parietal/posterior areas whereas the reverse (of anterior-posterior source activity) was true for the gain condition (see Fig. 8). The maximal current density (or source) for the loss outcome was found in medial frontal gyrus and anterior cingulate cortex. The gain outcome, on the other hand, showed maximal activity in posterior cingulate cortex and limbic lobe. Although LORETA is not sensitive to amplitude differences, the topography of both LORETA and surface potential has simultaneously confirmed the finding of ‘anterior-loss’ and ‘posterior-gain’. Therefore, as many of the studies have reported, it is possible that ORN is generated in the medial frontal cortex, and probably in the anterior cingulate [44], and that this component has been therefore termed by Gehring & Willoughby [15] as medial frontal negativity or MFN to indicate the brain region associated with this component.
The finding that the ORN separated the loss against gain (in both gender) and the ORP activity distinguished the amount 50 against 10 (in males) suggests that the ORN is more sensitive to the valence (loss-gain dimension) and ORP is more sensitive to the amount (large-small dimension). Further, the peak activity of the ORN was similar (anterior during loss and posterior during gain) across genders. Although fMRI studies differ in terms of brain regions associated with loss and gain, it is possible that there are dissociable brain systems/circuits for processing abstract reward and punishments [20] as our study has suggested. However, many of the imaging studies did not confirm our findings. For example, Yacubian et al. [45] reported that the gain-related reward delivery system was represented in the ventral striatum while the loss-related expected value and the associated prediction error was represented in the amygdala. Further imaging studies should, however, attempt to elicit specific outcome processing brain areas or network(s) involved during the levels of quality (e.g., loss and gain) and quantity (e.g., 50 and 10) of outcomes without the confound of context dependence (e.g., ‘relative’ loss and ‘relative’ gain).
4.3. Sensitivity and context dependence of the ORN
While Gehring & Willoughby [15] explained that the ORN was sensitive to the loss/gain dimension and not to the error/correct dimension, other researchers [16-21] argued that the magnitude of ORN was dependent on the context of a favorable/unfavorable (good/bad) dimension relative to the unchosen alternative outcome indicating whether the subject’s choice was better or worse than the alternative choice. However, in these studies, as both the chosen as well as the alternative outcome stimuli as feedback were simultaneously displayed to the subjects, these studies could not delineate the ‘loss-gain’ dimension or the ‘error-correct’ dimension without them confounding each other. In Nieuwenhuis et al’s [19] study, although the context was made salient based on the background display of color surrounding the numbers and the signs (+ and −) assigned to the numbers, the subjects were simultaneously shown both the chosen and the alternative outcome stimuli and were thus influenced (at least partially) by the relative loss or gain based on the alternative outcomes. In Yeung & Sanfey’s [22] study, although the alternative outcome appeared 1500 ms after the onset of the chosen outcome, the subjects knew and expected that the net outcome would be based on an alternative outcome that was to follow. Our results are consistent with Gehring and Willoughby’s interpretation in terms of gain versus loss although we have used an SOP gambling task. Further, in contrast to multiple outcome tasks, the SOP paradigm used in this study permitted us to describe “brain signatures” for loss and gain in an ‘unconfounded’ manner.
4.4. The Nature and functional significance of the ORN and ORP
Although many researchers (e.g., Nieuwenhuis et al. [19] and Holroyd et al. [46]) uphold the view that ORN and ERN are manifestations of the same underlying cognitive and neural processes, others (e.g., Gehring & Willoughby [15]) maintain that ORN could be a separate component independent of the error/correct dimension and may reflect the emotional/motivational aspects of reward processing. Gehring & Willoughby [47] further differentiated the ERN and ORN (MFN) using wavelet transform; they report that the scalp topography of the theta band (4-7 Hz) of the ORN is more right lateralized and anterior in its scalp distribution than is the ERN. Although several hypotheses, such as the mismatch hypothesis [48], the conflict hypothesis [49], the inhibition hypothesis [50] and the reinforcement learning hypothesis [51] have been proposed to explain the functional significance of the ERN (cf. Falkenstein [30]), our results are perhaps more in agreement with the reinforcement learning hypothesis (gain against loss) by differentiating ORN features specific to ‘loss’ as against ‘gain’. As shown in Fig. 5, the distinction of gain vs. loss (valence) is processed earlier (200-400 ms) while the differentiation of large vs. small (amount) is processed later (after 400 ms) in the human brain. As the amplitude represents the intensity of neural/cognitive processing, the higher amplitude during the early window indicates a more intensive/active processing for the gain outcomes (+50 and +10). This intensity of processing is however taken over by the larger amounts (+50 and −50) at the later time window. This processing (based on amount) remains dominant until 800 ms (as shown in Fig. 5), indicating a persistent neural/cognitive state based on how much has been lost or gained.
Regarding the significance of ORP in gambling paradigms, Yeung & Sanfey [22] first demonstrated that this positive component was sensitive to the reward amount but insensitive to the loss/gain dimension. In contrast to this, our results showed that ORP was sensitive to both valence and amount dimensions (see Fig. 6). Further, as the difference waveform (see Fig. 5) indicates, this sensitivity of ORP could be time-bound: the valence (loss/gain) dimension was dominant around 300 ms and the pattern of separation switched to the amount (large/small) dimension after 400 ms. Therefore it can be speculated that the ORP component is more associated with the subjective evaluation of both valence and amount (i.e., what kind of and how much). In order to better understand the ORP, it is worth looking at the positivity in the error paradigms (Pe). In the research literature, the functional significance of Pe has been explained through several hypotheses (cf. Overbeek et al. [29] and Falkenstein [30]): 1) the affective-processing hypothesis [52], which suggests that the Pe reflects the emotional appraisal of the error or its consequences; 2) the error-awareness hypothesis [32, 48, 53], which proposes that the Pe reflects the conscious recognition of the fact that an error was committed; and 3) the behavior-adaptation hypothesis [32, 53], which suggests that the Pe reflects a process involved in remedial performance adjustments following errors (irrespective of whether such adjustments are driven by affective or cognitive aspects of error processing, or both). In gambling paradigms, the ORP is considered to be the P3 component of the ERPs [22], especially the P3b component with a parietal focus [28]. As in Toyomaki & Murohashi’s [28] study, the finding of our study that the ORP was sensitive to both the quality (loss/gain) and quantity (large/small) of the outcome might reflect that the ORP indexes both the motivational processing for the event of loss/gain (aaha…gain vs. alas…loss) as well as the evaluative processing of amount of loss/gain (larger outcome vs. smaller outcome). This explanation is consistent with the earlier reports that ORP amplitude increased in proportion to both the amount of reward received and the amount of penalty incurred [54, 55] as well as with a recent finding that higher ORP amplitude was observed for the larger amounts than the smaller ones [22]. As the ORP has also been reported to be sensitive to the context (i.e. relative loss/gain based on the alternative outcome), we propose that the ORP is involved with both aspects of outcome processing, namely affective/motivational processing and cognitive/evaluative processing.
4.5. Gender differences
The current study is the first of its kind to examine gender differences in outcome-related ERP components. Although condition differences were predominant and robust, gender differences were subtle and specific to certain ERP features (such as waveform and topography). Statistically, the only gender difference observed was in the ORN component while processing the amount (i.e. large vs. small): males had higher ORN amplitude and shorter ORN latency for the large amount (i.e. 50) than for the small amount (i.e. 10) while females did not show any differential processing for amounts (see Fig. 6, 2nd row). However, it should be noted that both males and females were identical in showing differential processing of amount in terms of ORP amplitude, which occurred more than 100 ms after the ORN component. This finding shows that males were more sensitive in amount processing, which commenced much earlier and persisted much longer in males as evident in ORN and ORP; in females it started much later than 100 ms, as evident only in ORP amplitude. On the other hand, there were no statistically significant gender differences in ORN and ORP features while processing valence (loss vs. gain), i.e. both genders processed the ‘loss’ against the ‘gain’ equally well (see Fig. 6, 1st row). On the other hand, although not statistically significant, there was a consistent trend that females produced higher amplitude and shorter latency across task conditions and scalp regions (Figs. 3, 4, 6, 7). Similar gender differences have been reported in several ERP paradigms as well [56-60]. According to Hoffman and Polich [31], females, as compared to males, produce larger P2, N2 and P3 components during an oddball paradigm. On the other hand, despite these subtle differences in ERPs, it is also to be noted that males and females did not significantly differ across any of the impulsivity / behavioral variables in our study; this shows that behavioral factors are probably less sensitive than ERP variables in eliciting the gender differences in the SOG paradigm.
Topographically, males had the ORP peak amplitude located at the central region whereas females had a similar peak in the parietal area (Fig. 7). LORETA also identified interesting gender differences. In the ORN component, males activate anterior areas during loss and posterior areas during gain while females activate both anterior and posterior areas in all conditions. Further, the ORP component distinguished the amount 50 against 10 in males, but not in females. These findings show that males, as compared to females, have better discrimination for the outcomes in terms of valence and amount. Another interesting gender difference in terms of source activity was that during the ORP activity, females had their maximum activity in anterior areas, while males had the highest activity in posterior areas. These gender differences have been explained in terms of differences in the structure and function of the human cerebral cortex [61] or in the neuro-cognitive abilities [62] or cognitive strategy during information processing [63]. Further studies should examine gender differences in gambling paradigms, especially in a SOG paradigm, in order to further confirm and explain our findings. Additionally, it would be interesting to explore whether prior gambling experience and/or the status of pathological gambling in the participants accounted for the observed gender differences.
4.6. Impulsivity and ERP features
Our results have shown that there was a significant positive correlation between ERP measures (ERP factor 1) and RT variables (TRB factor 1) as shown in Table 3. The longer the reaction time (and hence lower the impulsivity), the higher the ORP amplitude. This observation is further strengthened by our finding that there is a tendency that higher motor impulsivity is related to lower ORN and ORP amplitude. As reported, quicker reaction time is considered a core aspect of impulsivity [64], and this finding is common for many choice-reaction paradigms. Further, in our results, it can be observed that many TRB and BIS variables tend to negatively correlate with (factors of) ERP latency variables, while cognitive impulsivity, on the other hand, had a positive correlation. These findings suggest that there appears to be a potential relationship between behavioral/impulsivity and ERP measures. In the research literature, behavioral measures and the level of impulsivity have already been shown to be correlated with N2 and/or P3 components in the error-paradigms [13, 32-34] as well as in the gambling paradigms [15, 22]. It is also important to note that the finding that selection frequency in TRB variables and non-planning in BIS categories did not correlate with any of the ERP features could be specific to the gambling paradigm of this study. Further studies should explore these aspects with a more systematic method.
In terms of clinical applications, correlates of impulsivity may assume critical importance in identifying/establishing markers for the disorders. For example, impulsivity has been linked to externalizing traits/disorders in general and substance or alcohol use in particular [65-67]. As our results suggest that reward processing is related to impulsivity, specific electrophysiological signatures of impulsivity and/or reward processing may offer clues as to the neurocognitive underpinnings of these processes. For instance, among alcoholic patients, the scores on impulsivity and novelty-seeking were shown to be inversely correlated with P3 potential in a Go/NoGo task [68]. Previous work in our laboratory has shown that irrespective of diagnostic status, highly impulsive individuals had low visual P3 amplitude, while alcoholics in general had higher impulsivity scores than controls [69]. Further, it has also been demonstrated that alcoholics as well as children of alcoholics showed impaired response inhibition (and hence higher impulsivity) in ERPs as well as in event-related oscillations (ERO) [70-73]. Therefore, analysis both ERPs and EROs in error paradigms as well as in gambling tasks may be useful to differentiate people with high and low impulsivity in normals as well as in clinical groups.
In conclusion, the findings of outcome-related potentials in a SOG paradigm identified several nodal points for further exploration: 1) the ORN and/or ORP features could potentially distinguish valence, amount, and gender differences; 2) separate brain processes/circuitry may mediate loss and gain outcomes as indicated by the topography of amplitude and current density; 3) gender as a variable could play a major role in the nature and sensitivity of these ERP components, and therefore analyzing/comparing these components in the context of gender will make the findings more reliable; and 4) behavioral/impulsivity variables could be potentially related to ERP measures in gambling paradigms. Future studies are needed to confirm our findings. Further, as recent studies [44, 74] indicate, understanding of outcome/reward processing can also be potentially enriched by the analysis of power and coherence in different frequency bands of event-related brain oscillations.
Acknowledgments
This study was supported by the National Institutes of Health (NIH) Grants #5 RO1 AA005524, AA02686 and AA008401 from the National Institute on Alcohol Abuse and Alcoholism (NIAAA). We are grateful for the valuable technical assistance of Carlene Haynes, Joyce Alonzia, Chamion Thomas, Tracy Crippen, Glenn Murawski, Eric Talbert, Patrick Harvey, Cindy Lipper, and Gabriel Wurzel.
Abbreviations
- ORN
Outcome-related Negativity
- ORP
Outcome-related Positivity
- ERN
Error-related Negativity
- MFN
Medial Frontal Negativity
- SOG task
Single Outcome Gambling task
- TRB scores
Task Related Behavioral scores
- LORETA
Low Resolution Electromagnetic Tomography
Footnotes
Publisher's Disclaimer: This is a PDF file of an unedited manuscript that has been accepted for publication. As a service to our customers we are providing this early version of the manuscript. The manuscript will undergo copyediting, typesetting, and review of the resulting proof before it is published in its final citable form. Please note that during the production process errors may be discovered which could affect the content, and all legal disclaimers that apply to the journal pertain.
References
- 1.Falkenstein M, Hohnsbein J, Hoormann J, Blanke L. Effects of errors in choice reaction tasks on the ERP under focused and divided attention. In: Brunia CHM, Gaillard AWK, Kok A, editors. Psychophysiological Brain Research. Tilburg: Tilburg University Press; 1990. pp. 192–5. [Google Scholar]
- 2.Falkenstein M, Hohnsbein J, Hoormann J. Event-related potential correlates of errors in reaction tasks. Electroencephalogr Clin Neurophysiol Suppl. 1995;44:287–96. [PubMed] [Google Scholar]
- 3.Bernstein PS, Scheffers MK, Coles MG. “Where did I go wrong?” A psychophysiological analysis of error detection. J Exp Psychol Hum Percept Perform. 1995;21:1312–22. doi: 10.1037//0096-1523.21.6.1312. [DOI] [PubMed] [Google Scholar]
- 4.Vidal F, Hasbroucq T, Grapperon J, Bonnet M. Is the ‘error negativity’ specific to errors? Biol Psychol. 2000;51:109–28. doi: 10.1016/s0301-0511(99)00032-0. [DOI] [PubMed] [Google Scholar]
- 5.Gehring WJ, Fencsik DE. Functions of the medial frontal cortex in the processing of conflict and errors. J Neurosci. 2001;21:9430–7. doi: 10.1523/JNEUROSCI.21-23-09430.2001. [DOI] [PMC free article] [PubMed] [Google Scholar]
- 6.Ullsperger M, von Cramon DY. Subprocesses of performance monitoring: a dissociation of error processing and response competition revealed by event-related fMRI and ERPs. Neuroimage. 2001;14:1387–401. doi: 10.1006/nimg.2001.0935. [DOI] [PubMed] [Google Scholar]
- 7.Ullsperger M, von Cramon DY. How does error correction differ from error signaling? An event-related potential study. Brain Res. 2006;1105:102–9. doi: 10.1016/j.brainres.2006.01.007. [DOI] [PubMed] [Google Scholar]
- 8.Hajcak G, McDonald N, Simons RF. To err is autonomic: error-related brain potentials, ANS activity, and post-error compensatory behavior. Psychophysiology. 2003;40:895–903. doi: 10.1111/1469-8986.00107. [DOI] [PubMed] [Google Scholar]
- 9.Hajcak G, Moser JS, Yeung N, Simons RF. On the ERN and the significance of errors. Psychophysiology. 2005;42:151–60. doi: 10.1111/j.1469-8986.2005.00270.x. [DOI] [PubMed] [Google Scholar]
- 10.Mathalon DH, Whitfield SL, Ford JM. Anatomy of an error: ERP and fMRI. Biol Psychol. 2003;64:119–41. doi: 10.1016/s0301-0511(03)00105-4. [DOI] [PubMed] [Google Scholar]
- 11.Luu P, Tucker DM, Makeig S. Frontal midline theta and the error-related negativity: neurophysiological mechanisms of action regulation. Clin Neurophysiol. 2004;115:1821–35. doi: 10.1016/j.clinph.2004.03.031. [DOI] [PubMed] [Google Scholar]
- 12.Pailing PE, Segalowitz SJ. The effects of uncertainty in error monitoring on associated ERPs. Brain Cogn. 2004;56:215–33. doi: 10.1016/j.bandc.2004.06.005. [DOI] [PubMed] [Google Scholar]
- 13.Ruchsow M, Spitzer M, Gron G, Grothe J, Kiefer M. Error processing and impulsiveness in normals: evidence from event-related potentials. Brain Res Cogn Brain Res. 2005;24:317–25. doi: 10.1016/j.cogbrainres.2005.02.003. [DOI] [PubMed] [Google Scholar]
- 14.Yeung N, Cohen JD. The impact of cognitive deficits on conflict monitoring. Predictable dissociations between the error-related negativity and N2. Psychol Sci. 2006;17:164–71. doi: 10.1111/j.1467-9280.2006.01680.x. [DOI] [PubMed] [Google Scholar]
- 15.Gehring WJ, Willoughby AR. The medial frontal cortex and the rapid processing of monetary gains and losses. Science. 2002;295:2279–82. doi: 10.1126/science.1066893. [DOI] [PubMed] [Google Scholar]
- 16.Hajcak G, Moser JS, Holroyd CB, Simons RF. The feedback-related negativity reflects the binary evaluation of good versus bad outcomes. Biol Psychol. 2006;71:148–54. doi: 10.1016/j.biopsycho.2005.04.001. [DOI] [PubMed] [Google Scholar]
- 17.Holroyd CB, Hajcak G, Larsen JT. The good, the bad and the neutral: Electrophysiological responses to feedback stimuli. Brain Res. 2006;1105:93–101. doi: 10.1016/j.brainres.2005.12.015. [DOI] [PubMed] [Google Scholar]
- 18.Nieuwenhuis S, Holroyd CB, Mol N, Coles MG. Reinforcement-related brain potentials from medial frontal cortex: origins and functional significance. Neurosci Biobehav Rev. 2004;28:441–8. doi: 10.1016/j.neubiorev.2004.05.003. [DOI] [PubMed] [Google Scholar]
- 19.Nieuwenhuis S, Yeung N, Holroyd CB, Schurger A, Cohen JD. Sensitivity of electrophysiological activity from medial frontal cortex to utilitarian and performance feedback. Cereb Cortex. 2004;14:741–7. doi: 10.1093/cercor/bhh034. [DOI] [PubMed] [Google Scholar]
- 20.Nieuwenhuis S, Heslenfeld DJ, von Geusau NJ, Mars RB, Holroyd CB, Yeung N. Activity in human reward-sensitive brain areas is strongly context dependent. Neuroimage. 2005;25:1302–9. doi: 10.1016/j.neuroimage.2004.12.043. [DOI] [PubMed] [Google Scholar]
- 21.Holroyd CB, Larsen JT, Cohen JD. Context dependence of the event-related brain potential associated with reward and punishment. Psychophysiology. 2004;41:245–53. doi: 10.1111/j.1469-8986.2004.00152.x. [DOI] [PubMed] [Google Scholar]
- 22.Yeung N, Sanfey AG. Independent coding of reward magnitude and valence in the human brain. J Neurosci. 2004;24:6258–64. doi: 10.1523/JNEUROSCI.4537-03.2004. [DOI] [PMC free article] [PubMed] [Google Scholar]
- 23.Toyomaki A, Murohashi H. Discrepancy between feedback negativity and subjective evaluation in gambling. Neuroreport. 2005;16:1865–8. doi: 10.1097/01.wnr.0000185962.96217.36. [DOI] [PubMed] [Google Scholar]
- 24.Yeung N, Holroyd CB, Cohen JD. ERP correlates of feedback and reward processing in the presence and absence of response choice. Cereb Cortex. 2005;15:535–44. doi: 10.1093/cercor/bhh153. [DOI] [PubMed] [Google Scholar]
- 25.Donkers FC, Nieuwenhuis S, van Boxtel GJ. Mediofrontal negativities in the absence of responding. Brain Res Cogn Brain Res. 2005;25:777–87. doi: 10.1016/j.cogbrainres.2005.09.007. [DOI] [PubMed] [Google Scholar]
- 26.Masaki H, Takeuchi S, Gehring WJ, Takasawa N, Yamazaki K. Affective-motivational influences on feedback-related ERPs in a gambling task. Brain Res. 2006;1105:110–21. doi: 10.1016/j.brainres.2006.01.022. [DOI] [PubMed] [Google Scholar]
- 27.Potts GF, Martin LE, Burton P, Montague PR. When things are better or worse than expected: the medial frontal cortex and the allocation of processing resources. J Cogn Neurosci. 2006;18:1112–9. doi: 10.1162/jocn.2006.18.7.1112. [DOI] [PubMed] [Google Scholar]
- 28.Toyomaki A, Murohashi H. The ERPs to feedback indicating monetary loss and gain on the game of modified “rock-paper-scissors”. International Congress Series. 2005;1278:381–4. [Google Scholar]
- 29.Overbeek TJM, Nieuwenhuis S, Ridderinkhof KR. Dissociable components of error processing. Journal of Psychophysiology. 2005;19:319–29. [Google Scholar]
- 30.Falkenstein M. ERP correlates of erroneous performance. In: Ullsperger M, Falkenstein M, editors. Errors, Conflicts, and the Brain: Current Opinions on Performance Monitoring. Dortmund, Germany: Max-Planck-Institut fuer Kognitions- und Neurowissenschaften: Leipzig; 2004. pp. 5–13. [Google Scholar]
- 31.Hoffman LD, Polich J. P300, handedness, and corpus callosal size: gender, modality, and task. Int J Psychophysiol. 1999;31:163–74. doi: 10.1016/s0167-8760(98)00050-6. [DOI] [PubMed] [Google Scholar]
- 32.Nieuwenhuis S, Ridderinkhof KR, Blom J, Band GP, Kok A. Error-related brain potentials are differentially related to awareness of response errors: evidence from an antisaccade task. Psychophysiology. 2001;38:752–60. [PubMed] [Google Scholar]
- 33.Pailing PE, Segalowitz SJ, Dywan J, Davies PL. Error negativity and response control. Psychophysiology. 2002;39:198–206. doi: 10.1017/S0048577202010247. [DOI] [PubMed] [Google Scholar]
- 34.Potts GF, George MR, Martin LE, Barratt ES. Reduced punishment sensitivity in neural systems of behavior monitoring in impulsive individuals. Neurosci Lett. 2006;397:130–4. doi: 10.1016/j.neulet.2005.12.003. [DOI] [PubMed] [Google Scholar]
- 35.Folstein MF, Folstein SE, McHugh PR. “Mini-mental state”. A practical method for grading the cognitive state of patients for the clinician. J Psychiatr Res. 1975;12:189–98. doi: 10.1016/0022-3956(75)90026-6. [DOI] [PubMed] [Google Scholar]
- 36.Barratt ES. Impulsiveness subtraits: Arousal and information processing. In: Spence JT, Izard CE, editors. Motivation, Emotion and Personality. New York: Elsevier; 1985. pp. 137–46. [Google Scholar]
- 37.Patton JH, Stanford MS, Barratt ES. Factor structure of the Barratt impulsiveness scale. J Clin Psychol. 1995;51:768–74. doi: 10.1002/1097-4679(199511)51:6<768::aid-jclp2270510607>3.0.co;2-1. [DOI] [PubMed] [Google Scholar]
- 38.Pascual-Marqui RD, Michel CM, Lehmann D. Low resolution electromagnetic tomography: a new method for localizing electrical activity in the brain. Int J Psychophysiol. 1994;18:49–65. doi: 10.1016/0167-8760(84)90014-x. [DOI] [PubMed] [Google Scholar]
- 39.Pascual-Marqui RD, Esslen M, Kochi K, Lehmann D. Functional imaging with low-resolution brain electromagnetic tomography (LORETA): a review. Methods Find Exp Clin Pharmacol. 2002;24 Suppl C:91–5. [PubMed] [Google Scholar]
- 40.Pascual-Marqui Papers that quote LORETA: Updated 2007-Feb-12. 2007 [ http://www.unizh.ch/keyinst/NewLORETA/QuoteLORETA/PapersThatQuoteLORETA05.htm]
- 41.Zumsteg D, Wennberg RA, Treyer V, Buck A, Wieser HG. H2(15)O or 13NH3 PET and electromagnetic tomography (LORETA) during partial status epilepticus. Neurology. 2005;65:1657–60. doi: 10.1212/01.wnl.0000184516.32369.1a. [DOI] [PubMed] [Google Scholar]
- 42.Nichols TE, Holmes AP. Nonparametric permutation tests for functional neuroimaging: a primer with examples. Hum Brain Mapp. 2002;15:1–25. doi: 10.1002/hbm.1058. [DOI] [PMC free article] [PubMed] [Google Scholar]
- 43.Flor-Henry P, Lind JC, Koles ZJ. A source-imaging (low-resolution electromagnetic tomography) study of the EEGs from unmedicated males with depression. Psychiatry Res. 2004;130:191–207. doi: 10.1016/j.pscychresns.2003.08.006. [DOI] [PubMed] [Google Scholar]
- 44.Cohen MX, Elger CE, Ranganath C. Reward expectation modulates feedback-related negativity and EEG spectra. Neuroimage. 2007;35:968–78. doi: 10.1016/j.neuroimage.2006.11.056. [DOI] [PMC free article] [PubMed] [Google Scholar]
- 45.Yacubian J, Glascher J, Schroeder K, Sommer T, Braus DF, Buchel C. Dissociable systems for gain- and loss-related value predictions and errors of prediction in the human brain. J Neurosci. 2006;26:9530–7. doi: 10.1523/JNEUROSCI.2915-06.2006. [DOI] [PMC free article] [PubMed] [Google Scholar]
- 46.Holroyd CB, Coles MG, Nieuwenhuis S. Medial prefrontal cortex and error potentials. Science. 2002;296:1610–1. doi: 10.1126/science.296.5573.1610. author reply -1. [DOI] [PubMed] [Google Scholar]
- 47.Gehring WJ, Willoughby AR. Are all medial frontal negativities created equal? Toward a richer empirical basis for theories of action monitoring. In: Ullsperger M, Falkenstein M, editors. Errors, Conflicts, and the Brain: Current Opinions on Performance Monitoring. Dortmund, Germany: Max-Planck-Institut fuer Kognitions- und Neurowissenschaften: Leipzig; 2003. [Google Scholar]
- 48.Falkenstein M, Hoormann J, Christ S, Hohnsbein J. ERP components on reaction errors and their functional significance: a tutorial. Biol Psychol. 2000;51:87–107. doi: 10.1016/s0301-0511(99)00031-9. [DOI] [PubMed] [Google Scholar]
- 49.Carter CS, Braver TS, Barch DM, Botvinick MM, Noll D, Cohen JD. Anterior cingulate cortex, error detection, and the online monitoring of performance. Science. 1998;280:747–9. doi: 10.1126/science.280.5364.747. [DOI] [PubMed] [Google Scholar]
- 50.Falkenstein M, Hoormann J, Hohnsbein J. ERP components in Go/Nogo tasks and their relation to inhibition. Acta Psychol (Amst) 1999;101:267–91. doi: 10.1016/s0001-6918(99)00008-6. [DOI] [PubMed] [Google Scholar]
- 51.Holroyd CB, Coles MG. The neural basis of human error processing: reinforcement learning, dopamine, and the error-related negativity. Psychol Rev. 2002;109:679–709. doi: 10.1037/0033-295X.109.4.679. [DOI] [PubMed] [Google Scholar]
- 52.van Veen V, Carter CS. The timing of action-monitoring processes in the anterior cingulate cortex. J Cogn Neurosci. 2002;14:593–602. doi: 10.1162/08989290260045837. [DOI] [PubMed] [Google Scholar]
- 53.Leuthold H, Sommer W. ERP correlates of error processing in spatial S-R compatibility tasks. Clin Neurophysiol. 1999;110:342–57. doi: 10.1016/s1388-2457(98)00058-3. [DOI] [PubMed] [Google Scholar]
- 54.Sutton RS, Tueting P, Hammer M, Hakerem G. Evoked potentials and feedback. In: Otto D, editor. Multidiscipliniary perspectives in event-related brain potential research. Washington, DC: U.S. Government Printing Office; 1978. pp. 184–8. [Google Scholar]
- 55.Johnston VS. Stimuli with biological significance. In: Begleiter H, editor. Evoked brain potentials and behavior. New York: Plenum; 1979. pp. 1–12. [Google Scholar]
- 56.Orozco S, Ehlers CL. Gender differences in electrophysiological responses to facial stimuli. Biol Psychiatry. 1998;44:281–9. doi: 10.1016/s0006-3223(97)00487-3. [DOI] [PubMed] [Google Scholar]
- 57.Orozco S, Wall TL, Ehlers CL. Influence of alcohol on electrophysiological responses to facial stimuli. Alcohol. 1999;18:11–6. doi: 10.1016/s0741-8329(98)00061-5. [DOI] [PubMed] [Google Scholar]
- 58.Guillem F, Mograss M. Gender differences in memory processing: evidence from event-related potentials to faces. Brain Cogn. 2005;57:84–92. doi: 10.1016/j.bandc.2004.08.026. [DOI] [PubMed] [Google Scholar]
- 59.Proverbio AM, Brignone V, Matarazzo S, Del Zotto M, Zani A. Gender differences in hemispheric asymmetry for face processing. BMC neuroscience. 2006;7:44. doi: 10.1186/1471-2202-7-44. [DOI] [PMC free article] [PubMed] [Google Scholar]
- 60.Proverbio AM, Brignone V, Matarazzo S, Del Zotto M, Zani A. Gender and parental status affect the visual cortical response to infant facial expression. Neuropsychologia. 2006;44:2987–99. doi: 10.1016/j.neuropsychologia.2006.06.015. [DOI] [PubMed] [Google Scholar]
- 61.de Courten-Myers GM. The human cerebral cortex: gender differences in structure and function. J Neuropathol Exp Neurol. 1999;58:217–26. doi: 10.1097/00005072-199903000-00001. [DOI] [PubMed] [Google Scholar]
- 62.Vecchi T, Girelli L. Gender differences in visuo-spatial processing: the importance of distinguishing between passive storage and active manipulation. Acta Psychol (Amst) 1998;99:1–16. doi: 10.1016/s0001-6918(97)00052-8. [DOI] [PubMed] [Google Scholar]
- 63.Njemanze PC. Cerebral lateralization and general intelligence: gender differences in a transcranial Doppler study. Brain Lang. 2005;92:234–9. doi: 10.1016/j.bandl.2004.06.104. [DOI] [PubMed] [Google Scholar]
- 64.Whiteside SP, Lynam DR. The Five Factor Model and impulsivity: Using a structural model of personality to understand impulsivity. Personal Indiv Diff. 2001;30:669–89. [Google Scholar]
- 65.Saunders JT, Reppucci ND, Sarata BP. An examination of impulsivity as a trait characterizing delinquent youth. Am J Orthopsychiatry. 1973;43:789–95. doi: 10.1111/j.1939-0025.1973.tb00851.x. [DOI] [PubMed] [Google Scholar]
- 66.O’Boyle M, Barratt E. Impulsivity and DSM-III-R personality disorders. Pers Individ Dif. 1993;14:609–11. [Google Scholar]
- 67.Krueger RF, Hicks BM, Patrick CJ, Carlson SR, Iacono WG, McGue M. Etiologic connections among substance dependence, antisocial behavior, and personality: modeling the externalizing spectrum. J Abnorm Psychol. 2002;111:411–24. [PubMed] [Google Scholar]
- 68.Fallgatter AJ, Wiesbeck GA, Weijers HG, Boening J, Strik WK. Event-related correlates of response suppression as indicators of novelty seeking in alcoholics. Alcohol Alcohol. 1998;33:475–81. doi: 10.1093/alcalc/33.5.475. [DOI] [PubMed] [Google Scholar]
- 69.Chen AC, Porjesz B, Rangaswamy M, Kamarajan C, Tang Y, Jones KA, et al. Reduced frontal lobe activity in subjects with high impulsivity and alcoholism. Alcohol Clin Exp Res. 2007;31:156–65. doi: 10.1111/j.1530-0277.2006.00277.x. [DOI] [PubMed] [Google Scholar]
- 70.Kamarajan C, Porjesz B, Jones K, Chorlian D, Padmanabhapillai A, Rangaswamy M, et al. Event-related oscillations in offspring of alcoholics: neurocognitive disinhibition as a risk for alcoholism. Biol Psychiatry. 2006;59:625–34. doi: 10.1016/j.biopsych.2005.08.017. [DOI] [PMC free article] [PubMed] [Google Scholar]
- 71.Kamarajan C, Porjesz B, Jones KA, Choi K, Chorlian DB, Padmanabhapillai A, et al. The role of brain oscillations as functional correlates of cognitive systems: a study of frontal inhibitory control in alcoholism. Int J Psychophysiol. 2004;51:155–80. doi: 10.1016/j.ijpsycho.2003.09.004. [DOI] [PMC free article] [PubMed] [Google Scholar]
- 72.Kamarajan C, Porjesz B, Jones KA, Choi K, Chorlian DB, Padmanabhapillai A, et al. Alcoholism is a disinhibitory disorder: neurophysiological evidence from a Go/No-Go task. Biol Psychol. 2005;69:353–73. doi: 10.1016/j.biopsycho.2004.08.004. [DOI] [PMC free article] [PubMed] [Google Scholar]
- 73.Kamarajan C, Porjesz B, Jones KA, Chorlian DB, Padmanabhapillai A, Rangaswamy M, et al. Spatial-anatomical mapping of NoGo-P3 in the offspring of alcoholics: evidence of cognitive and neural disinhibition as a risk for alcoholism. Clin Neurophysiol. 2005;116:1049–61. doi: 10.1016/j.clinph.2004.12.015. [DOI] [PMC free article] [PubMed] [Google Scholar]
- 74.Kamarajan C, Rangaswamy M, Chorlian DB, Manz N, Tang Y, Pandey AK, et al. Theta oscillations during the processing of monetary loss and gain: A perspective on gender and impulsivity. Brain Res. 2008 doi: 10.1016/j.brainres.2008.06.051. [DOI] [PMC free article] [PubMed] [Google Scholar]