Abstract
For over 30 years, Canadian provinces have provided universal public insurance for hospital and physician care; however, evidence points to persisting socio-economic inequity in healthcare use. Because provinces hold the responsibility for planning and funding most publicly insured health services, there is some variation in health system characteristics. In the context of such variation, this study systematically investigated equity in healthcare use across the provinces. Drawing on the 2003 Canadian Community Health Survey, the author applied the indirect standardization approach to create an index of needs-adjusted inequity in the probability, total and conditional number of GP, specialist, hospital and dentist visits. Results reveal some variation in inequity across provinces; however, national trends show pro-rich inequity in the probability of a GP, specialist and dentist visit, and no significant evidence of inequity in inpatient care. Aside from income, the main socio-economic factors associated with inequity are education, complementary insurance for prescription drugs and dental care and, in some cases, region of residence. When total (and conditional) number of visits are examined, the pro-rich inequity in GP care disappears in all provinces. Differences in the extent of and contributors to inequity that are observed across the provinces suggest a need for more in-depth provincial policy analyses.
Abstract
Depuis plus de 30 ans, les gouvernements des provinces canadiennes offrent des régimes d'assurance publique pour les services médicaux et hospitaliers. Toutefois, les données montrent qu'il existe encore des iniquités socioéconomiques dans l'utilisation des services de santé. Puisque les provinces sont responsables de la planification et du financement de la plupart des services de santé, il y a des variations entre les différents systèmes de santé. Dans ce contexte de variation, l'auteure de la présente étude a examiné systématiquement le principe d'équité dans l'utilisation des services de santé entre les provinces. En s'appuyant sur les résultats de l'Enquête sur la santé dans les collectivités canadiennes de 2003, l'auteure a employé la méthode de standardisation indirecte afin de créer un indice d'iniquité ajusté selon les besoins pour calculer le nombre probable, total et conditionnel de visites chez les omnipraticiens, chez les spécialistes, à l'hôpital et chez le dentiste. Les résultats indiquent une certaine variation dans l'iniquité entre les provinces, toutefois, la tendance nationale montre une iniquité favorisant les mieux nantis pour ce qui est de la probabilité d'une visite chez l'omnipraticien, le spécialiste ou le dentiste et n'indique aucun résultat significatif d'iniquité dans les soins aux personnes hospitalisées. Mis à part le revenu, les principaux facteurs influant l'iniquité sont la scolarisation, les assurances complémentaires pour médicaments et soins dentaires et, dans certains cas, le lieu de résidence. Pour ce qui est des soins omnipraticiens, l'iniquité en faveur des mieux nantis disparaît dans toutes les provinces si l'on tient compte du nombre total (et conditionnel) de visites. Les différences observées entre les provinces dans la dispersion et dans les facteurs contribuant à l'iniquité laissent croire qu'il est nécessaire d'effectuer une analyse plus détaillée des politiques provinciales.
The stated objective of Canadian health policy is to protect, promote and restore the physical and mental well-being of its residents and to facilitate access to health services. Equity in healthcare is a concept of vital importance to Canadians (Romanow 2002), and “reasonable” access to healthcare is legislated in the Canada Health Act of 1984: “insured persons must have reasonable and uniform access to insured health services, free of financial or other barriers. No one may be discriminated against on the basis of such factors as income, age, and health status.”
While equal access to care is a major objective of the Canadian health system as reflected in a number of pieces of national legislation, it is also echoed at the provincial level (e.g., Health Services Restructuring Commission 1999; Ministry of Health and Ministry Responsible for Seniors 1997). The actual enactment of policy occurs at the provincial level: provinces are responsible for planning and funding most public healthcare services (hospital and physician care) dating back to the 1867 constitution granting them exclusive powers of “establishment, maintenance and management of hospitals.” Differences in the level and sources of healthcare financing, payment mechanisms, benefits packages, supply of health services and level of further decentralization to regional and local levels may, thus, lead to different degrees of inequity in access to health services.
Separate universal systems of hospital and physician care, governed by provincial legislation, are influenced by the federal government through its fiscal transfer policy: provinces must conform to the five principles of the Canada Health Act (universality, public administration, comprehensiveness, portability and accessibility) in order to receive federal cash transfers (Marchildon 2005). Meanwhile, coverage of services outside physician and hospital care is left entirely to the discretion of the provinces, although there is some consistency in the extent to which provinces subsidize these costs. For example, prescription drug costs are generally covered by the different provincial insurance plans for some population subgroups such as those receiving social assistance, older people and individuals with specific diseases, with varying levels of cost sharing (Grootendorst 2002). The majority of individuals not covered in a provincial plan are privately insured through employer-sponsored insurance, although those without adequate coverage may face additional cost barriers to accessing care.
Studies of equity reveal that the introduction of universal coverage better aligned the distribution of health services according to need (Mhatre and Deber 1992), although inequity persists. Research in this area approximates access to healthcare with utilization, although the two concepts may encompass different sets of conditions (Donabedian 1972; Oliver and Mossialos 2004). Equal access for equal need presumes that individuals are given equal opportunities to access services; however, inequity in utilization may not solely reflect inappropriate or unfair differences in service use, as utilization is affected by personal characteristics such as individual preferences, expectations and beliefs. Therefore, observed inequity in utilization may not necessarily be unfair. However, examining equity in terms of healthcare utilization is consistent with interpretations by federal and provincial governments (Birch and Abelson 1993; Birch et al. 1993).
A vast literature reveals inequity in healthcare use after controlling for need in some sectors and provinces in Canada. Studies tend to show that higher income and education are associated with a greater likelihood of specialist physician service use, but not always with use of primary physicians, and people with lower income may be making more use of hospital services but not necessarily surgical services (e.g., Dunlop et al. 2000; Manga et al. 1987; Roos and Mustard 1997; Veugelers and Yip 2003; McIsaac et al. 1997; Roos et al. 2004). However, others find income is neither relevant in physician (Finkelstein 2001) nor hospital care (Asada and Kephart 2007). A few studies have investigated equity in specific procedures, demonstrating higher rates of diagnostics and cardiac surgeries for higher-income individuals (Alter et al. 1999; Demeter et al. 2005). The most recent and technically advanced study investigating equity in 21 developed countries including Canada found that standardizing for need differences, higher-income groups had increased probability of both general practitioner (GP) and specialist visits (pro-rich distribution of healthcare use), with the reverse seen in inpatient care (pro-poor distribution). Further, intensity of use is pro-rich for specialist visits but pro-poor for GP care (van Doorslaer and Masseria 2004). The importance of this methodological approach is that it not only measures the existence of inequity, but also quantifies its extent, thus enabling comparison across service areas, jurisdictions and time periods. What remains missing in the literature, however, is a systematic examination of equity in the different healthcare sectors across the Canadian provinces, given that each province aims to achieve equity, yet differs to some extent in system characteristics.
Methods
Data
This study investigates the level of inequity in healthcare use across the provinces, drawing from the Canadian Community Health Survey (CCHS). The CCHS is a cross-sectional survey of persons aged 12 years or older living in private dwellings. It is based on a multistage cluster design in which the dwelling is the final sampling unit. Persons living on Indian reserves or Crown lands, residents of institutions, full-time members of the Canadian Forces and residents of certain remote regions are excluded from this survey. The CCHS is representative of approximately 98% of the Canadian population aged 12 or older. This study is based on the Public Use Microdata from 2003 (cycle 2.1). Individuals under age 15 (5.5% of total sample) are not included in the analysis in order to focus on the adult population. Also excluded are individuals missing relevant income, health or socio-demographic data (17% of the total sample). Almost all the missing data can be explained by missing income information: there are only negligible differences between those missing income and the rest of the sample in terms of health status or healthcare use, although they are disproportionately represented by the youngest age group (15–19). Territories are also not included owing to under-sampling of these regions. Sampling weights included in the public data set are used for all analyses.
Healthcare use is measured by the following questions:
-
[Not counting when you were an overnight patient], in the past 12 months, how many times have you seen, or talked with on the telephone, about your physical, emotional or mental health …
a family doctor or general practitioner? [GP]
an eye specialist or any other medical doctor (such as a surgeon, allergist, orthopaedist, gynaecologist or psychiatrist)? [specialist]
a dentist or orthodontist? [dentist]
In the past 12 months, have you been a patient overnight in a hospital, nursing home or convalescent home? [inpatient]
For the probability models, they were transformed into a dichotomous variable: “no visits” or “1 or more visits”; for the conditional models, only individuals who report any use are included.
Indicators of healthcare need include interactions of age and sex (with dummy variables for the following age groups: 15–34; 35–44; 45–64; 65–74; 75 and above, separately for men and women; men aged 15–34 is the reference category), self-assessed health in five categories (excellent – reference category, very good, good, fair and poor) and moderate and severe activity limitations (no limitations as the reference category). Further indicators of need were not included to avoid the methodological issues arising from the high level of collinearity among the health variables. For dental care, age and self-assessed oral health in five categories (as above) approximate need.
Total household income is measured in five categories and adjusted for the number of people living in the household (but not household composition) to represent individual income. Factors other than need and income have been shown to affect utilization patterns (Aday and Andersen 1981); thus, in order to better understand the contributors to any observed inequity by income, other socio-economic variables were included in the models: education (less than secondary education – reference category, secondary and post-secondary), residing in the capital city of the province and whether they are employed, a student, retired, unemployed or self-employed (reference category). Complementary insurance coverage is also included as a confounding variable in the five models: insurance for prescription drugs in the physician models, for hospital costs (i.e., hotel amenities) in the model of hospital care and for dental care in the dentist model.
Statistical analysis
This study calculates income-related inequity in four areas of healthcare use across the Canadian provinces: GP, specialist, hospital (inpatient) and dental care. It does so by examining the probability of any use, the total number of visits (or nights, in the case of hospital care) and the conditional number of visits (nights). Results of the analysis of conditional models are not reported.
Equity is calculated by comparing the distribution of healthcare use by income with the distribution of healthcare need (health status) using the concept of the concentration curve (Wagstaff and van Doorslaer 2000). The horizontal inequity (HI) index derives from the difference between the income-related inequality in actual healthcare use and the income-related inequality in need-expected use. The latter is calculated using the predicted use probabilities from a regression on need indicators where the non-need variables are held constant at their mean. The estimates of healthcare need are obtained using a probit model for the probability of a visit (or hospital admission) and an OLS regression for the total and conditional number of visits (nights) because analyses have shown little difference between linear and non-linear models (van Doorslaer and Masseria 2004). The distinction between inequality and inequity is an important one: unequal utilization patterns by income are not necessarily unfair because of the underlying unequal distribution of need, whereas inequity captures any unequal healthcare use by income that remains after need standardization.
By construction, a zero index of horizontal inequity implies that after controlling for differences in need across income groups, all individuals have equal probability of using health services or are using the same amount, regardless of income. After adjusting for need, when service use is more concentrated among the better off (worse off), the horizontal inequity index is positive (negative). The index ranges from −1 to 1: a positive index implies that individuals with higher income are more likely to visit a physician than one would expect on the basis of their reported need, and vice versa.
In calculating horizontal inequity indices separately for each province, the underlying assumption is that differences in the mean utilization levels across provinces or in the utilization differences among people in different levels of need are acceptable. Thus, I assume that provincial norms of utilization should be used for calculating inequity as opposed to national norms, in light of (often immeasurable) socio-cultural heterogeneity across provinces.
For the analyses of inequity in total number of visits (nights), the decomposition method is used to measure whether socio-economic factors related to income, such as education, residence, employment status and complementary insurance coverage, are contributing to the overall level of income-related inequity (Wagstaff et al. 2003). Different utilization patterns across income groups can theoretically be due to underlying related socio-economic characteristics such as education and insurance status; therefore, the decomposition analysis allows us to discover what other factors may be driving inequity. The contribution of each variable to inequity is a product of its impact on demand, as measured by its marginal effect on utilization multiplied by the mean value of the regressor and divided by the mean predicted probability, and its correlation with the income distribution. For example, a positive contribution of education to specialist inequity indicates that higher education is associated with both higher income and utilization.
Results
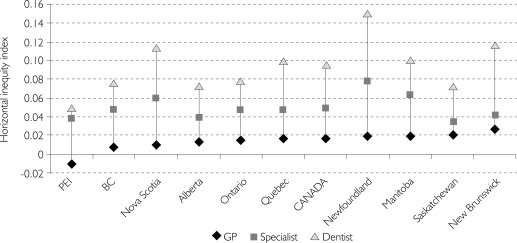
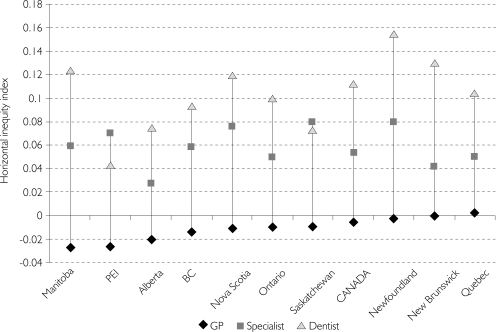
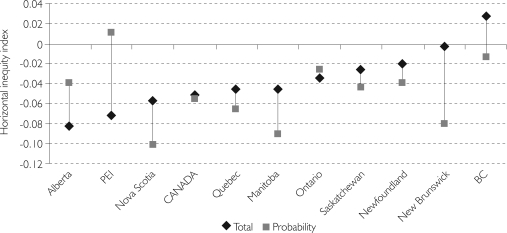
There is some variation in reported healthcare utilization across the country and in the levels of complementary insurance coverage (Tables 1 and 2). Differences across the provinces in the extent of horizontal inequity are also observed, but some national patterns can be seen (Figures 1–3).
TABLE 1.
Descriptive statistics for healthcare utilization: weighted percentage with one visit (mean number of visits) and percentage without a regular doctor
| n | GP | Specialist | Inpatient | Dentist | No regular doctor (%) | |
|---|---|---|---|---|---|---|
| Newfoundland | 3,067 | 83.04 (4.15) | 51.13 (1.15) | 9.84 (0.76) | 46.38 (0.91) | 13.36 |
| Prince Edward Island | 1,530 | 84.14 (3.10) | 53.82 (1.39) | 10.94 (0.80) | 63.31 (1.26) | 8.05 |
| Nova Scotia | 3,821 | 84.53 (3.92) | 52.78 (1.32) | 9.28 (0.61) | 60.92 (1.29) | 5.52 |
| New Brunswick | 3,827 | 80.24 (3.36) | 51.77 (1.16) | 11.33 (0.84) | 52.30 (1.07) | 7.55 |
| Quebec | 21,552 | 69.69 (2.25) | 56.67 (1.30) | 8.88 (0.54) | 56.22 (1.05) | 26.10 |
| Ontario | 34,419 | 79.76 (3.26) | 55.40 (1.34) | 7.52 (0.44) | 69.61 (1.48) | 8.41 |
| Manitoba | 5,827 | 77.00 (3.00) | 51.16 (1.22) | 8.77 (0.53) | 60.24 (1.22) | 16.47 |
| Saskatchewan | 5,716 | 80.63 (3.66) | 54.59 (1.19) | 9.62 (0.57) | 54.73 (1.02) | 14.45 |
| Alberta | 10,377 | 80.33 (3.35) | 52.17 (1.16) | 8.22 (0.42) | 62.57 (1.21) | 16.41 |
| British Columbia | 12,367 | 82.24 (3.74) | 49.26 (1.20) | 7.78 (0.41) | 67.43 (1.41) | 10.92 |
| CANADA | 104,510 | 77.85 (3.12) | 54.18 (1.28) | 8.26 (0.49) | 63.69 (1.29) | 14.26 |
TABLE 2.
Weighted percentage reporting complementary insurance coverage for prescription drugs, dental care and hospital amenities
| Prescription drugs | Dental care | Hospital amenities | |
|---|---|---|---|
| Newfoundland | 69.15 | 49.66 | 56.79 |
| Prince Edward Island | 67.02 | 54.19 | 58.27 |
| Nova Scotia | 77.53 | 59.93 | 65.37 |
| New Brunswick | 73.27 | 60.11 | 61.38 |
| Quebec | 89.80 | 46.45 | 61.27 |
| Ontario | 77.97 | 68.84 | 65.45 |
| Manitoba | 72.96 | 65.68 | 66.42 |
| Saskatchewan | 73.32 | 65.71 | 66.25 |
| Alberta | 80.26 | 71.14 | 70.07 |
| British Columbia | 72.92 | 62.97 | 53.61 |
| CANADA | 79.77 | 61.92 | 63.23 |
FIGURE 1.
Equity in the probability of a GP, specialist and dentist visit (ranked by GP)
Note: All indices significantly different than zero at 95% level except for GP probability in PEI.
FIGURE 2.
Equity in the total number of GP, specialist and dentist visits (ranked by GP)
Note: All specialist and dentist indices significantly different than zero at 95% level except specialists in Alberta. All GP indices non-significant except in Manitoba.
FIGURE 3.
Equity in the probability of hospital admission and total number of nights spent in hospital (ranked by total nights)
Note: All indices non-significant except total nights in Alberta and Canada, and probability of inpatient admission in Nova Scotia, Canada, Quebec, Manitoba and New Brunswick.
There appears to be consistent pro-rich inequity in GP visit probability, and pro-poor inequity in the total and conditional number of visits. The exceptions are Quebec, which has no significant inequity in total GP visits, and Prince Edward Island (PEI), which has a pro-poor, although non-significant, inequity in GP visit probability.
For specialist visits, pro-rich inequity is consistently higher than is seen with GPs for both the probability of a visit and also the total number of visits in all provinces. However, when only those who had one specialist visit are included, i.e., conditional number of visits, the observed inequity disappears in most cases (ranging between −0.01 and 0.05), with the exception of Alberta and PEI, where it remains significantly pro-rich (results are not reported).
Dental care is the most significantly pro-rich, both for the total number and the probability of at least one visit. However, notable variation is observable across the provinces, with the lowest level of inequity in PEI and Saskatchewan and the highest in New Brunswick and Newfoundland. As seen with specialist visits, upon examining the conditional number of visits the pro-rich inequity becomes non-significant in most provinces, with the exception of British Columbia and Ontario, where it remains significantly pro-rich (with a range from −0.011 to 0.020 across the provinces).
In the case of inpatient care, significant variation of inequity appears across the provinces, although the total number of nights spent in hospital is pro-poor but non-significant in all provinces but Alberta. The probability of spending a night in hospital is significantly pro-poor in five provinces (the highest in Newfoundland) and non-significantly pro-poor in those remaining, with the exception of PEI, where it is pro-rich (but non-significant). Comparison of inequity in admissions, however, is difficult because of the small sample sizes in some provinces, coupled with low admission rates.
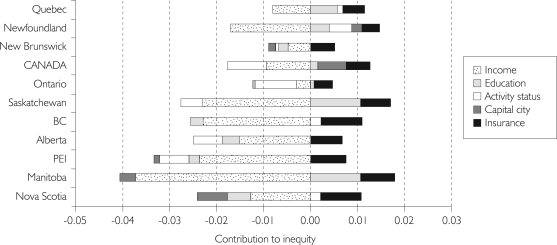
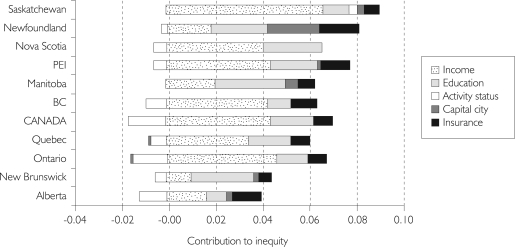
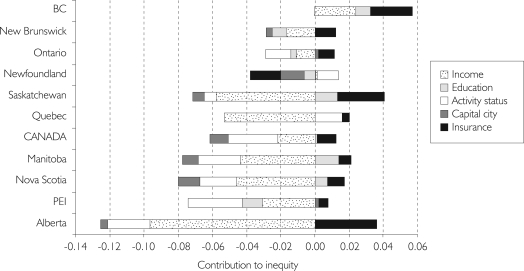
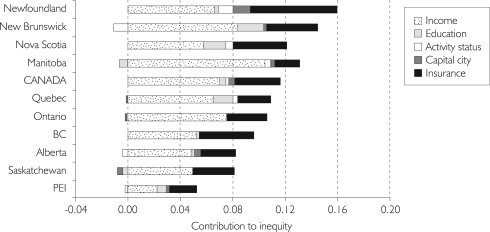
The results of the decomposition analyses provide some indication of the drivers behind the differences in healthcare inequity across the country. The contributors to inequity in total number of visits (hospital nights) are shown in Figures 4–7. Apparently, income itself is not the only cause of inequitable patterns of healthcare use by income groups; other socio-economic factors are also contributing to inequity.
FIGURE 4.
Contributors to inequity in total number of GP visits (ranked by HI index)
FIGURE 5.
Contributors to inequity in total number of specialist visits (ranked by HI index)
FIGURE 6.
Contributors to inequity in total number of hospital nights (ranked by HI index)
FIGURE 7.
Contributors to inequity in total number of dentist visits (ranked by HI index)
For GP care, total use is pro-poor in all provinces except Quebec; however, the contributions of prescription drug insurance coverage, education and activity status are not much higher here than in the other provinces, while the negative role of income is less important. In other words, individuals with lower income are still making more use of services than those with higher incomes, but to a lesser extent in Quebec than in the other provinces.
For specialist care, the highest pro-rich inequity can be found in Saskatchewan, Newfoundland and Nova Scotia. In Saskatchewan, income is the most important driver of inequity. In Newfoundland, the contribution of urban (capital city) residence is pro-rich, unlike all other provinces but Manitoba and Saskatchewan, contributing about as much as income, education and prescription drug coverage. In Nova Scotia, pro-rich inequity appears to be caused by income, education and drug coverage.
Hospital care is pro-poor in all provinces but British Columbia; there, the (non-significant) pro-rich inequity is related to income, education and insurance coverage for hospital amenities. In Alberta, where nights spent in hospital is most pro-poor, this finding is largely explained by the negative impact of income.
The main contributors to inequity in dental care are income and dental insurance coverage in all provinces. Income contributes more to the pro-rich inequity than insurance in all provinces except Newfoundland, where income and insurance contribute about equally; it is here that inequity is most pro-rich.
Discussion and Conclusions
In Canada, the provinces share national constraints on social policies, and historical and macroeconomic context. Furthermore, training of health professionals is harmonized across the country, and federal equalization payments redistribute federal and provincial taxes from the wealthier to the poorer provinces with the aim that they all have largely comparable resources for public services. However, variation still exists in spending per capita, in the public/private mix of funding and in supply and quality of care (CIHI 2006), all of which may affect equity in healthcare use. In this analysis, similar patterns of inequity appear across the provinces, although with some variations in extent and in the underlying contributors.
Overall, the results demonstrate pro-rich inequity in the probability of using physician and dental services. For the total number of physician visits, results for specialist and dental care are almost unchanged, but for GP visits inequity nears zero or becomes pro-poor (only significantly in Manitoba). Therefore, there may be barriers to accessing a GP for an initial visit for lower-income groups that can be considered more patient-driven, but the intensity of primary care use, which is more provider-driven, is more equally distributed. Moreover, conditional upon one visit, in all provinces inequity in GP visits becomes significantly pro-poor, and even nears zero for specialist care. Therefore, the well-documented disparity in specialist care favouring higher-income and better-educated individuals (see, for example, Dunlop et al. 2000; van Doorslaer and Masseria 2004) may be important in securing the initial appointment, which is available only through GP referral, but not in accessing further needed specialist care. This finding has also been demonstrated at the national level using earlier data from the CCHS (Asada and Kephart 2007).
It is not surprising that pro-rich inequity is highest in dental care (very high in most provinces, i.e., the horizontal inequity index is 0.10 or larger), given that this sector is left entirely outside the public system and federal oversight, and complementary insurance coverage is held almost exclusively by the wealthy and younger age groups (Bhatti et al. 2007). In addition to having the highest inequity, dental care also shows notable variability in extent of inequity across the provinces: the greatest pro-rich inequity is found in Newfoundland, where both mean utilization and insurance coverage are lowest, and the least inequity in PEI and Alberta, where utilization rates are high and, in Alberta, insurance coverage is the highest. This finding suggests that more public funding could be directed towards subsidizing dental care costs or dental insurance costs to improve access for lower-income groups.
Wide variations in the extent of inequity in hospital care are seen across the country, although there is little evidence of significant inequity. Overall, there is a mostly non-significant trend suggesting that poorer groups are more likely to be admitted to hospital, and are also staying longer than higher-income groups. The equitable or pro-poor distribution of hospital care differs from the other service areas, and may relate to a number of factors – such as greater integration of hospital-level services within the regional health administrations, which may better meet the needs of disadvantaged groups, or lack of effective primary care, which may lead to greater reliance on emergency hospitalizations for lower-income groups (as observed in Ontario; see Glazier et al. 2006).
No single province has the lowest level of income-related inequity in all four service areas, although PEI, a very small island province of fewer than 140,000 inhabitants, appears to have among the lowest pro-rich inequity in primary and dental care. This finding may relate to fewer geographic barriers to access. Geographic barriers may also partly explain the high level of pro-rich inequity in specialist and dental care in Newfoundland, where region of residence (measured by living in the capital city) contributes to pro-rich inequity; in other words, individuals living in the capital city are more likely to have higher income and are also more likely to make use of services.
The differential impact of complementary insurance across the country also plays some role in explaining the observed variations. For GP and specialist care, complementary coverage for prescription drugs appears to contribute more to pro-rich inequity in the Atlantic provinces, where levels of coverage are among the lowest (Table 2). This finding would suggest that improving coverage for services falling outside physician and hospital services (Romanow 2002) may reduce the observed inequity in these provinces. The role of prescription drug coverage in explaining the pro-rich inequity in GP care may be due to the “bundling” of these services (Tuohy et al. 2004); thus, the cost of prescription drugs may deter some individuals from making the initial GP appointment. Indeed, the decomposition of GP inequity reveals that prescription drug coverage is the main, if not the only, positive contribution to inequity (as shown in Figure 4).
Patterns of inequity may also relate to differences in utilization rates. Descriptive statistics show that PEI has a high-use population compared to the other provinces/territories, in particular for GP visit probability. Moreover, the provinces with the lowest levels of inequity in GP services are also those with the highest utilization rates – PEI, Nova Scotia and British Columbia. The same relationship also exists to some extent with dental care, as noted above. Quebec appears as somewhat of an outlier, with lower rates of GP utilization alongside the lowest proportion reporting a regular doctor, yet relatively low or no inequity in GP probability and total number of visits, respectively. This finding could relate to Quebeckers' relatively easier access to specialists, as reflected in the high rate of use and comparatively low level of pro-rich inequity.
These findings should be interpreted in light of the methodological limitations of this study. Self-reported healthcare use may be biased because of problems in recall. If recall difficulties affect all population groups equally, then they are not a problem; however, if population groups report use in a systematically different way (e.g., older people may have worse recall), then bias is introduced. Some researchers believe self-reporting of physician visits may be unreliable (Roberts et al. 1996). Recall for hospital visits is generally better than that for physician contacts (Barer et al. 1982).
Considerable debate surrounds the approximation of need with self-reported health status (Goddard and Smith 2001). First, although measuring need for healthcare with ill health is the most convenient and commonly used approach, it assumes that all health problems being measured are effectively treated by healthcare, which is not always the case. Second, biases in the reporting of health may systematically exist across population groups (Adamson et al. 2003; O'Donnell and Propper 1991; Lindeboom and van Doorslaer 2004). However, numerous studies support the validity of self-reported health status, demonstrating significant relationships with other measures of health status (Kaplan and Camacho 1983; Mossey and Shapiro 1982; Sutton et al. 1999). It is also important to note that missing data (mostly income of younger age groups) reduces the generalizability of the findings to the under-20 population. Finally, this line of research, which is based on a macro study of inequity in healthcare in Canada rather than a micro-level investigation of a specific disease or service category, does not address the issue of appropriateness or quality of care.
To conclude, this study reveals some variation across the provinces in rates of healthcare use and also in levels of income-related inequity alongside apparent national trends. These trends include evidence of inequity favouring higher-income groups (for GP, specialist and dentist visit probability, total specialist and dentist visits and, to a lesser extent, number of specialist and dental visits conditional on one visit) and limited evidence of pro-poor inequity (in hospital care and number of GP visits). In the absence of direct financial barriers to access, these findings could relate to geographical barriers, inability to secure a regular physician, lack of insurance for the costs associated with physician services, such as prescription drugs, and difficulty in obtaining a referral to specialist care. Financial barriers may, however, exist in the case of specialist care, since not all services are fully funded by provincial public insurance systems, e.g., some dermatology and ophthalmology services. Moreover, inequity is clearly the highest in dental care, where there is very little public funding; therefore, substantial costs likely deter lower-income groups from seeking care. These national trends suggest that the federal oversight and public funding of hospital and physician sectors help to achieve the goal of “reasonable and uniform” access to care, in particular in hospital and GP services, as indicated by low levels of inequity in healthcare use. Further research into provincial policies that affect utilization, such as the coverage of services outside the public insurance programs, will increase understanding of the observed variations in levels and drivers of inequity.
Acknowledgements
This analysis is based on Statistics Canada's Canadian Community Health Survey, Cycle 2.1 (2003), Public Use Microdata File, which contains anonymized data. All computations on these microdata were prepared by the author, and the responsibility for their use and interpretation is entirely that of the author. An earlier version of this paper was published by LSE Health (Allin 2006). The author is grateful for the comments by Cristina Masseria, Julian Le Grand, Elias Mossialos, Kimberlyn McGrail, Eddy van Doorslaer, Alistair McGuire, Pierre-Gerlier Forest, and the editors and anonymous reviewers of Healthcare Policy/Politiques de Santé.
References
- Adamson J., Ben-Shlomo Y., Chaturvedi N., Donovan J. Ethnicity, Socio-economic Position and Gender – Do They Affect Reported Health-care Seeking Behaviour? Social Science and Medicine. 2003;57:895–904. doi: 10.1016/s0277-9536(02)00458-6. [DOI] [PubMed] [Google Scholar]
- Aday L.A., Andersen R.M. Equity of Access to Medical Care: A Conceptual and Empirical Overview. Medical Care. 1981;19:4–27. [PubMed] [Google Scholar]
- Allin S. Equity in the Use of Health Services in Canada and Its Provinces. London: LSE Health; 2006. [Google Scholar]
- Alter D.A., Naylor D.C., Austin P., Tu J.V. Effects of Socioeconomic Status on Access to Invasive Cardiac Procedures and on Mortality After Acute Myocardial Infarction. New England Journal of Medicine. 1999;341(18):1359–67. doi: 10.1056/NEJM199910283411806. [DOI] [PubMed] [Google Scholar]
- Asada Y., Kephart G. Equity in Health Services Use and Intensity of Use in Canada. BMC Health Services Research. 2007;7:41. doi: 10.1186/1472-6963-7-41. [DOI] [PMC free article] [PubMed] [Google Scholar]
- Barer M., Manga P., Shillington R. Income Class and Hospital Use in Ontario. Toronto: Ontario Economic Council; 1982. [Google Scholar]
- Bhatti T., Rana Z., Grootendorst P. Dental Insurance, Income and the Use of Dental Care in Canada. Journal of the Canadian Dental Association. 2007;73(1):57. [PubMed] [Google Scholar]
- Birch S., Abelson J. Is Reasonable Access What We Want? Implications of, and Challenges to, Current Canadian Policy on Equity in Health Care. International Journal of Health Services. 1993;23(4):629–53. doi: 10.2190/K18V-T33F-1VC4-14RM. [DOI] [PubMed] [Google Scholar]
- Birch S., Eyles J., Newbold K.B. Equitable Access to Health Care: Methodological Extensions to the Analysis of Physician Utilization in Canada. Health Economics. 1993;2:87–101. doi: 10.1002/hec.4730020203. [DOI] [PubMed] [Google Scholar]
- Canadian Institute for Health Information (CIHI) Health Indicators. Ottawa: Statistics Canada; 2006. [Google Scholar]
- Demeter S., Reed M., Lix L., MacWilliam L., Leslie W.D. Socioeconomic Status and the Utilization of Diagnostic Imaging in an Urban Setting. Canadian Medical Association Journal. 2005;173(10):1173–77. doi: 10.1503/cmaj.050609. [DOI] [PMC free article] [PubMed] [Google Scholar]
- Donabedian A. Models for Organising the Delivery of Personal Health Services and Criteria for Evaluating Them. Milbank Memorial Fund Quarterly. 1972;50:103–54. [Google Scholar]
- Dunlop P.C., Coyte P.C., McIsaac W. Socio-economic Status and the Utilisation of Physicians' Services: Results from the Canadian National Population Health Survey. Social Science and Medicine. 2000;51(1):123–33. doi: 10.1016/s0277-9536(99)00424-4. [DOI] [PubMed] [Google Scholar]
- Finkelstein M.M. Do Factors Other Than Need Determine Utilization of Physicians' Services in Ontario? Canadian Medical Association Journal. 2001;165(5):656–70. [PMC free article] [PubMed] [Google Scholar]
- Glazier R., Tepper J., Agha M.M., Moineddin R. Primary Care in Disadvantaged Populations. In: Jaakimainen L., Upshur R., Klein-Geltink J., Leong A., Maaten S., Schultz S., Wang L., editors. Primary Care: A Practice Atlas. Toronto: Institute for Clinical Evaluative Studies; 2006. [Google Scholar]
- Goddard M., Smith P. Equity of Access to Health Care Services: Theory and Evidence from UK. Social Science and Medicine. 2001;53:1149–62. doi: 10.1016/s0277-9536(00)00415-9. [DOI] [PubMed] [Google Scholar]
- Grootendorst P. Beneficiary Cost Sharing under Canadian Provincial Prescription Drug Benefit Programs: History and Assessment. Canadian Journal of Clinical Pharmacology. 2002;9(2):79–99. [PubMed] [Google Scholar]
- Health Services Restructuring Commission. From Here to Where? Defining the “Next Steps” in Health System Reform. Toronto: Ontario Ministry of Health and Long-Term Care; 1999. [Google Scholar]
- Kaplan G., Camacho T. Perceived Health and Mortality: A Nine-Year Follow-up of the Human Population Laboratory Cohort. American Journal of Epidemiology. 1983;117:292. doi: 10.1093/oxfordjournals.aje.a113541. [DOI] [PubMed] [Google Scholar]
- Lindeboom M., van Doorslaer E. Cut-Point Shift and Index Shift in Self-Reported Health. Journal of Health Economics. 2004;23(6):1083–99. doi: 10.1016/j.jhealeco.2004.01.002. [DOI] [PubMed] [Google Scholar]
- Manga P., Broyles R.W., Angus D.E. The Determinants of Hospital Utilization under a Universal Public Insurance Program in Canada. Medical Care. 1987;25(7):658–70. doi: 10.1097/00005650-198707000-00009. [DOI] [PubMed] [Google Scholar]
- Marchildon G.P. Health Systems in Transition: Canada. Copenhagen: WHO Regional Office for Europe; 2005. on behalf of the European Observatory on Health Systems and Policies. [Google Scholar]
- McIsaac W., Goel V., Naylor D. Socio-economic Status and Visits to Physicians by Adults in Ontario, Canada. Journal of Health Services Research and Policy. 1997;2(2):94–102. doi: 10.1177/135581969700200207. [DOI] [PubMed] [Google Scholar]
- Mhatre S.L., Deber R.B. From Equal Access to Health Care to Equitable Access to Health Care: A Review of Canadian Provincial Health Commissions and Reports. International Journal of Health Services. 1992;22(4):645–68. doi: 10.2190/UT6U-XDU0-VBQ6-K11E. [DOI] [PubMed] [Google Scholar]
- Ministry of Health; Ministry Responsible for Seniors. Health Goals for British Columbia. Victoria, BC: Ministry of Health and Ministry Responsible for Seniors; 1997. [Google Scholar]
- Mossey J., Shapiro E. Self-Rated Health: A Predictor of Mortality among the Elderly. American Journal of Public Health. 1982;72:800. doi: 10.2105/ajph.72.8.800. [DOI] [PMC free article] [PubMed] [Google Scholar]
- O'Donnell O., Propper C. Equity and Distribution of UK National Health Service Resources. Journal of Health Economics. 1991;10:1–19. doi: 10.1016/0167-6296(91)90014-e. [DOI] [PubMed] [Google Scholar]
- Oliver A., Mossialos E. Equity of Access to Health Care: Outlining the Foundation for Action. Journal of Epidemiology and Community Health. 2004;58(8):655–58. doi: 10.1136/jech.2003.017731. [DOI] [PMC free article] [PubMed] [Google Scholar]
- Roberts R.O., Bergstralh E.J., Schmidt I., Jacobsen S.J. Comparison of Self-Reported and Medical Record Health Care Utilisation Measures. Journal of Clinical Epidemiology. 1996;49:989–95. doi: 10.1016/0895-4356(96)00143-6. [DOI] [PubMed] [Google Scholar]
- Romanow R.J. Building on Values: The Future of Health Care in Canada. Ottawa: Commission on the Future of Health Care in Canada; 2002. [Google Scholar]
- Roos N.P., Forget E., Walld R., MacWilliam L. Does Universal Comprehensive Insurance Encourage Unnecessary Use? Evidence from Manitoba Says ‘No’. Canadian Medical Association Journal. 2004;170(2):209–14. [PMC free article] [PubMed] [Google Scholar]
- Roos N.P., Mustard C.A. Variation in Health and Health Care Use by Socioeconomic Status in Winnipeg, Canada: Does the System Work Well? Yes and No. Milbank Quarterly. 1997;75(1):89–111. doi: 10.1111/1468-0009.00045. [DOI] [PMC free article] [PubMed] [Google Scholar]
- Sutton M., Carr-Hill R., Gravelle H., Rice N. Do Measures of Self-Reported Morbidity Bias the Estimation of the Determinants of Health Care Utilization? Social Science and Medicine. 1999;49:867–78. doi: 10.1016/s0277-9536(99)00169-0. [DOI] [PubMed] [Google Scholar]
- Tuohy C.H., Flood C.M., Stabile M. How Does Private Finance Affect Public Health Care Systems? Marshaling the Evidence from OECD Countries. Journal of Health Politics, Policy and Law. 2004;29(3):359–96. doi: 10.1215/03616878-29-3-359. [DOI] [PubMed] [Google Scholar]
- van Doorslaer E., Masseria C. Income-Related Inequality in the Use of Medical Care in 21 OECD Countries. Paris: Organisation of Economic Co-operation and Development; 2004. [Google Scholar]
- Veugelers P.J., Yip A.M. Socioeconomic Disparities in Health Care Use: Does Universal Coverage Reduce Inequalities in Health? Journal of Epidemiology and Community Health. 2003;57(6):424–28. doi: 10.1136/jech.57.6.424. [DOI] [PMC free article] [PubMed] [Google Scholar]
- Wagstaff A., van Doorslaer E. Equity in Health Care Finance and Delivery. In: Culyer A.J., Newhouse J.P., editors. Handbook of Health Economics. Amsterdam: Elsevier; 2000. pp. 1803–62. [Google Scholar]
- Wagstaff A., van Doorslaer E., Watanabe N. On Decomposing the Causes of Health Sector Inequalities with an Application to Malnutrition Inequalities in Vietnam. Journal of Econometrics. 2003;112(1):207–23. [Google Scholar]


