

Abstract
It has long been known that cholera outbreaks can be initiated when Vibrio cholerae, the bacterium that causes cholera, is present in drinking water in sufficient numbers to constitute an infective dose, if ingested by humans. Outbreaks associated with drinking or bathing in unpurified river or brackish water may directly or indirectly depend on such conditions as water temperature, nutrient concentration, and plankton production that may be favorable for growth and reproduction of the bacterium. Although these environmental parameters have routinely been measured by using water samples collected aboard research ships, the available data sets are sparse and infrequent. Furthermore, shipboard data acquisition is both expensive and time-consuming. Interpolation to regional scales can also be problematic. Although the bacterium, V. cholerae, cannot be sensed directly, remotely sensed data can be used to infer its presence. In the study reported here, satellite data were used to monitor the timing and spread of cholera. Public domain remote sensing data for the Bay of Bengal were compared directly with cholera case data collected in Bangladesh from 1992–1995. The remote sensing data included sea surface temperature and sea surface height. It was discovered that sea surface temperature shows an annual cycle similar to the cholera case data. Sea surface height may be an indicator of incursion of plankton-laden water inland, e.g., tidal rivers, because it was also found to be correlated with cholera outbreaks. The extensive studies accomplished during the past 25 years, confirming the hypothesis that V. cholerae is autochthonous to the aquatic environment and is a commensal of zooplankton, i.e., copepods, when combined with the findings of the satellite data analyses, provide strong evidence that cholera epidemics are climate-linked.
Cholera is an acute intestinal disease caused by the bacterium Vibrio cholerae. The disease frequently strikes in the form of severe epidemics, in Bangladesh and other developing countries, that occur with a more or less annual periodicity. The seventh pandemic of cholera started in 1961 and currently affects six continents (1, 2). Cholera is one of a number of infectious diseases that appears to be influenced by climatic changes (2–4). The study reported here was undertaken to gather data needed to develop a cholera prediction model that would monitor ocean parameters, based on remote sensing (RS) data, and provide early warning of conditions associated with cholera outbreaks. Therefore, the focus of the study was on public domain data sources to determine what, if any, relationship could be detected between remotely sensed ocean parameters and cholera case data for Bangladesh. These relationships are important in model development. When such a model for Bangladesh is extended to the global scale, it can serve as an early warning system for cholera, enabling an effective deployment of resources to minimize or prevent cholera epidemics in cholera endemic regions.
Ideally, to verify the sequence of events linking ocean parameters, e.g., phytoplankton blooms with zooplankton blooms, which in turn are linked to cholera cases, field data on seawater temperature, nutrient concentration, and related parameters, including plankton biomass and cholera case data, are necessary. Water samples collected along transects in the Bay of Bengal have been analyzed, but the data available are sparse and infrequent. Shipboard collection of water and plankton specimens is both expensive and time-consuming, and interpolation to regional scales is also difficult. Because oceanic phytoplankton provide a food source for zooplankton, both phytoplankton and zooplankton, in general, are associated spatially and temporally (5). Given that relationship, both phytoplankton and zooplankton can be monitored by using RS data because oceanic phytoplankton concentrations can be estimated by using RS data. A significant marine reservoir of V. cholerae is plankton, and the bacterium attaches primarily to zooplankton, specifically copepods (6). Because extensive field data had not been collected in previous years, those data that were available were archived RS data and cholera case data for Bangladesh. The archived RS data that were chronologically concurrent with cholera case data included sea surface temperature (SST) and sea surface height (SSH). SST was used because it has been related to phytoplankton concentration (7, 8) whereas SSH was used because it may be related to human–plankton contact. Unfortunately, because ocean color data were not acquired during the periods in which there were other RS data and cholera case data, temporal relationships between cholera and phytoplankton distribution could not be investigated. The RS data available for the coastal region of Bangladesh, i.e., the delta region of the Ganges and Brahmaputra Rivers (Fig. 1), were gathered from existing archives and were analyzed to determine whether a temporal relationship existed between these RS measurements and timing of cholera outbreaks.
Figure 1.
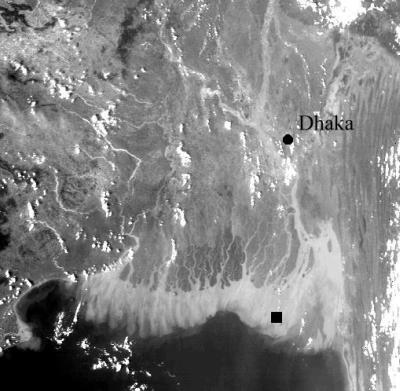
Gray scale image of AVHRR image from October 26, 1992. The approximate location of the SST and SSH sample point is indicated as a black rectangle in the lower right.
Data
Case Data.
Weekly cholera case data for 1980–1995 were obtained from the International Centre for Diarrhoeal Disease Research, B Hospital surveillance program (G.F., unpublished work; B. Sack, personal communication). These data provided a systematic subsample of all patients presenting to the hospital for out-patient or in-patient treatment each week. The data included the number of persons tested, the number positive for cholera, and the percent positive for cholera. The latter will be referred to as “percent cholera” in this study. These cholera outbreaks in Bangladesh have been shown to comprise typically two seasonal peaks, in spring and again in the fall. The case data were concurrent with sea surface temperature data for 1989–1995 (Fig. 2).
Figure 2.

Percent of patients reporting positive for cholera in the International Centre for Diarrhoeal Disease Research, Bangladesh. Hospital surveillance program for 1989–1995 (G.F. and A.S.G.F., unpublished data; B. Sack, personal communication).
RS Data.
RS data included SST (Fig. 3) and SSH (Fig. 4). Ocean temperature is measured by using thermal-infrared wavelengths, so the quantity measured is the emitted radiance, i.e., the surface temperature. Multichannel SST estimates were computed from a combination of two ambient temperature channels on the National Oceanographic and Atmospheric Administration's (NOAA's) Advanced Very High Resolution Radiometer (AVHRR) sensor and are archived in that form (9, 10). These data were available in weekly composites that were resampled to 18-km global coverage [National Aeronautics and Space Administration (NASA) Jet Propulsion Laboratory Physical Oceanography Distributed Active Archive Center (http://podaac.jpl.nasa.gov)]. SSH measurements were sea surface anomalies derived from the difference between corrected altimeter measurements and 3-year mean ocean surface [University of Texas Center for Space Research (http://www.csr.utexas. edu)]. SSH data are available on a 10-day cycle from the Jet Propulsion Laboratory's TOPEX/Poseidon radar altimeter range measurements. The satellite requires 10 days to complete one global cycle of coverage. At one-degree spatial resolution, the data had the coarsest spatial resolution of all of the data examined. TOPEX/Poseidon was launched in September, 1992, and no available public domain ocean altimeter data were available before its launch. Other satellites are now available to provide radar altimetry, such as the European Space Agency's ERS-1 (launched July, 1991) and ERS-2 (launched April, 1995). The U.S. launched SeaStar (OrbView-2) satellite in August, 1997, which carries the Sea-Viewing Wide Field-of-View Sensor (SeaWiFS) that now provides global estimates of oceanic chlorophyll concentration.
Figure 3.

Bay of Bengal Sea Surface Temperatures for 1993 (A) and coastal Bangladesh SST data for 1989–1995 (B) [NASA Jet Propulsion Laboratory Physical Oceanography Distributed Active Archive Center (http://podaac.jpl.nasa.gov)].
Figure 4.

Bay of Bengal SSH monthly anomalies for 1993 (A) and coastal Bangladesh SSH for 1992–1995 (B) [Center for Space Research, University of Texas, Austin, TX (http://www.csr.utexas.edu)].
The temporal overlaps between the different data sets on hand are shown in Fig. 5. The core data for the study were the cholera case data, sea surface temperatures, and sea surface height anomalies for late 1992 through the end of 1995.
Figure 5.

Periods covered by the data sets in the present study.
Although additional cholera case data are not currently available, these RS data are still being archived and now include SeaWiFS-derived chlorophyll concentration data from September, 1997 through the present [NASA Goddard Distributed Active Archive Center (http://daac.gsfc.nasa.gov); ref. 11].
Methodology
The data set employed in this study comprised SST, SSH, and cholera case data. Image data were downloaded from the internet sites given above and were imported into an image-processing program (imagine, ERDAS, Atlanta). For each time date, SST and SSH pixel values from one point off the coast of Bangladesh (Fig. 1) were extracted from the images. However, similar temporal patterns were detected for other locations. SST data were examined from 1989–1995 (Fig. 3) whereas SSH data were available for September, 1992–1995 (Fig. 4). These point data were compared with cholera case data (Fig. 2) by superimposing the data plots (Fig. 6) to detect patterns. Statistical analyses were done (E. Russek-Cohen, personal communication), with results showing statistically significant correlations. Recent SeaWiFS-derived chlorophyll concentration data were also available but were not concurrent with the cholera case data and were also overlaid on the SST and SSH data (Fig. 7).
Figure 6.

Cholera cases (solid line), SST (dashed), and SSH (dotted) data for September, 1992–1995. In 1994 and 1995, cholera cases followed the SST cycle; however, in spring, 1993, SSH was the lowest for this period.
Figure 7.

SeaWiFS-derived chlorophyll concentration for February, 1998 (A) and overlaid with SST and SSH data for 1997–1998 (B) [NASA Goddard Space Flight Center; (http://daac.gsfc.nasa.gov); ref 11]. Chlorophyll a concentration drops to zero because of missing data in May and June, 1998.
Results and Discussion
The SST data showed a consistent annual bimodal cycle, and, in 1992, 1994, and 1995, cholera outbreaks showed a statistically significant association with this cycle (Fig. 6). This relationship was expected because plankton blooms depend on warm ocean temperatures. Although other variables, such as nutrient load associated with run-off, mixing, upwelling, light availability, etc., may be related to plankton blooms, the relationship between SST and V. cholerae is more direct. Furthermore, it is now known that plankton serve as a reservoir for V. cholerae (2). The delay between the time of SST increase until cholera cases increase can be accounted for by the hypothesized response of phytoplankton to increased temperature and subsequent zooplankton bloom, the latter closely approximating the increase in cholera. Interestingly, in 1993, an association was not observed. Although the SSTs were within the normal range for that year, spring SSHs were the lowest observed for the entire period, 1992–1995. In October, 1993, the SSHs were above those expected, and the next month, a cholera outbreak occurred. Bangladesh is at, or only slightly above, sea level, with tidal influences as far inland as Dhaka (Fig. 1), providing an explanation for the observed pattern. The SSH and cholera data relationships for 1993 suggest the extent of tidal intrusion of plankton into inland waters influences the Vibrio-human contact, as water is consumed from the river system, without treatment, and used for daily hygiene, e.g., washing etc., by a majority of residents in Bangladesh. As noted, SSHs were anomalously low, indicating little or no inland intrusion of plankton. In October, when the SSHs returned to normal, an outbreak of cholera occurred shortly thereafter.
Another pattern was observed in 1995. The outbreak of cholera in the fall followed an unusually high SSH event in the early summer. However, before this late summer outbreak, there was an early summer decrease in cholera cases that had been recorded that cannot be explained by either the SST or SSH data. Analysis of the plankton community structure will be helpful (R.C. and A.H., unpublished work), but salinity also must be considered because V. cholerae has an absolute requirement for Na+ (12, 13). Salinity has been shown to be related to cholera toxin production, with estuarine and riverine salinities proving optimum (12, 13).
With the launch of SeaWiFS, chlorophyll concentration data are accessible and can be placed on top of the SST and SSH data. For the time period shown in Fig. 7, there was a general agreement in the patterns of SST, SSH, and chlorophyll values. With only a little over a year's worth of data, the relationships between these parameters is unclear, and the connection to cholera will be unknown until case data are available. Cloudy conditions prevented chlorophyll estimation during part of May and June, 1998; hence, limited data were available during that time period. Overall, chlorophyll concentration values showed large variations in 1998, which may be related to the unusually severe monsoon season during July through September, 1998 (Fig. 7B).
Because field measurements of plankton biomass are not available, these interactions could not be verified. However, a major study, funded by the National Institutes of Health, was launched in late 1996 that has allowed us to obtain data needed for future analyses. For example, to verify linkage between ocean conditions and cholera epidemics, plankton concentration or biomass estimates are now being collected. Phytoplankton concentration estimates can be inferred from chlorophyll concentrations estimated from ocean color imagery, e.g., acquired by SeaWiFS. The NASDA (Japanese Space Agency) Advanced Earth Observing Satellite (ADEOS), which carried the Ocean Color and Temperature Scanner (OCTS), was launched in August, 1996, but its power failure in June, 1997 prevented acquisition of additional chlorophyll concentration data.
Future Directions
Although RS data has the potential to provide chlorophyll concentration, field data (shipboard water sampling) coincident with RS-derived chlorophyll concentration estimates are being gathered for prospective analyses. Field measurements include estimates of specific plankton biomass (phytoplankton and zooplankton) and identification of the major taxa present, as well as nutrient abundance. Given sufficient temporal resolution, RS-derived estimates of chlorophyll concentration (phytoplankton) coupled with field measurements of zooplankton abundance and their movement will be used to monitor the geographical distribution of plankton and plankton-associated V. cholerae by ocean currents. With verification by field measurements, the relationship between cholera outbreaks and SST and SSH identified in this study will be combined with plankton distribution patterns to predict cholera outbreaks. A predictive model for cholera in the Bay of Bengal is currently under development, and a global model is now possible, after the Bay of Bengal model is extended to other regions of cholera outbreaks.
Acknowledgments
The authors express appreciation to Steven Nerem (Center for Space Research, University of Texas, Austin, TX) and Philip Woodworth (Proudman Oceanographic Laboratory, Bidston Observatory, Birkenhead, U.K.) for information concerning sea surface topography and anomaly data. Information related to this project can be found at http://geo.arc.nasa.gov/sge/health/projects/cholera/cholera.html. This is a cooperative project between the University of Maryland Biotechnology Institute and the NASA's Life Sciences Division. The University of Maryland Biotechnology Institute gratefully acknowledges support from the NASA to develop a RS/GIS component in its cholera research program Grant NAG2-1195 and National Institutes of Health Grant 1RO1A139129-01, Environmental Protection Agency Grant R824995-01, and grants from the National Institutes of Health and NASA to R.C. and A.H.
Abbreviations
- RS
remote sensing
- SST
sea surface temperature
- SSH
sea surface height
Footnotes
This paper was submitted directly (Track II) to the PNAS office.
References
- 1.Pollitzer R. Cholera. Geneva: World Health Organization; 1959. pp. 11–50. [Google Scholar]
- 2.Colwell R R. Science. 1996;274:2025–2031. doi: 10.1126/science.274.5295.2025. [DOI] [PubMed] [Google Scholar]
- 3.Epstein P R, Ford T E, Colwell R R. Lancet. 1993;342:1216–1219. doi: 10.1016/0140-6736(93)92191-u. [DOI] [PubMed] [Google Scholar]
- 4.Patz J A, Epstein P R, Burke T A, Balbus J M. J Am Med Assoc. 1996;275:217–223. [PubMed] [Google Scholar]
- 5.Kiorboe T, Neilson T J. Limnol Oceanogr. 1994;39:493–507. [Google Scholar]
- 6.Huq A, Colwell R R. J Mar Biotechnol. 1995;3:60–63. [Google Scholar]
- 7.Chaturvedi N, Aishwarya N, Pandey P C. Ind J Mar Sci. 1998;27:286–291. [Google Scholar]
- 8.Muller-Karger F, Walsh J J, Evans R H, Meyers M B. J Geophys Res. 1991;96:12645–12665. [Google Scholar]
- 9.McClain E, Pichel W, Walton C. J Geophys Res. 1985;90:11587–11601. [Google Scholar]
- 10.Strong A, McClain E. Bull Am Meteorol Soc. 1984;85:138–142. [Google Scholar]
- 11.O'Reilly, J. E., Maritorena, S., Mitchell, B. G., Siegel, D. A., Carder, K. L., Garver, S. A., Kahru, M. & McClain, C. (1998) J. Geophys. Res.103 (C11), 24937–24954.
- 12.Singleton F L, Attwell R W, Jangi M S, Colwell R R. Appl Environ Microbiol. 1982;43:1080–1085. doi: 10.1128/aem.43.5.1080-1085.1982. [DOI] [PMC free article] [PubMed] [Google Scholar]
- 13.Singleton F L, Attwell R, Jangi S, Colwell R R. Appl Environ Microbiol. 1982;44:1047–1058. doi: 10.1128/aem.44.5.1047-1058.1982. [DOI] [PMC free article] [PubMed] [Google Scholar]